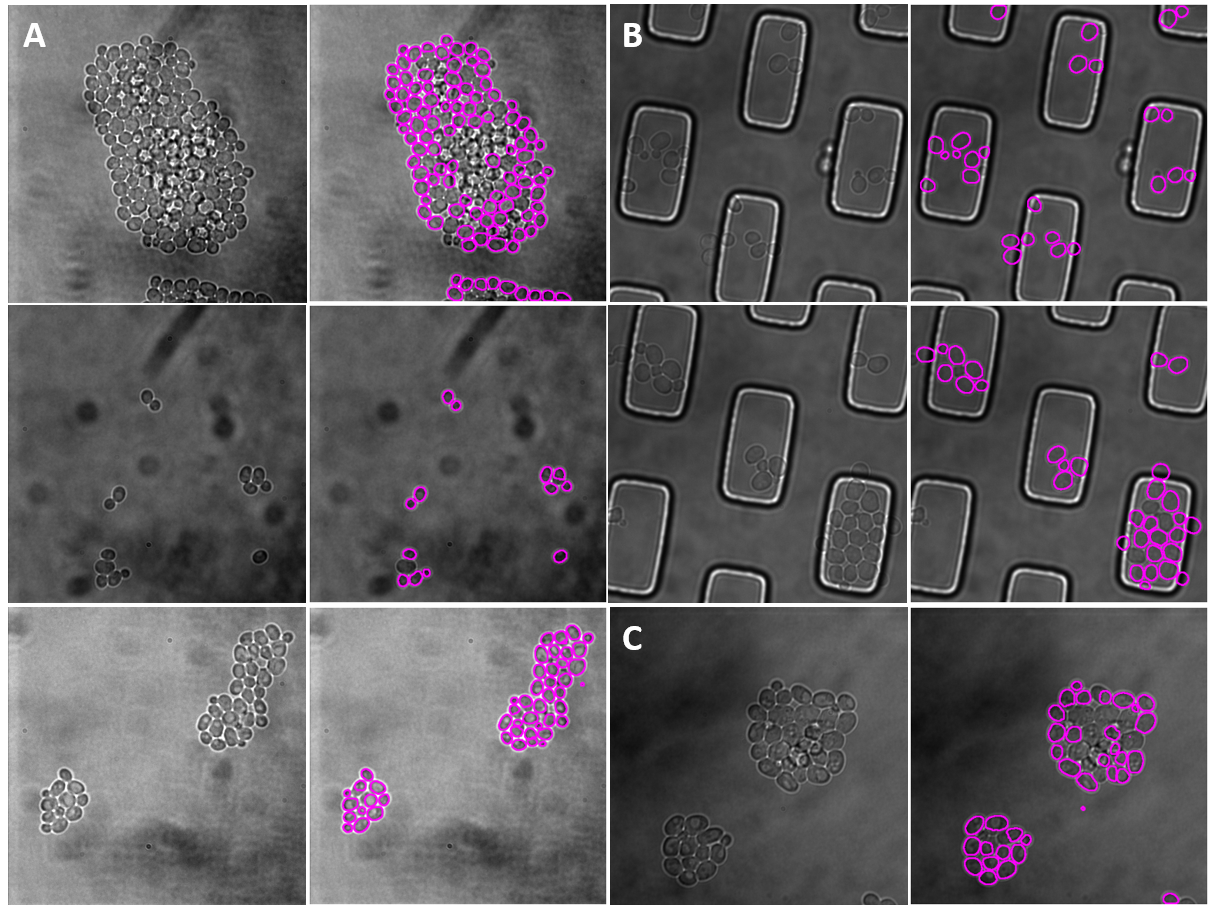
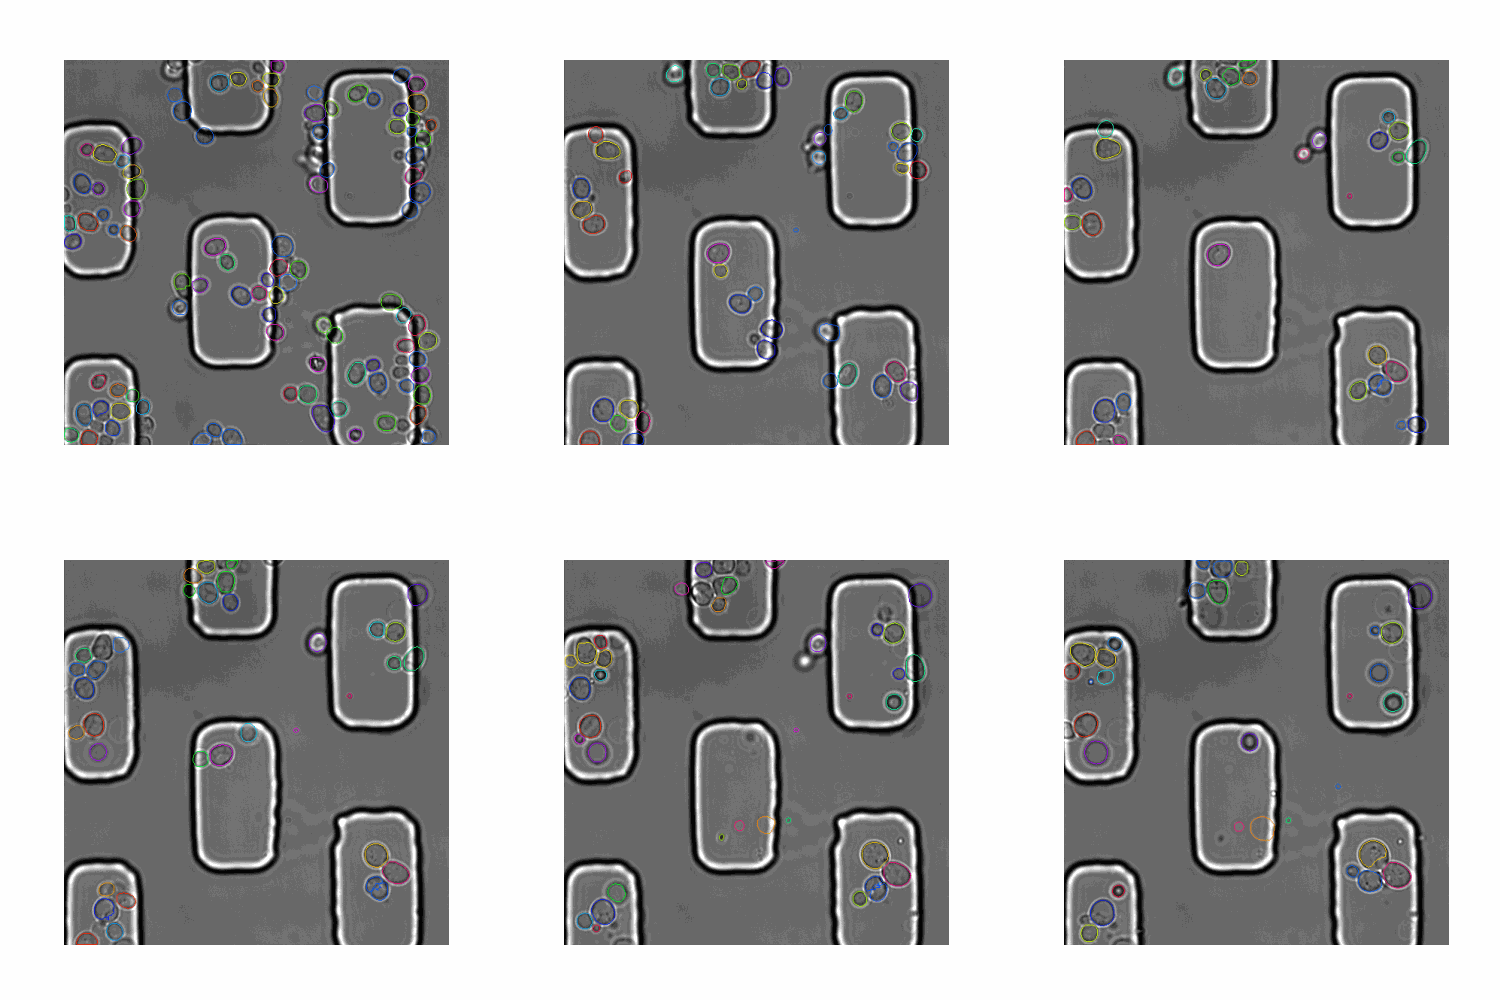
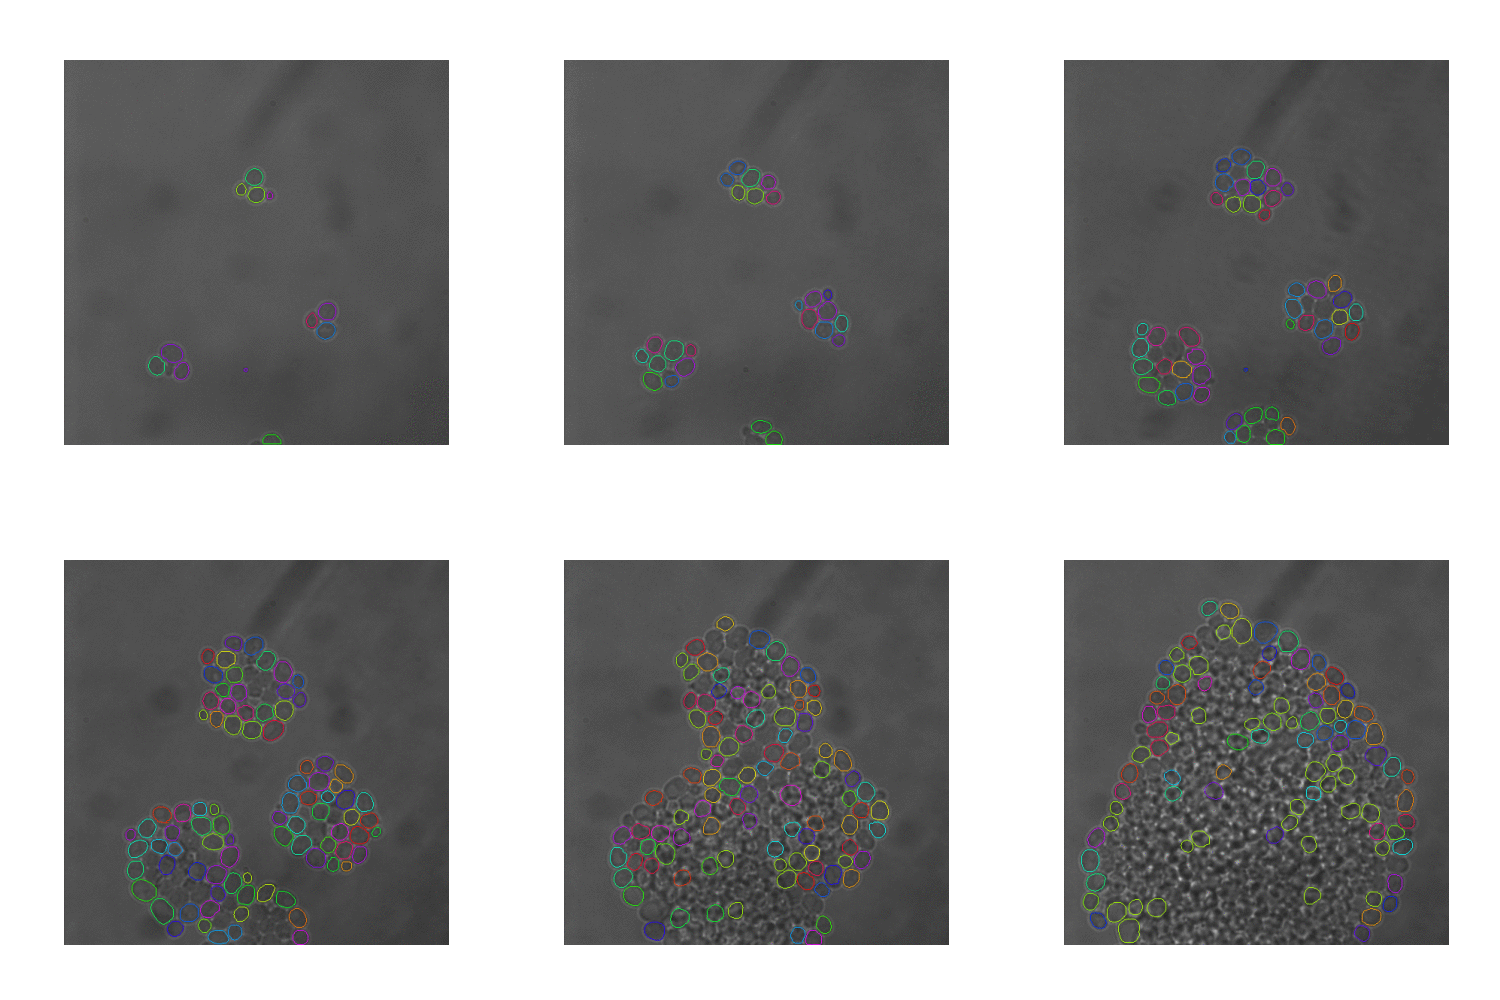
In this pipeline we created synthetic brightfield images of yeast cells and trained a mask R-CNN model on them. Then we used the trained network on real time-series brightfield microscopy data to automaticly segment and track budding yeast cells.
- Dr Andreas Milias Argeitis, principal investigator, University of Groningen, Faculty of Science and Engineering
- MSc Paolo Guerra, second principal investigator, University of Groningen, Faculty of Science and Engineering
- MSc Herbert Teun Kruitbosch, data scientist, University of Groningen, Data science team
- MSc Yasmin Mzayek, IT trainee, University of Groningen, Data Science trainee
- MA Sara Omlor, IT trainee, University of Groningen, Data Science trainee
Goals
- To create synthetic image data to train a deep convolutional neural network
- To implement an automatic segmentation pipeline using this network.
- To track cells across time frames
For creating the synthetic data set and training the network see the notebooks create_synthetic_dataset_for_training and train_mask_rcnn_network.
For segmentation and tracking on real data see example pipeline notebook.
All the notebooks can be run on Google Colab and automatically install and download all needed dependencies and data.
(To run the Mask R-CNN locally, you will need to install the Detecron2 library. For a guide to a Window's installation see these instructions. You also need to download the trained model file from https://datascience.web.rug.nl/models/yeast-cells/mask-rcnn/v1/model_final.pth)
Segmentation
-
Input Brightfield time-lapse images. The source file is either a multi-image tiff or multiple single-image tiffs.
-
Output The
outputvariable is a dictionary that provides a prediction box, prediction score, and a prediction mask for each instance segmentation in each frame. You can access the prediction masks bynp.array(output[<frame>]['instances'].pred_masks.to('cpu')).
Tracking
- Input The tracking results are obtained by applying the
clustering.cluster_cellsfunction on theoutputwhich uses DBSCAN to cluster the detections into labels representing the same cell over time. You can set a maximum time-distance of<dmax>frames for the algorithm to look at ahead and behind that current frame. This will calculate distances between all instances in a current frame and all the instances in the following and previous frames up to dmax. A higher dmax could control for intermittent false negatives because if a cell is missed in the following frame but picked up again 2 frames ahead, the cell will be tracked. However, this also increases the probability of misclassification due to cell growth and movement with time if you look ahead too far. Themin_samplesandepsvariables are required arguments for the DBSCAN algorithm. For further explanation see sklearn.cluster.DBSCAN. - Output A list of
labelsand a list of theircoordinates[time,y,x]. The labels give the same number (starting from 0) to the cells that are the same over time. -1 indicates noise. The numbers given to each track are arbitrary.
You can visualize the segmentations and tracks in a movie using visualize.create_scene and visualize.show_animation. Further, you can use visualize.select_cell to select a particular cell by label and zoom in on it to observe it better in the movie. The movie displayed with default options gives each cell a unique color that stays the same throughout the movie if the cell is tracked correctly. You also have the options to display the label number by setting the parameter labelnum to True.
Information and feature extraction
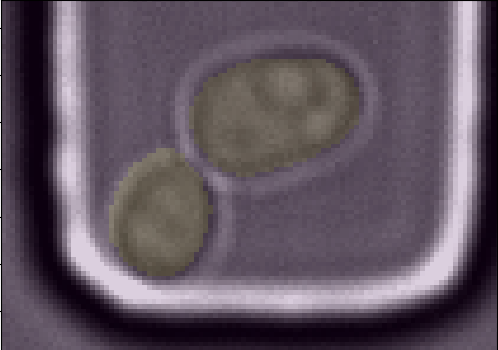
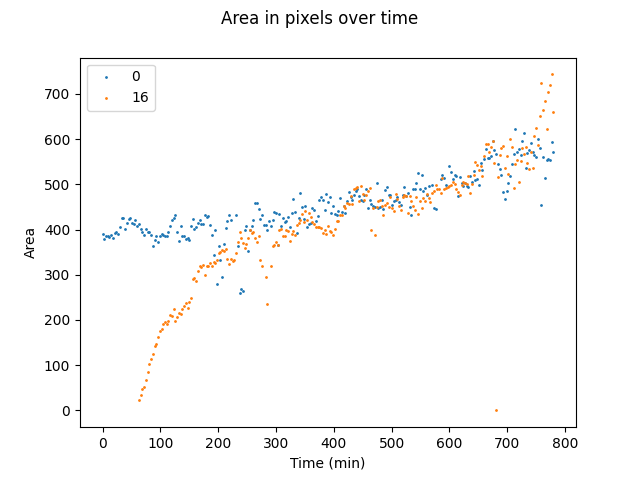
This pipeline allows you to extract information about the detected yeast cells in the time-series. The features.group function groups the segmentations by frame. You can use the features.get_seg_track function to find the number of segmentations and number of tracked cells (in total or by frame). The features.extract_contours function gives the contour points [x,y] for each segmentation. The masks for all segmented cell can be extracted using the function features.get_masks. The masks are then used to get the pixel area of each segmentation using features.get_areas. You can also visualize the masks over the original image using visualize.plot_mask_overlay as shown in the figure below.
|
| Figure 3. A mother/daughter pair of masks are overlayed over the original brightfield image. |
|
| Figure 4. Comparison of area profiles between mother (blue) and daughter (orange) cells. |
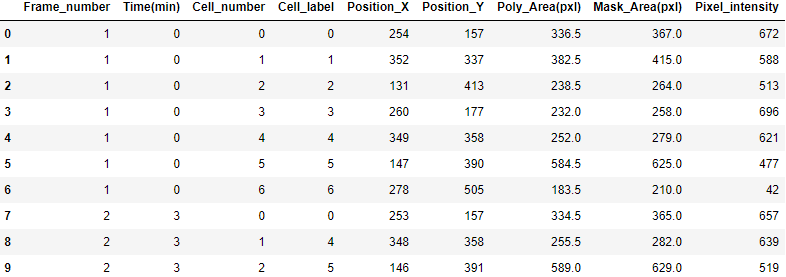
Further, if a flourescent channel is available, the pixel intensity of within each cell can also be calculated using the masks segmented on the brightfield images.
|
| Table 1. Example of Mask R-CNN pipeline output. |
See eval_calibration and YeaZ_evaluation.
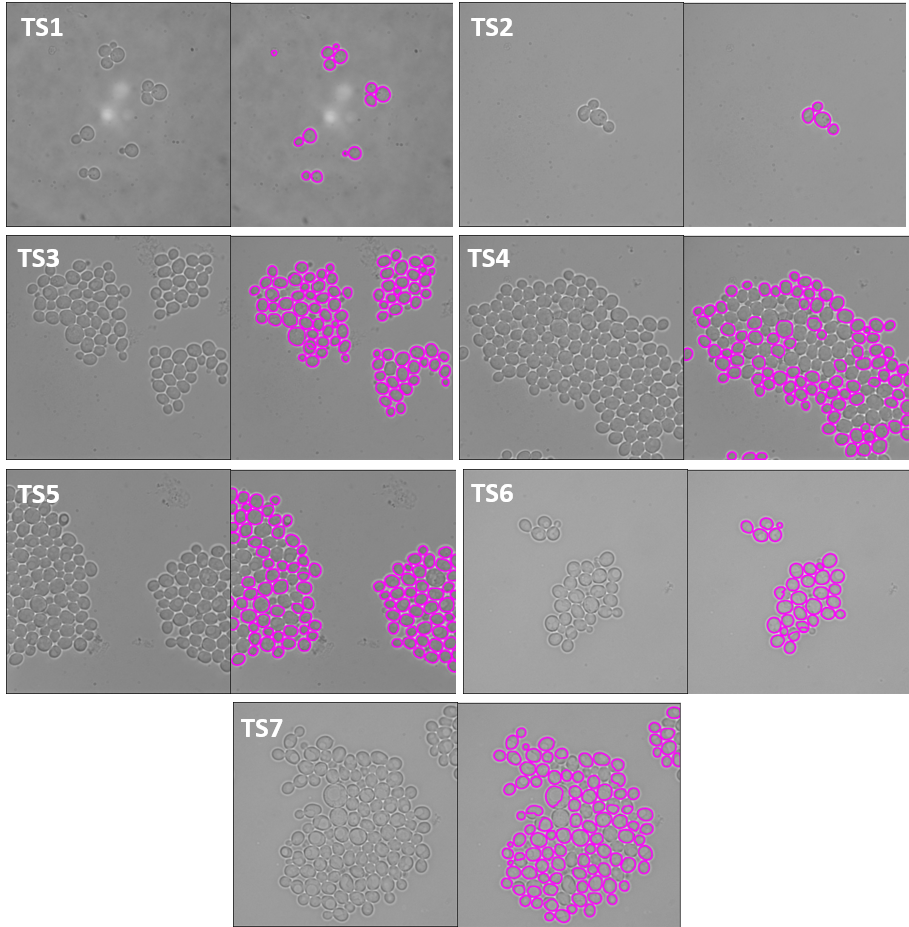
We evaluated our pipeline using benchmark data from the Yeast Image Toolkit (YIT) (Versari et al., 2017). On this platform, several exisiting pipelines have been evaluated for their segmentation and tracking performance. We tested our pipeline and that of YeaZ (Dietler et al., 2020) on several test sets from this platform.
|
| Figure 5. The 7 test sets we evaluated from YIT. The images show the first frame of time-series data. These test sets cover sparse, intermediate, and large colonies. |
We chose to compare our pipeline with YeaZ because they too use a deep learning CNN, unlike the other pipelines evaluated on YIT.
The YeaZ segmentation and tracking output was obtained by using the YeaZ-GUI with the recommended default parameters.
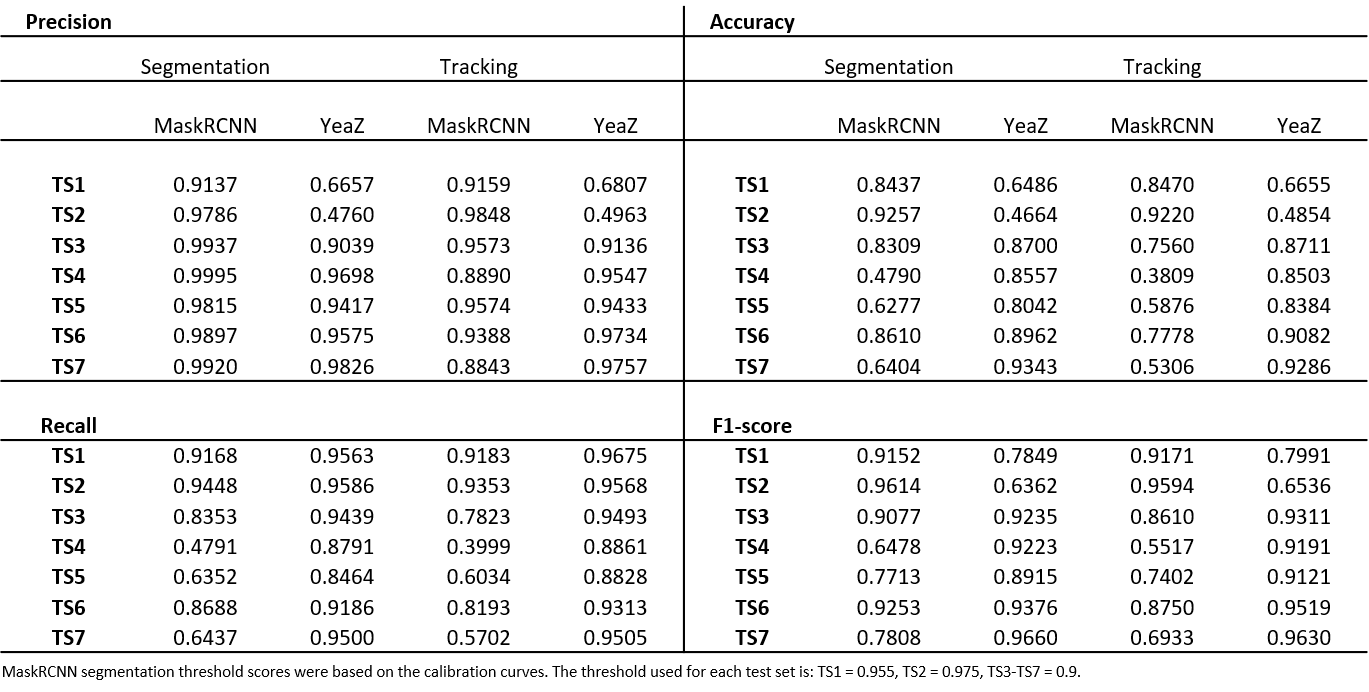
We matched the centroids provided in the benchmark ground truth data to the mask outputs of our pipeline and YeaZ. This is slightly different than the way it was done on the evaluation platform of YIT but comparable since they matched centroids of the prediction to the centroids of the ground truth with a maximum distance threshold to count as a true positive (see their EP for more detail). We then calculated precision, recall, accuracy, and the F1-score.
For our pipeline, we used calibration curves to set the segmentation threshold score needed by the mask R-CNN to define the probablity that an instance is a yeast cell.
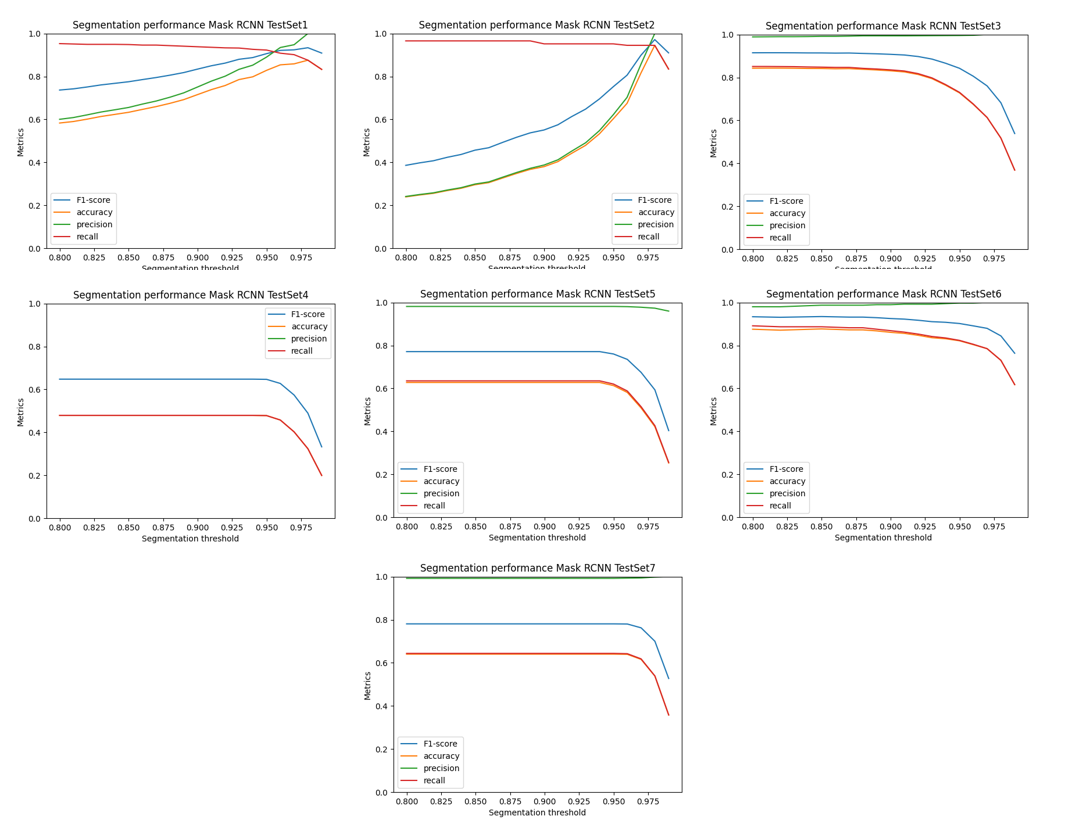
|
| Figure 6. Calibration curves for each test set plotting 4 different metrics against the segmentation threshold score. |
In the table below, we report the performance metrics for each test set for both YeaZ and our pipeline for comparison.
