The present repository, developed by Probayes, provides an example of the utilization of deep learning models to analyse X-ray images acquired in a medical context. More specifically, Convolutional Neural Networks (CNN) are used to classify chest X-ray images of patients suspected of being affected by a thoracic disease such as pneumonia or COVID-19, i.e. to predict whether a chest X-ray image has been acquired in a healthy patient or in a patient affected by a specific thoracic disease.
Model explainability, i.e. the ability to understand why the model returned a particular decision, is particularly important when Artificial Intelligence is used in the health domain. In the case of the automatic image analysis for instance via CNN models, explainability methods return the areas of the analysed image which were particularly exploited by the model to take its decision. Thus, they allow users to validate that the areas that contribute to prediction are indeed areas where information is located.
It allows to take a step back from the metrics used by data scientists to evaluate model performance. They make it easier for the practitioner to better understand the model and to valide the model from a medical point of view. In the long term, they can be a decision-making aid for the practitioner.
The present example is therefore used to illustrate the interest and limits of methods which can be used to explain the decisions of CNN models in a medical context.
While the feasibility and limits of chest X-ray automatic analysis have been explored for several years, the Covid-19 pandemic has provided an additional example of the interest of fast and accurate automatic analysis of chest X-ray or CT-scans images. Radiologists have indeed been required to analyse a substantial number of chest images as hospitals have been overflown with patients suspected of having been contaminated by the coronavirus.
A 3-class classification task has here been considered, namely the automatic classification of chest X-ray images acquired in (i) "normal" patients (i.e., patients without any thoracic disease), (ii) patients affected by a non covid-related pneumonia and (iii) patients affected by the COVID-19. The third release of the COVIDx dataset, which is a particularly large covid-related dataset, has here been chosen to complete the classification task. Examples of chest X-ray images composing this dataset can be seen below.
90% of these images have been used to train a CNN classification model, namely a ResNet-50 [He 2016]. This classic model has been chosen because it has been shown to be efficient for chest X-ray classification in a recent study [Wang 2020]. The remaining images have been put aside during training and exclusivey used to test the model, i.e. to evaluate its ability to correctly analyse images it had not seen during training. They have additionally been used to compare several explainability methods.
The ResNet-50 model was trained using the script
./scripts/train_resnet_covidx.py. More details on the traning can be found in
here.
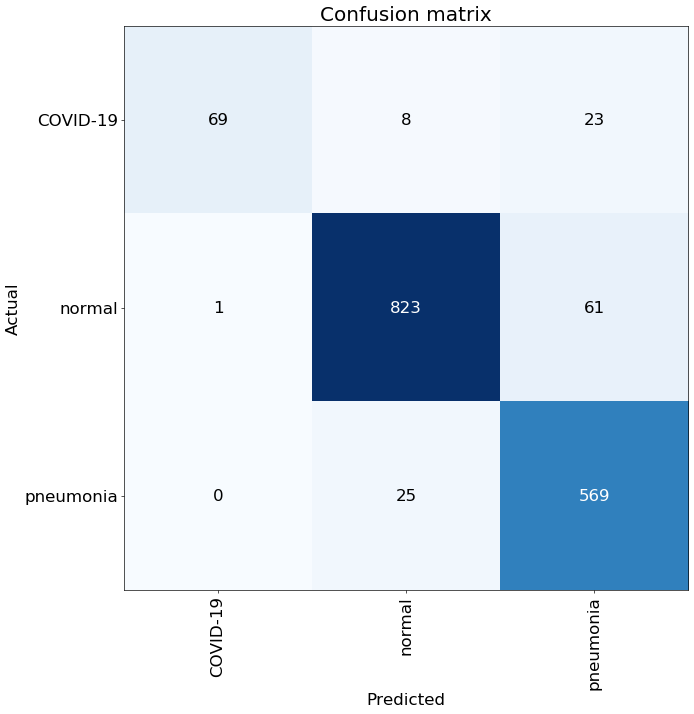
The confusion matrix below summarizes the successes and errors made by the model when fed with the test images:
Several classification metrics can be computed from this confusion matrix. Three metrics have here been considered, namely the precision, the recall and the f1-score.
- The precision focuses on the images which have been assigned the prediction
class c. It corresponds to the proportion of these images which trully belong to theclass c, and thus answers the question "Can I trust the model when it tells me that this image belongs toclass c?". - The recall focuses on the images which have trully belong to
class c. It corresponds to the proportion of these images which have been correctly assigned theclass cby the model, i.e. it answers the question "and thus answers the question "Can I trust the model to find all the images which belong toclass c?"." - The f1-score is the harmonic mean of the precision and recall, and is computed as follows: f1 = 2 * \dfrac{precision * recall} {precision + recall}. It summarizes the model performance.
The following metrics have been obtained on the test images:
| precision (PPV) | recall (sensitivity) | f1 | |
|---|---|---|---|
| normal | 0.96 | 0.93 | 0.95 |
| pneumonia | 0.87 | 0.96 | 0.91 |
| COVID-19 | 0.99 | 0.69 | 0.81 |
This part demonstrates that model interpretability is useful to understand why the model does a prediction and also to identify potential ways to improve the model.
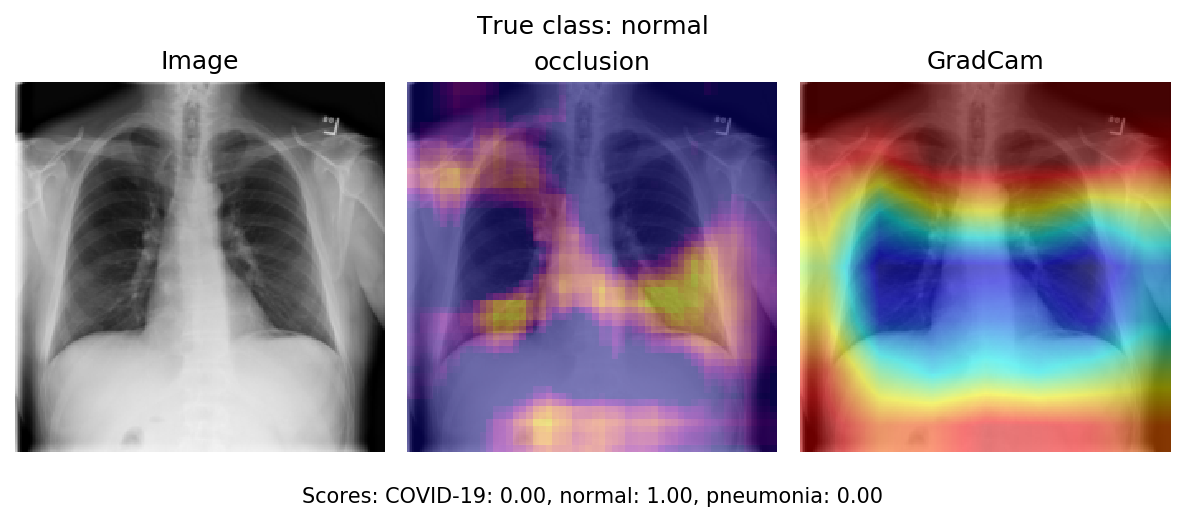
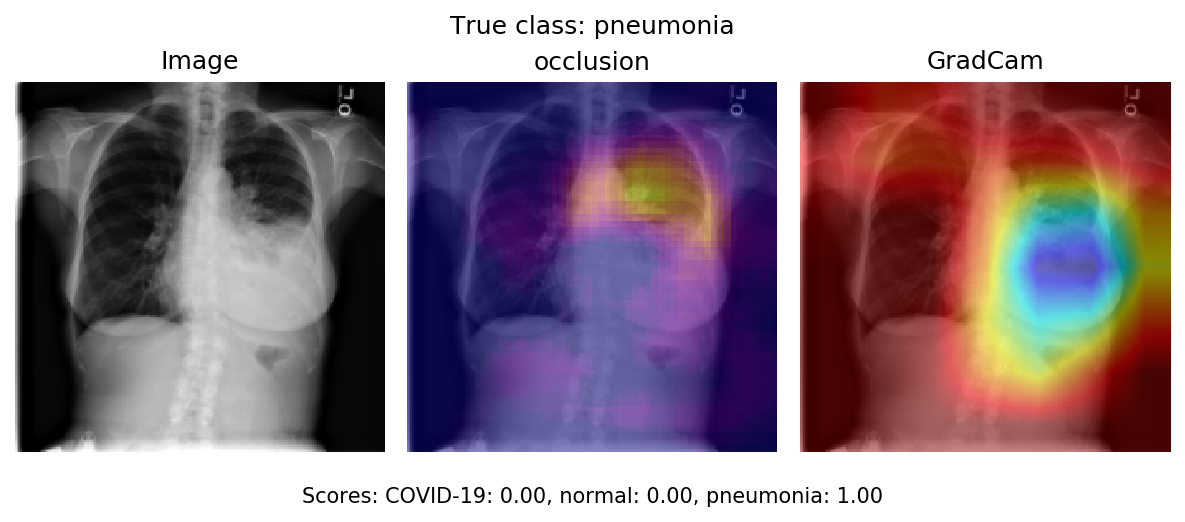
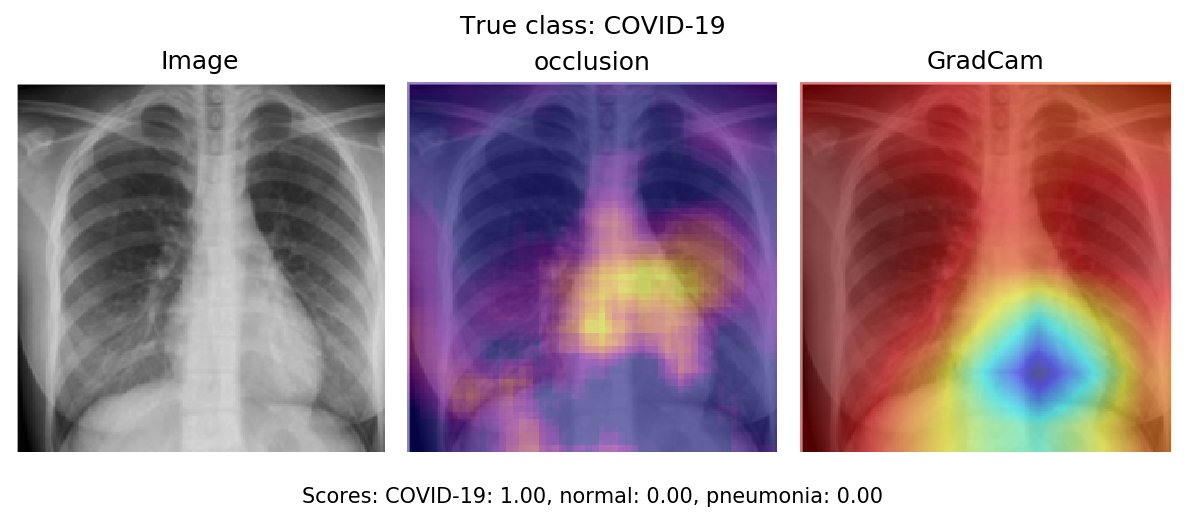
We used two methods to identify which areas of the image are critical for the classifier's decision:
- GradCam,
- Occlusion.
GradCam
GradCAM computes the gradients of the target output with respect to the last convolutional layer, averages for each output channel (dimension 2 of output), and multiplies the average gradient for each channel by the last convolutional layer activations. The results are summed over all channels and a ReLU is applied to the output, returning only non-negative attributions.
To learn more about GradCAM, visit the following resources:
Occlusion
Occlusion is a perturbation based approach to compute attribution, involving replacing each contiguous rectangular region with a given baseline / reference, and computing the difference in output. For features located in multiple regions (hyperrectangles), the corresponding output differences are averaged to compute the attribution for that feature.
To learn more about Occlusion, visit the following resource:
Captum
We used the package captum to compute and visualize the attributions. This package propose implementation of several methods to interpret model predictions, including GradCam and Occlusion.
On these images, the critical parts used by the model to predict a normal class are located in the lungs. Moreover the whole lungs are important.
On this image, the critical parts for the model to predict a pneumonia class are located in the lung inflammation.
The critical parts used by the model to predict a COVID-19 output on this image are located in the lung inflammation.
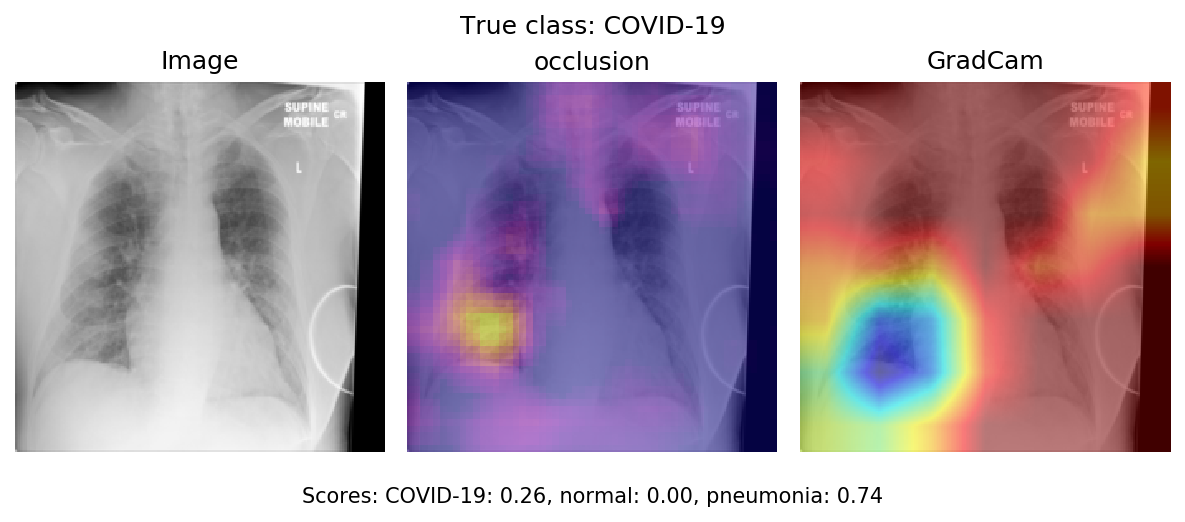
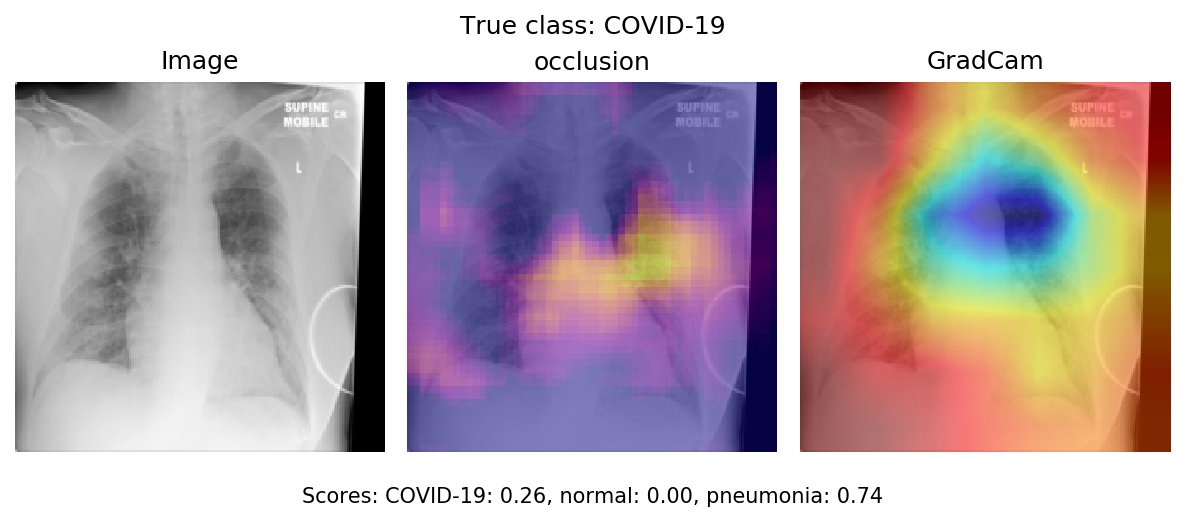
Interpretation methods also allow to understand which parts of an image misled the model into returning an erroneous prediction. The following images show attributions for the pneumonia output and covid-19 output.
On the image above, we see can see that the model predicts pneumonia because of a part located in right lung.
Whereas, on the image above, we see can see that the model predicts Covid19 because of a part located in left lung.
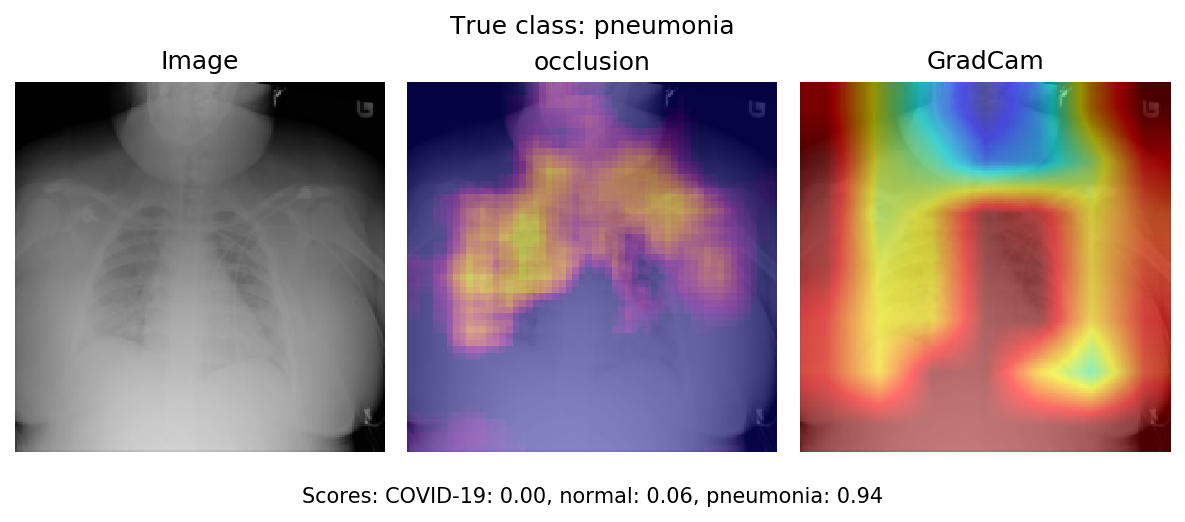
Moreover, we can see some predictions with attribution located in spurious critical areas.
On the following image the critical area is outside of the lung.
Further analyses of these erroneous predictions would allow to identify potential areas of improvement for the model.
[He 2016] He, Kaiming, et al. "Deep residual learning for image recognition." Proceedings of the IEEE conference on computer vision and pattern recognition. 2016. (available here)
[Huang 2017] Huang, Gao, et al. "Densely connected convolutional networks." Proceedings of the IEEE conference on computer vision and pattern recognition. 2017. (available here)
[Wang 2017] Wang, Xiaosong, et al. "Chestx-ray8: Hospital-scale chest x-ray database and benchmarks on weakly-supervised classification and localization of common thorax diseases." Proceedings of the IEEE conference on computer vision and pattern recognition. 2017. (available here)
[Rajpurkar 2017] Rajpurkar, Pranav, et al. "Chexnet: Radiologist-level pneumonia detection on chest x-rays with deep learning." arXiv preprint arXiv:1711.05225 (2017). (available here)
[Cohen 2019] Joseph Paul Cohen, Paul Bertin, and Vincent Frappier. Chester: A Web Delivered Locally Computed Chest X-Ray Disease Prediction System. arXiv:1901.11210, 2019. (available here)
[Cohen 2020] Cohen, Joseph Paul, et al. "On the limits of cross-domain generalization in automated X-ray prediction." arXiv preprint arXiv:2002.02497 (2020). (available here)
[Wang 2020] Wang, Linda, and Alexander Wong. "COVID-Net: A tailored deep convolutional neural network design for detection of COVID-19 cases from chest radiography images." arXiv preprint arXiv:2003.09871 (2020). (available here)
[Ozturk 2020] Ozturk, Tulin, et al. "Automated detection of COVID-19 cases using deep neural networks with X-ray images." Computers in Biology and Medicine (2020): 103792. (available here)
