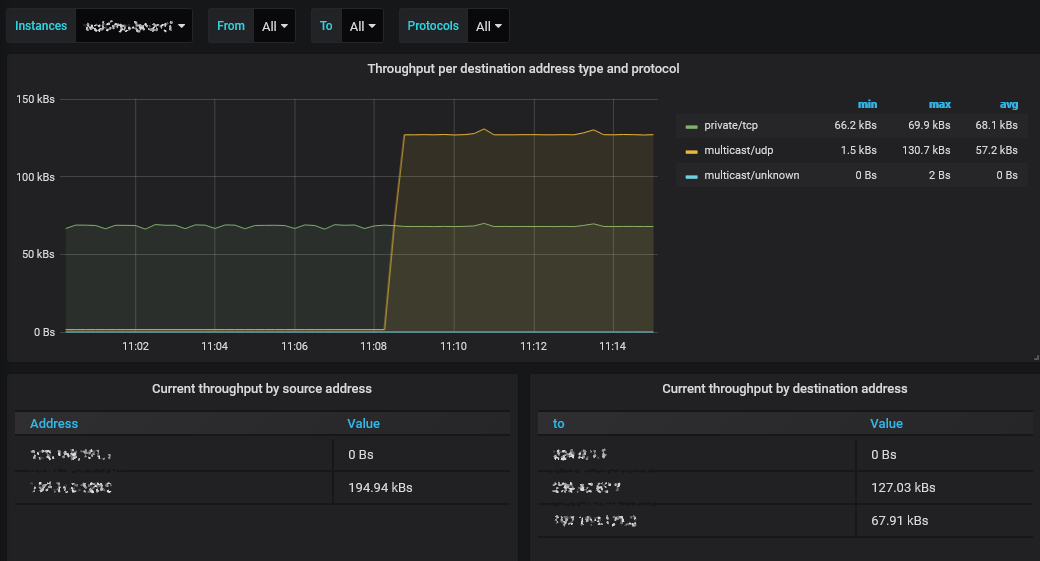
This app exports metrics about packet stream received over TZSP. The goal is to measure what types of data flows are visible on the IPv4 level, without going too far into the packet details.
System requirements:
- .NET Core 3.1
- TShark (the command-line variant of Wireshark)
- On Ubuntu, the
tsharkpackage is sufficient. - On Windows, install the full version of Wireshark.
- On Ubuntu, the
- 2 GB of free space in the temporary files directory at runtime.
The tshark command must be available in a new terminal. You may need to register the installation directory in the PATH environment variable.
This app only performs the analysis of the packet stream, not the initial capture. You need to configure a router to capture the packet stream and provide it in TZSP format to this app.
MikroTik RouterOS has built-in support for TZSP packet capture. You can also define a MikroTik firewall mangle rule with the sniff-tzsp action, for detailed filtering of captured traffic.
- Set up a TZSP packet stream to the server this app will be running on. Pick an arbitrary port number for the stream, for example 1234.
- Execute the app as
tzsp_packetstream_exporter --interface eth0 --listen-port 1234(see--helpfor more info). - Navigate to http://hostname:9184/metrics to explore the available metrics.
- Register
hostname:9184in your Prometheus configuration as a scrape target. - If using Grafana, install the template dashboard.
Example Prometheus scrape configuration:
  - job_name: 'my_packet_analysis'
    static_configs:
      - targets:
- hostname:9184Only IPv4 packets are analyzed - IPv6 is ignored.
You can direct multiple TZSP streams to the same analyzer, either on the same port or separate ports (using multiple --listen-port options). The output metrics carry a label indicating the listen port the data arrived on.
tshark: Couldn't run /usr/bin/dumpcap in child process: Permission denied
The user runnig the app must have the required permissions to use TShark. On Linux, you may need to add the user to the wireshark group, depending on system configuration.
The app may throw an access denied exception on Windows if your user does not have the right to publish results on the specified port. You can use the netsh command to grant yourself the required permissions:
netsh http add urlacl url=http://+:9184/metrics user=DOMAIN\user
The port number you need to specify here is the publishing port, 9184 by default.
Implementations of the TZSP protocol can truncate packets under some conditions, which might result in the operating system filtering them out and never handing them over to the listening app. Using TShark ensures that we can process even truncated packets.
