By Agam Kashyap : IMT2018004
The following assignment has been done in MATLAB.
The sampling frequency of the signal is 44100 Hz as can be seen by
disp(Fs);
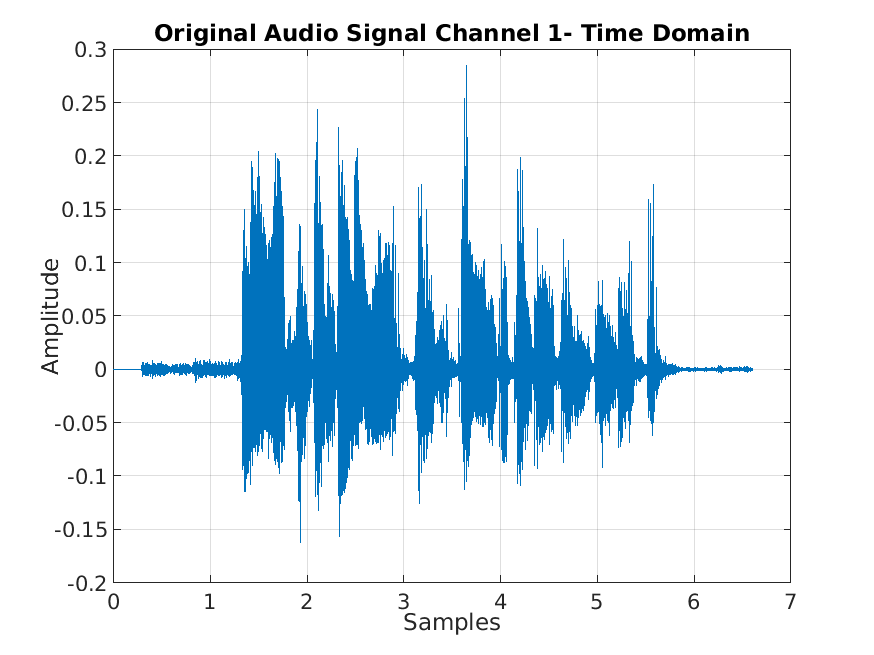
Look at the time domain plot of this audio signal
If you were to zoom in, you will notice that it is a discrete and an aperiodic signal. This means that the best Fourier representation to analyse it would be DTFT(Discrete Time Fourier Transform). Since this transformation requires an infinte domain which is not feasible, I used DFT.
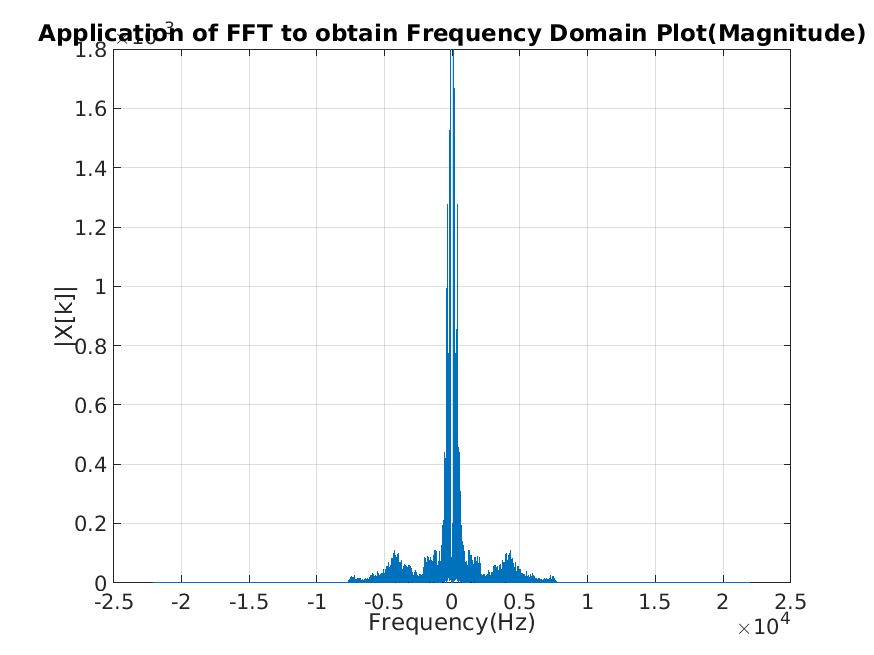
Here is the Frequency domain plot of the audio signal obtained by performing Fast Fourier Transform
Now, to apply a filter to the signal I have used an in-built method known as butter().
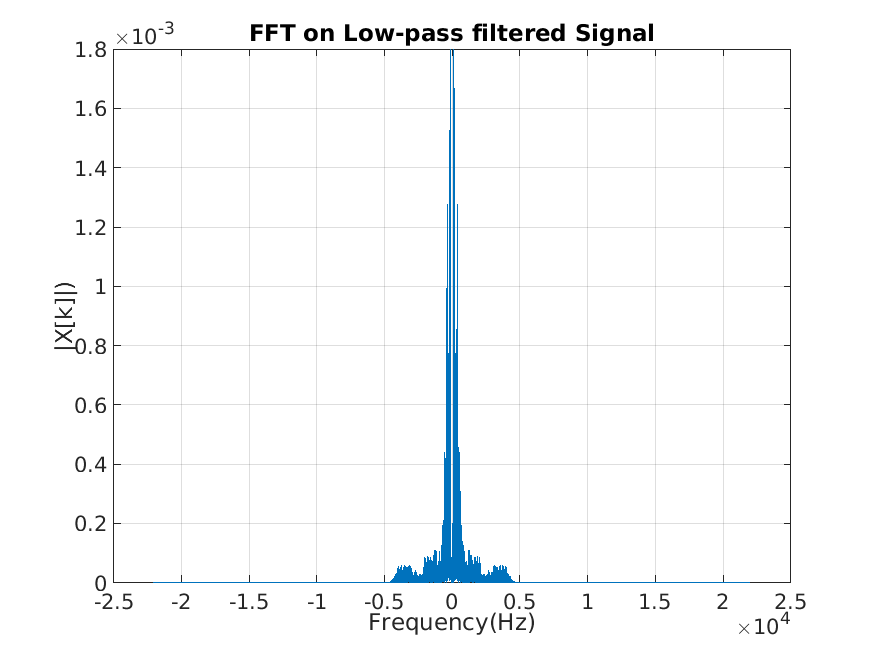
Applying a low pass filter ceiled at 4kHz to signal
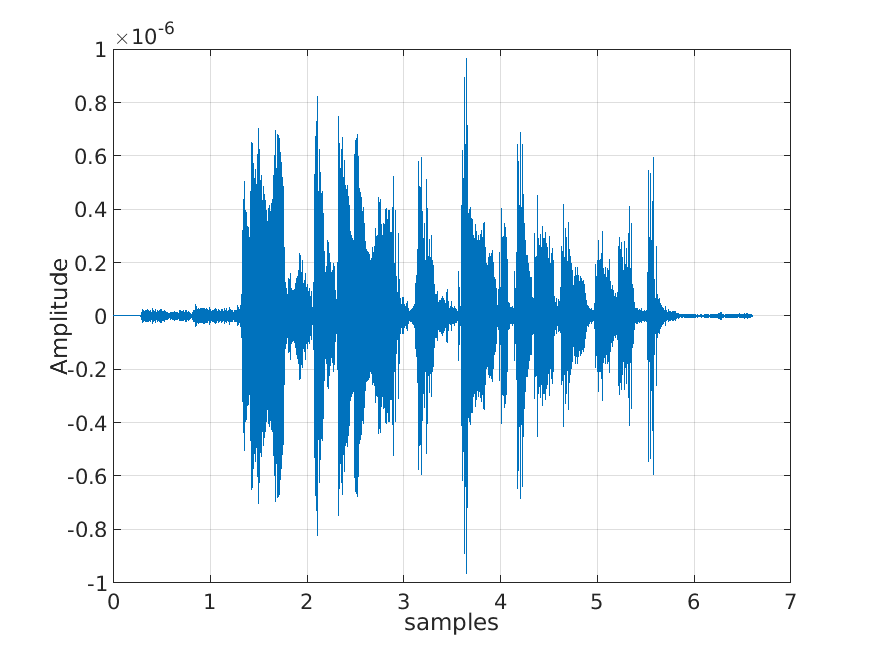
The inverse fourier transform plot for this signal is obtained as:
The audio file corresponding to this is X_LOW.wav
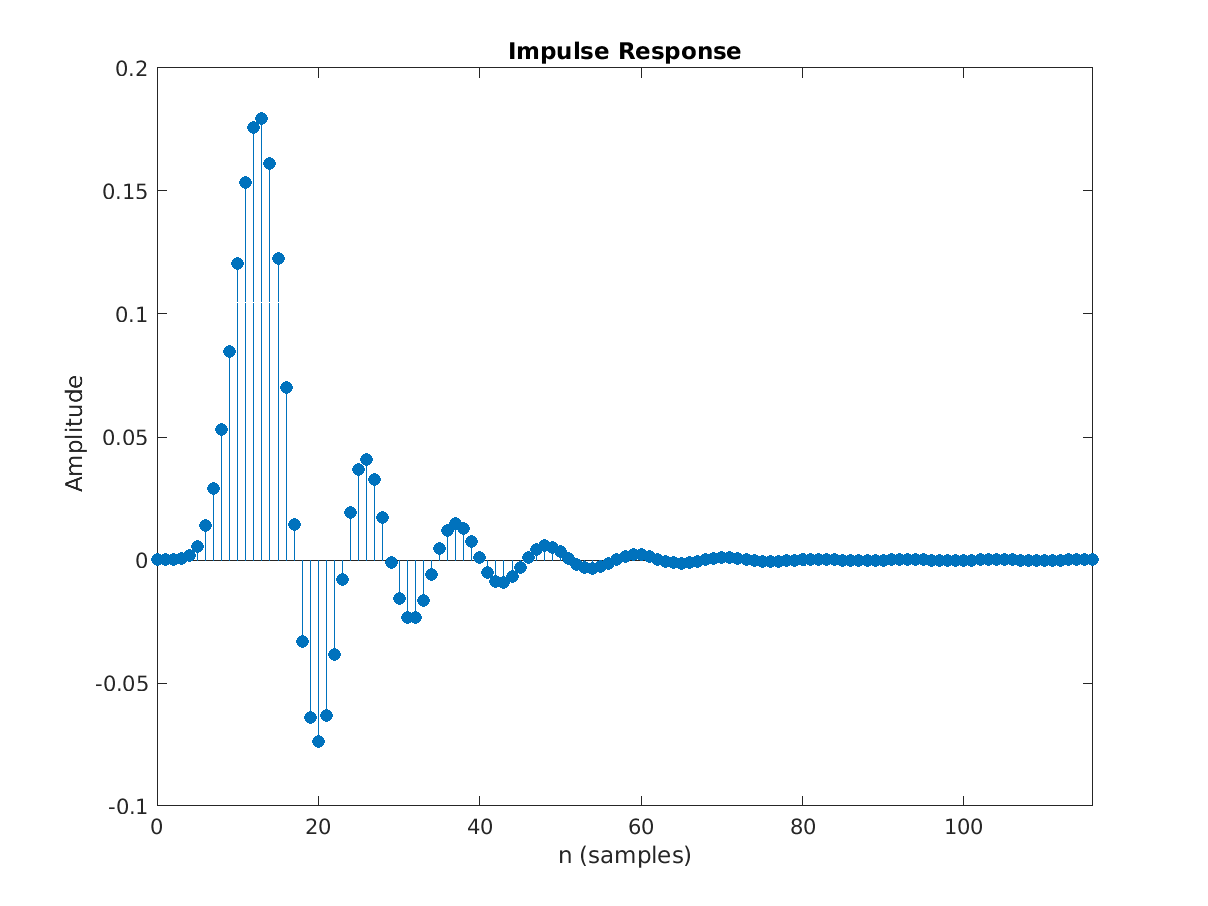
To find the impulse response of the signal, I have utilised the impz() function of MATLAB. As we can see, the impulse response of the almost ideal filter is a sinc function.
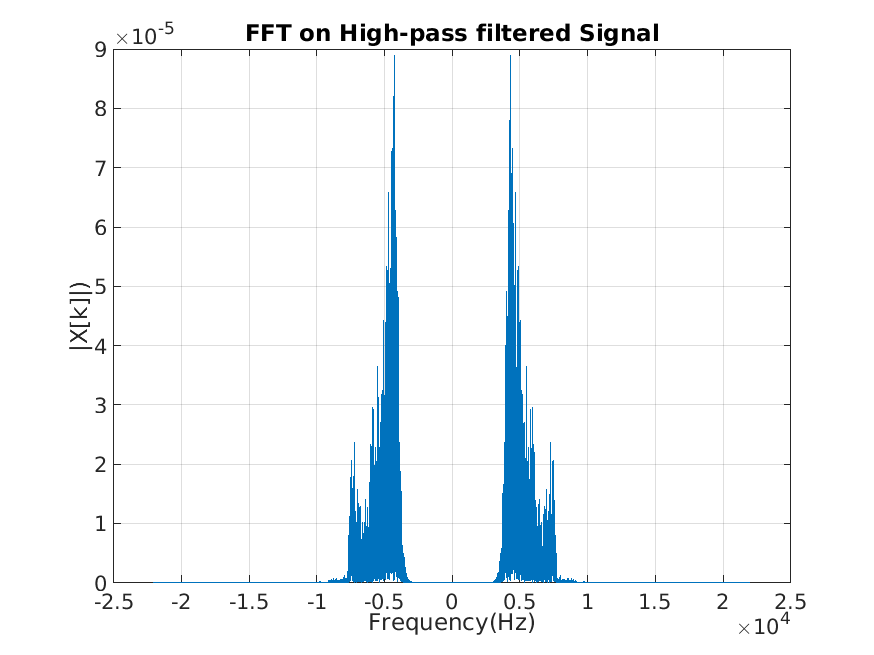
Now, similarly for the highpass filter. Applying a high pass filter of 4kHz to signal
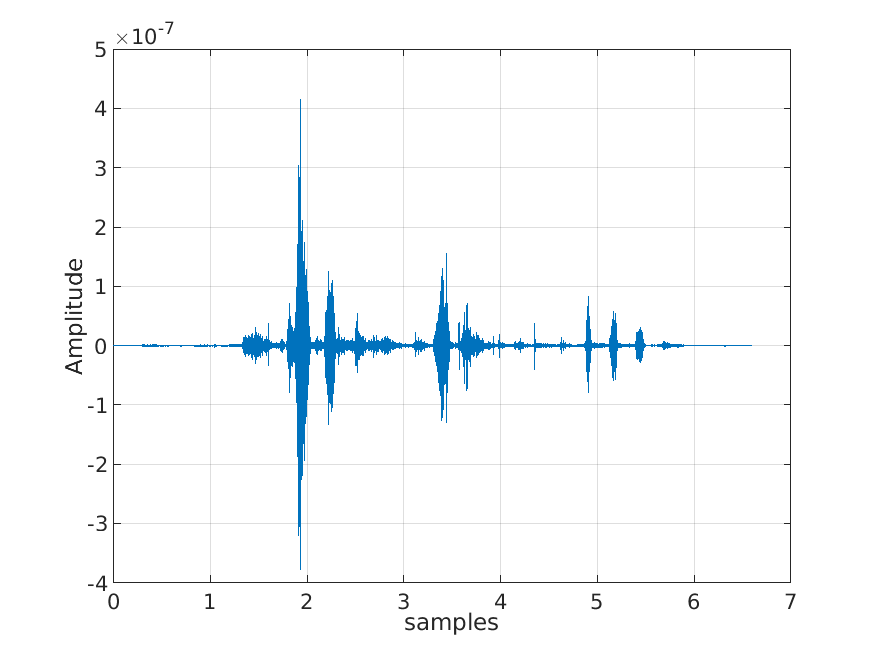
The inverse Fourier Transform is:
The audio file corresponding to this is X_Hi.wav
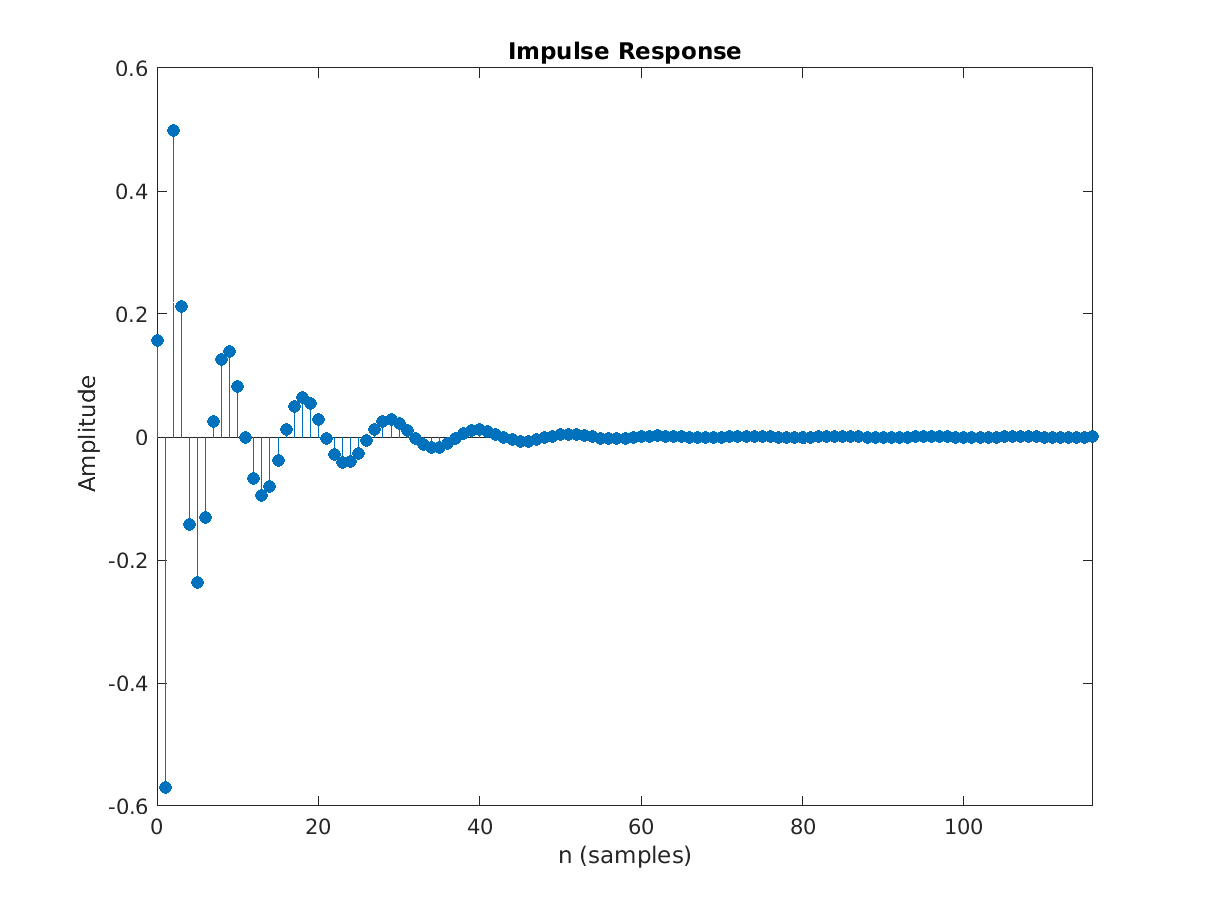
The impulse response for the same is
References
- Youssef Khmou (2020). PSD (Power Spectral Density), and Amplitude Spectrum with adjusted FFT, MATLAB Central File Exchange. Retrieved May 11, 2020.
