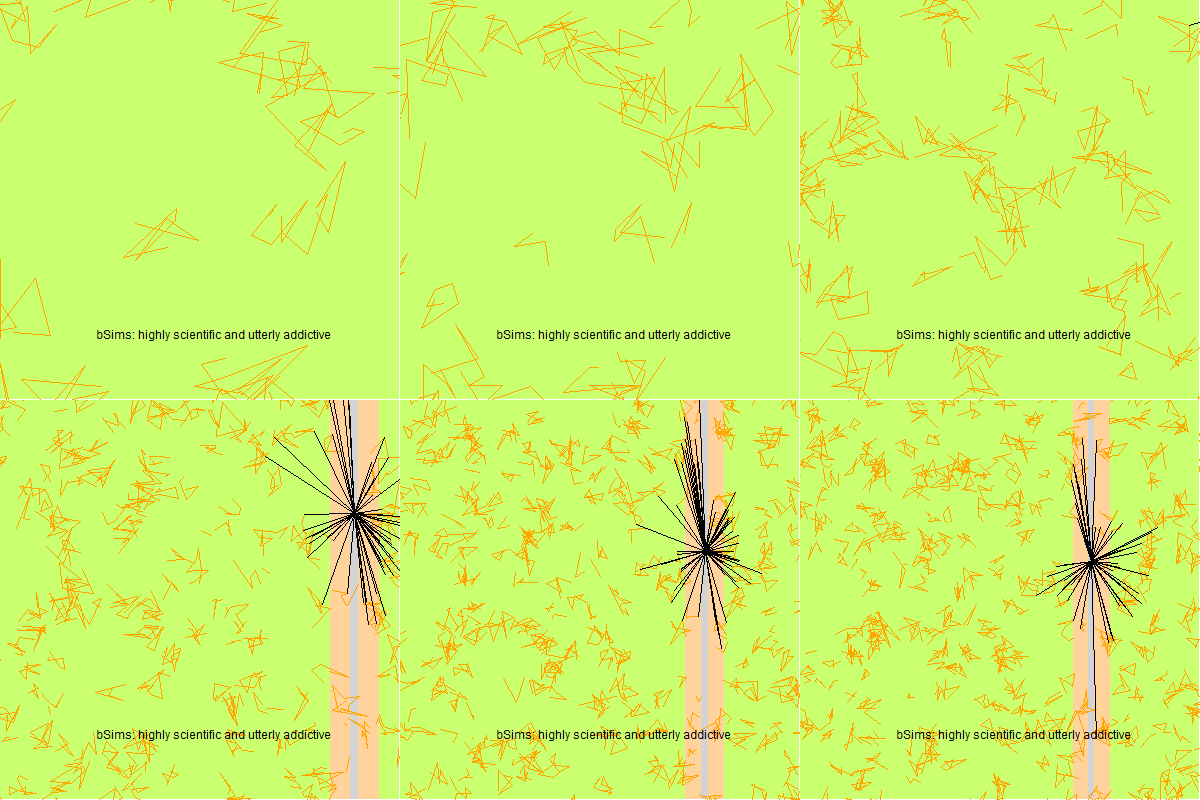
A highly scientific and utterly addictive bird point count simulator to test statistical assumptions and to aid survey design.
“I’ve yet to see any problem, however complicated, which when you looked at it the right way didn’t become still more complicated.” – Poul Anderson, Call Me Joe
“Love the simulation we’re dreaming in” - Dua Lipa, Physical
The goal of the package is to:
- test statistical assumptions,
- aid survey design,
- and have fun while doing it!
Design objectives:
- small (point count) scale implementation,
- habitat is considered homogeneous except for edge effects,
- realistic but efficient implementation of biological mechanisms and observation process,
- defaults chosen to reflect common practice and assumptions,
- extensible (PRs are welcome).
See the package in action in the QPAD Book.
Check out the QPAD workshop.
Read/cite the paper Agent-based simulations improve abundance estimation (DOI 10.1007/s42977-023-00183-2).
CRAN version:
install.packages("bSims")Development version:
remotes::install_github("psolymos/bSims")See what is new in the NEWS file.
Please cite (see citation("bSims")) the paper:
Solymos, P. 2023. Agent-based simulations improve abundance estimation. Biologia Futura 74, 377–392 DOI 10.1007/s42977-023-00183-2, link to PDF.
Feedback and contributions are welcome:
library(bSims)

phi <- 0.5
tau <- 1:3
dur <- 10
rbr <- c(0.5, 1, 1.5, Inf)
tbr <- c(3, 5, 10)

l <- bsims_init(10, 0.5, 1)
p <- bsims_populate(l, 1)
a <- bsims_animate(p, vocal_rate=phi, duration=dur)
o <- bsims_detect(a, tau=tau)

x <- bsims_transcribe(o, tint=tbr, rint=rbr)

get_table(x)
#>          0-3min 3-5min 5-10min
#> 0-50m         2      0       0
#> 50-100m       3      0       1
#> 100-150m      4      1       0
#> 150+m 8 3 0head(get_events(a))
#> x y t v a i
#> 1 4.6025783 -3.3454607 0.02565467 1 302 99
#> 2 -0.7210853 -1.4680273 0.03151759 1 190 43
#> 3 -2.7191418 1.6200508 0.03152603 1 78 7
#> 4 -2.1041934 -1.6092706 0.03936096 1 295 19
#> 5 -4.9531338 -0.4093427 0.04890537 1 217 11
#> 6 -3.3127196 -0.2145475 0.08899310 1 215 15head(get_detections(o))
#> x y t v a d f i j
#> 2 -0.7210853 -1.46802728 0.03151759 1 190 1.6355636 NA 43 43
#> 8 -0.7210853 -1.46802728 0.11174961 1 323 1.6355636 NA 43 43
#> 13 0.5770644 -0.47429169 0.17337408 1 152 0.7469645 NA 62 62
#> 17 -1.3566956 -0.44725546 0.20776472 1 213 1.4285169 NA 38 38
#> 25 0.5355406 -3.24873232 0.42514210 1 330 3.2925773 NA 63 63
#> 29 0.9538955 0.07641822 0.48471447 1 160 0.9569516 NA 56 56A few Shiny apps come with the package. These can be used to interactively explore the effects of different settings.
Compare distance functions:
run_app("distfunH")
run_app("distfunHER")
Compare simulation settings for single landscape:
run_app("bsimsH")
run_app("bsimsHER")Interactive sessions can be used to explore different settings. Settings
can be copied from the Shiny apps and replicated using the bsims_all
function:
b <- bsims_all(extent=5, road=1, density=c(1,1,0))
b
#> bSims wrapper object with settings:
#>   extent : 5
#>   road   : 1
#>   density: 1, 1, 0
The object has handy methods:
b$settings()      # retrieve settings
b$new()           # replicate once
b$replicate(10)   # replicate 10x
The $replicate() function also runs on multiple cores:
library(parallel)
b <- bsims_all(density=0.5)
B <- 4  # number of runs
nc <- 2 # number of cores

## sequential
system.time(bb <- b$replicate(B, cl=NULL))
#>    user  system elapsed
#> 0.232 0.001 0.233## parallel clusters
cl <- makeCluster(nc)
## note: loading the package is optional
system.time(clusterEvalQ(cl, library(bSims)))
#> user system elapsed
#> 0.000 0.000 0.439system.time(bb <- b$replicate(B, cl=cl))
#> user system elapsed
#> 0.004 0.001 0.194stopCluster(cl)
## parallel forking
if (.Platform$OS.type != "windows") {
system.time(bb <- b$replicate(B, cl=nc))
}
#> user system elapsed
#> 0.119 0.046 0.182