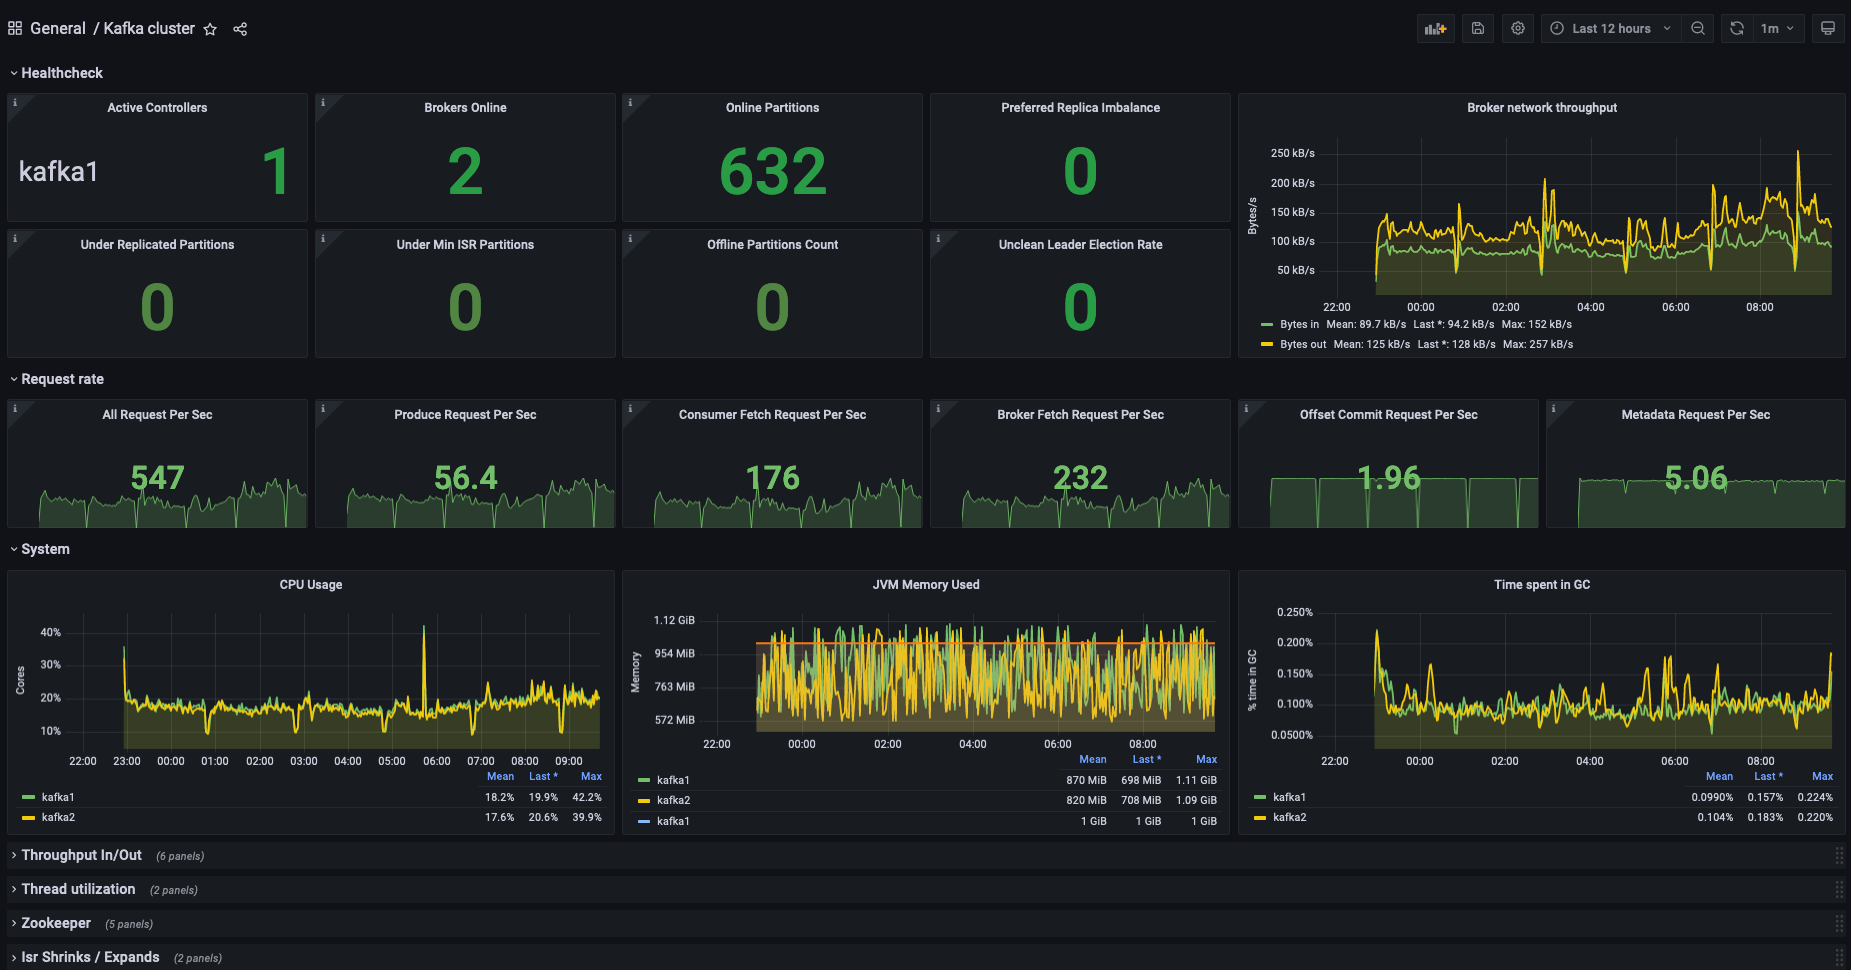
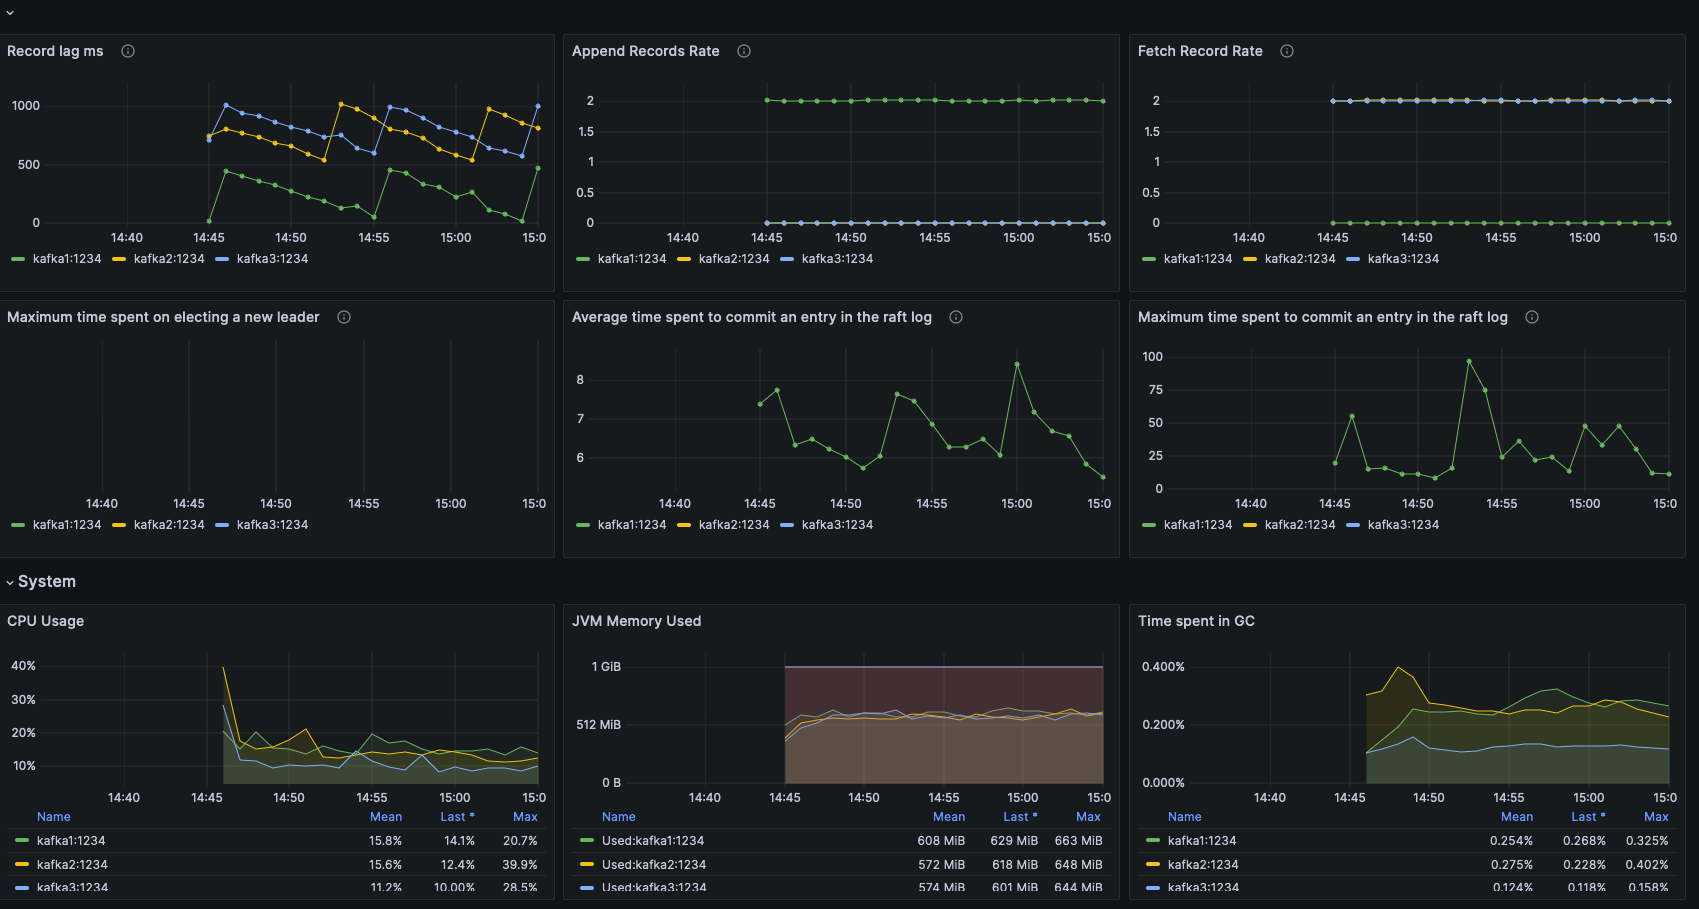
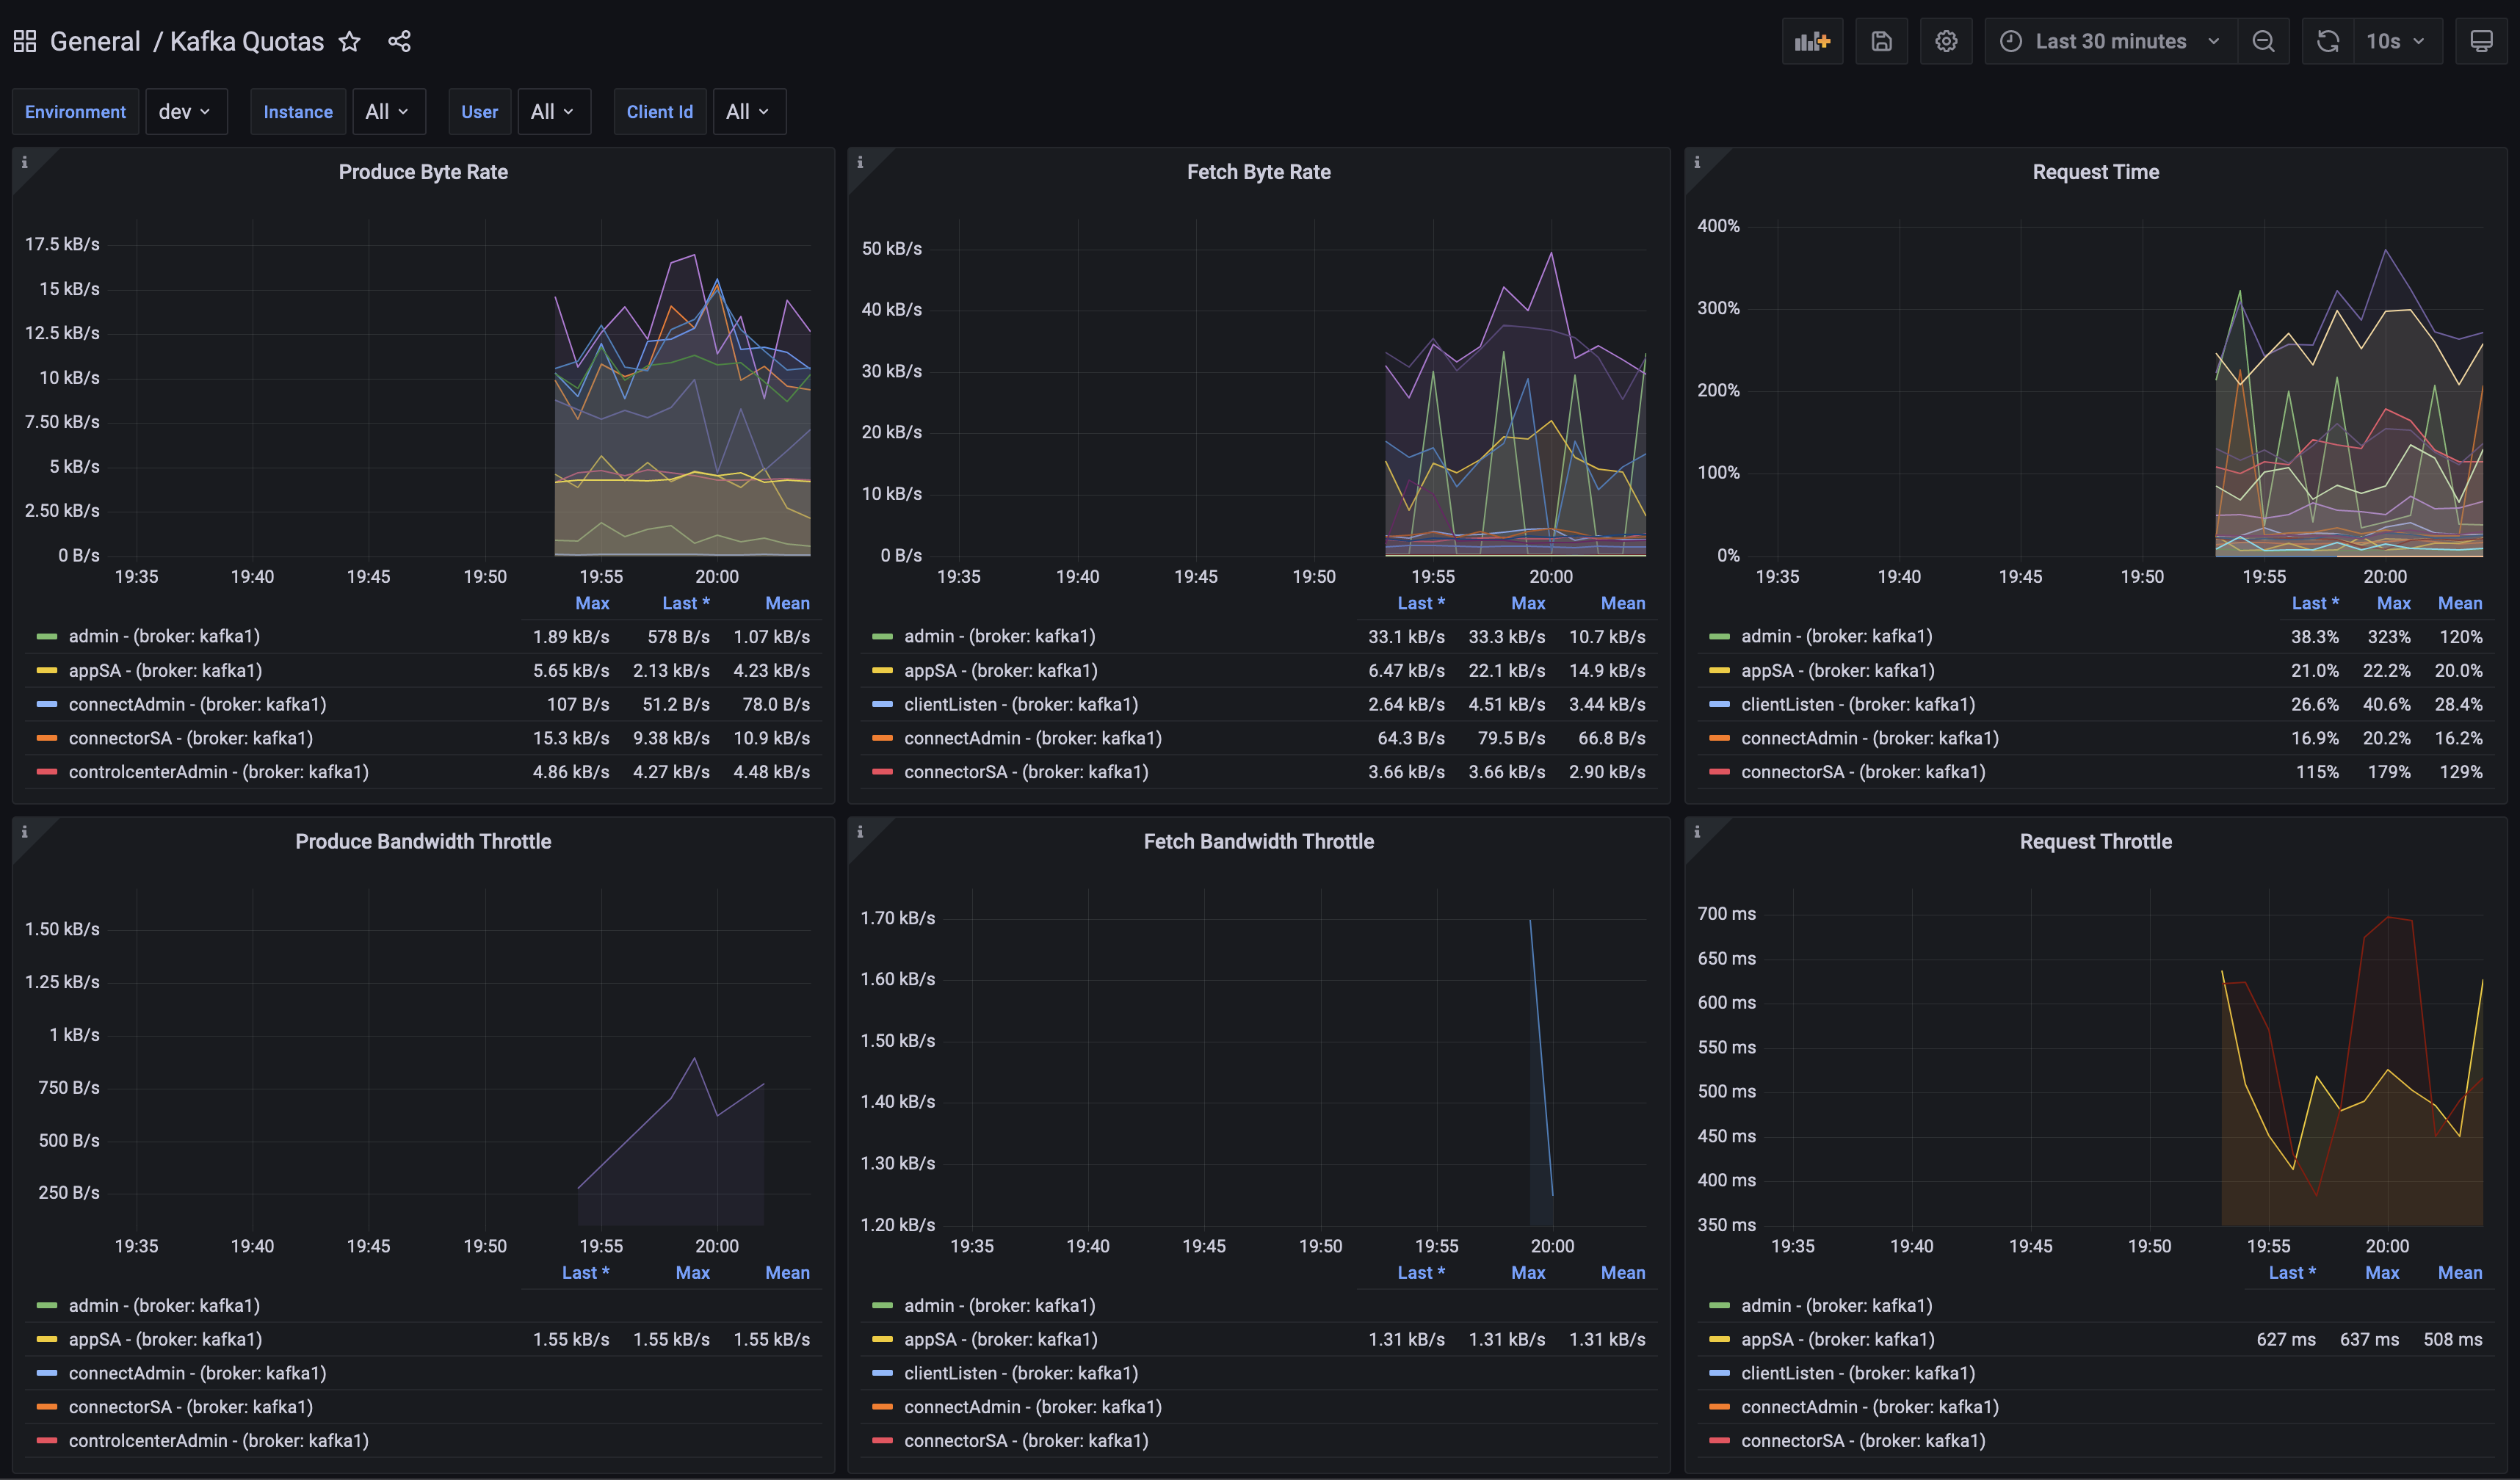
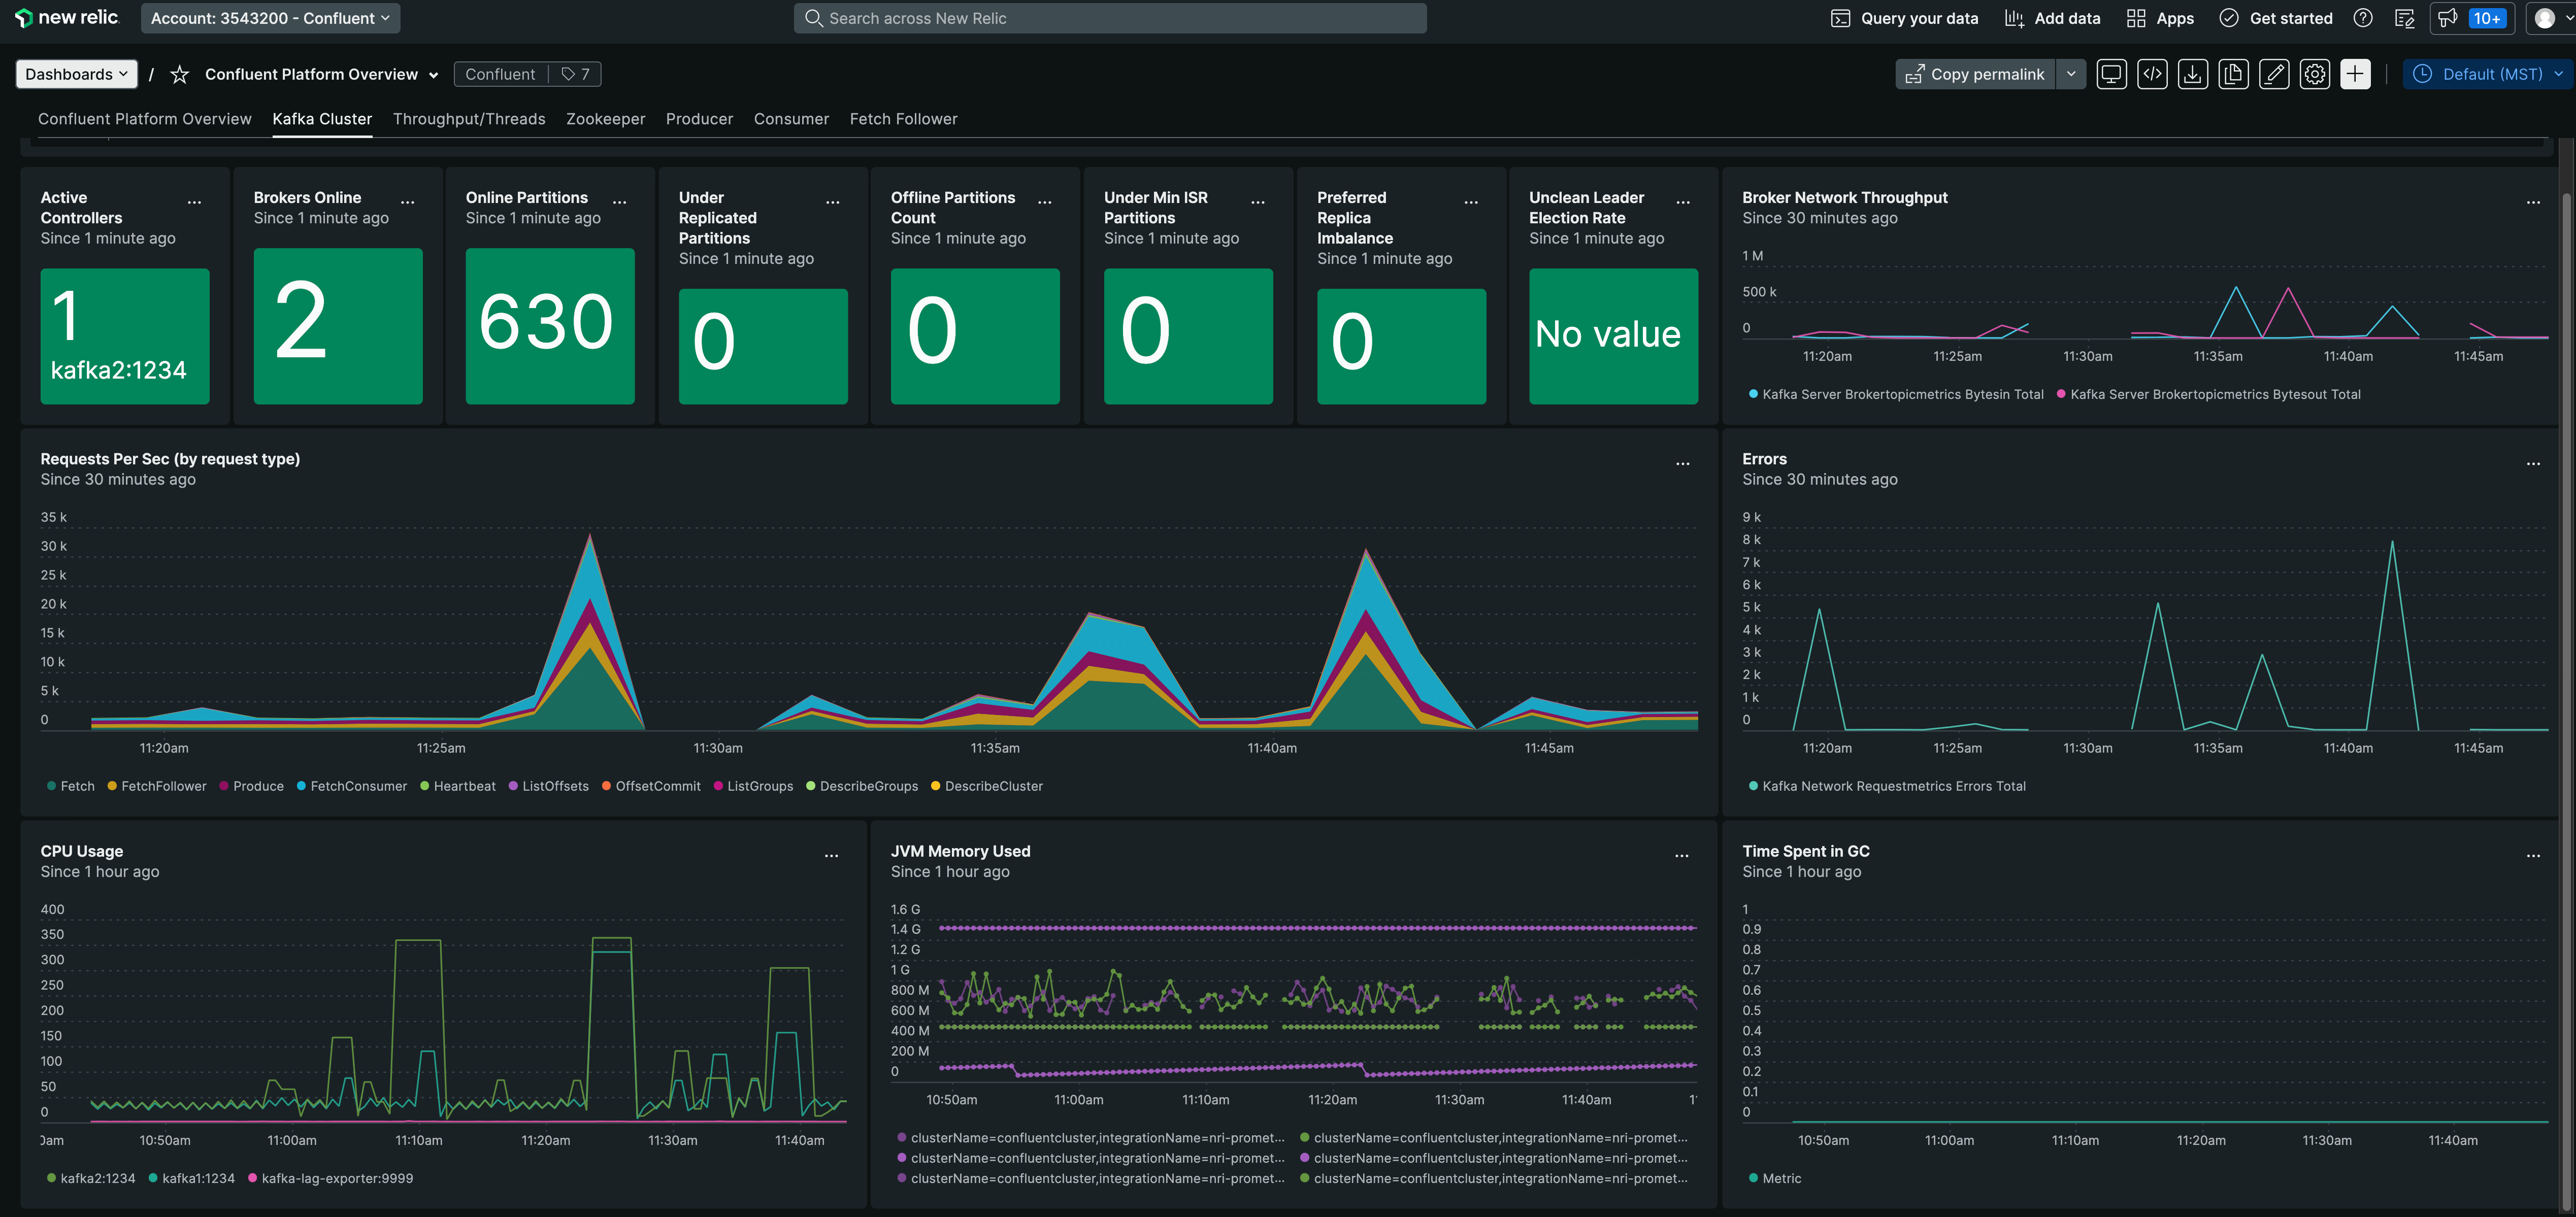
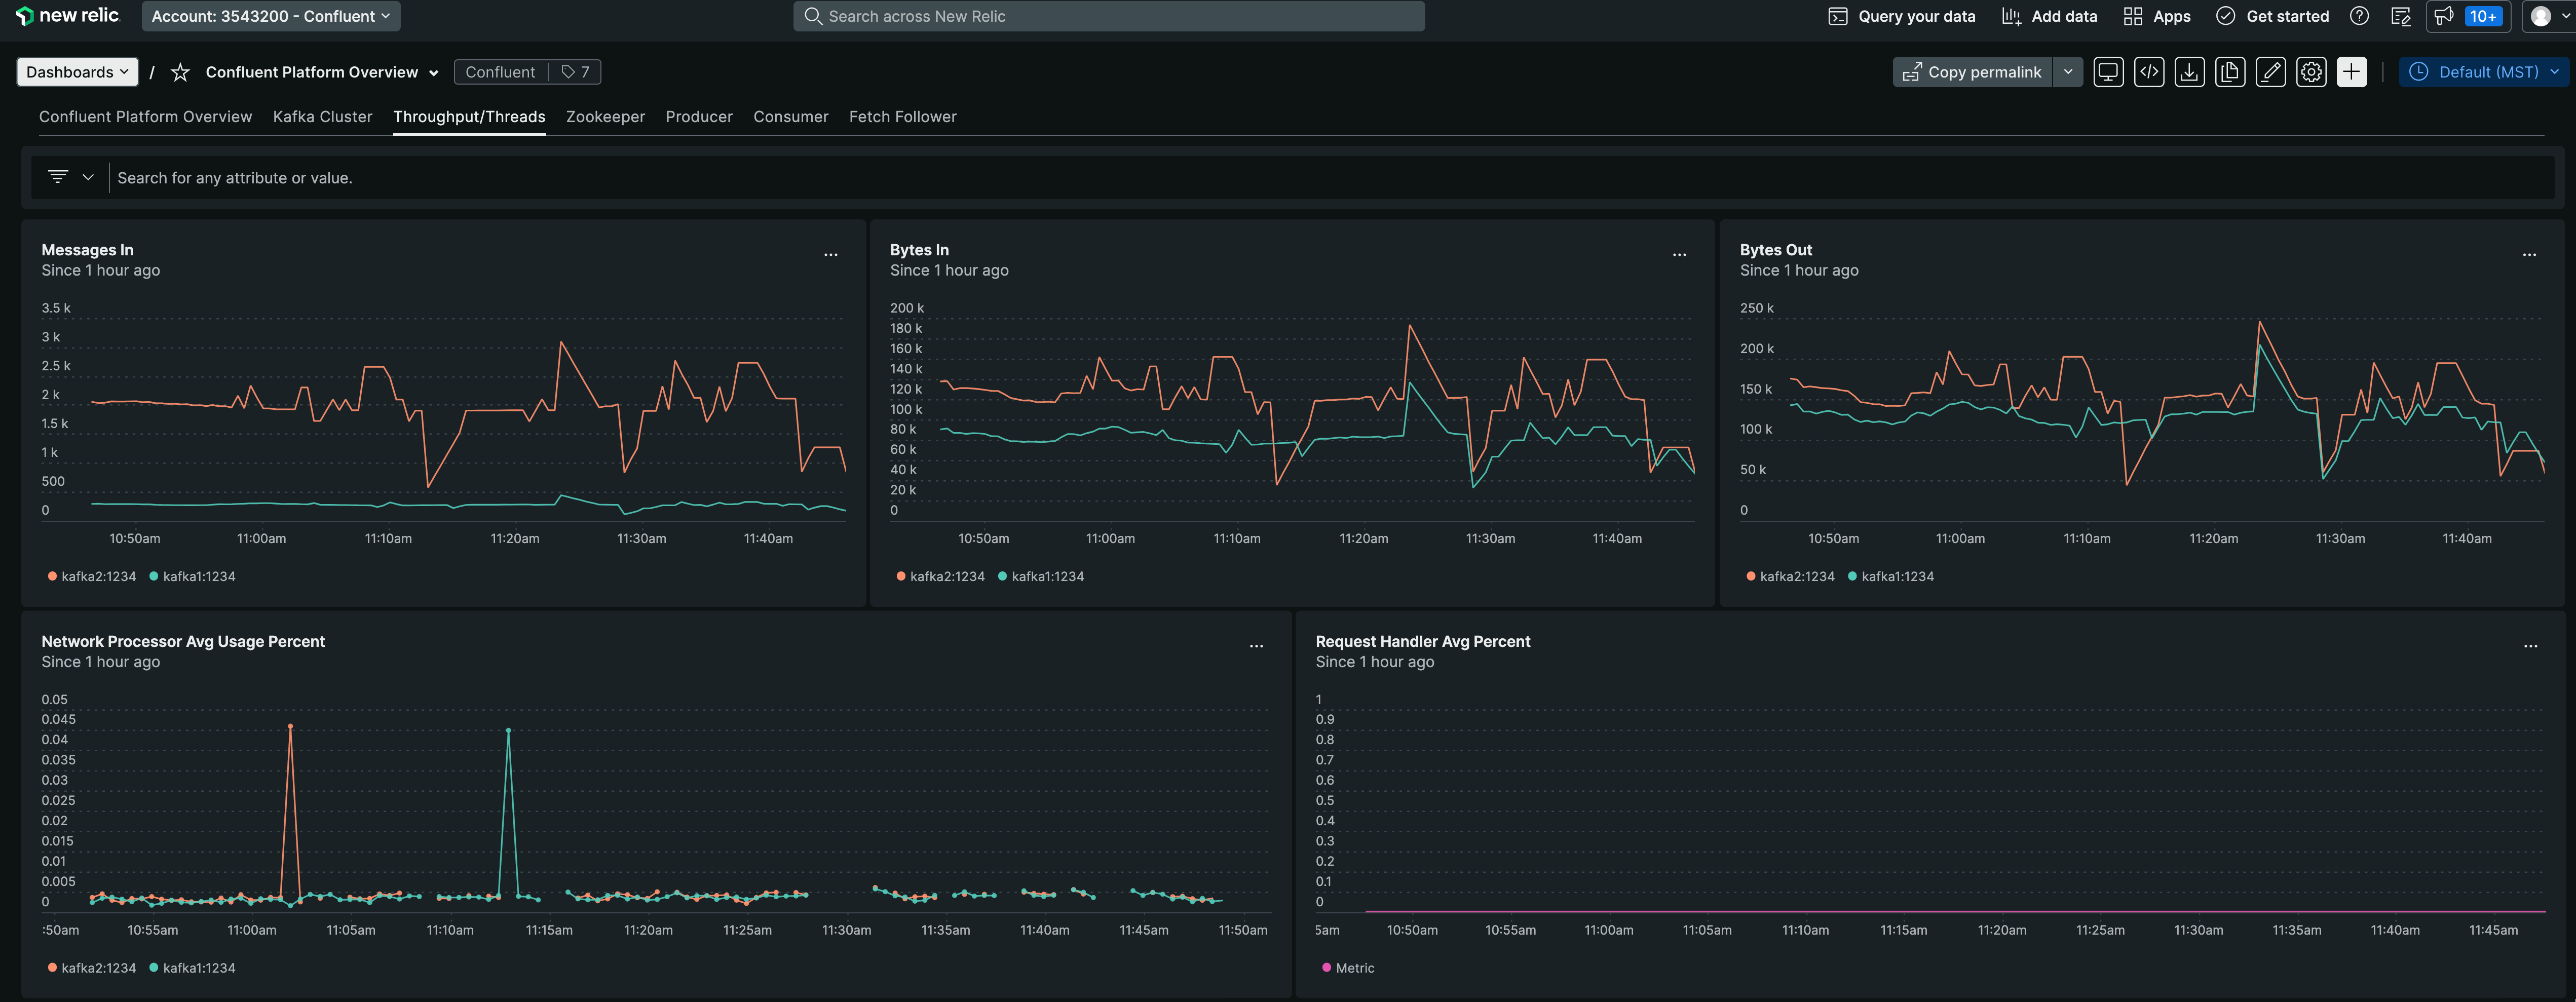
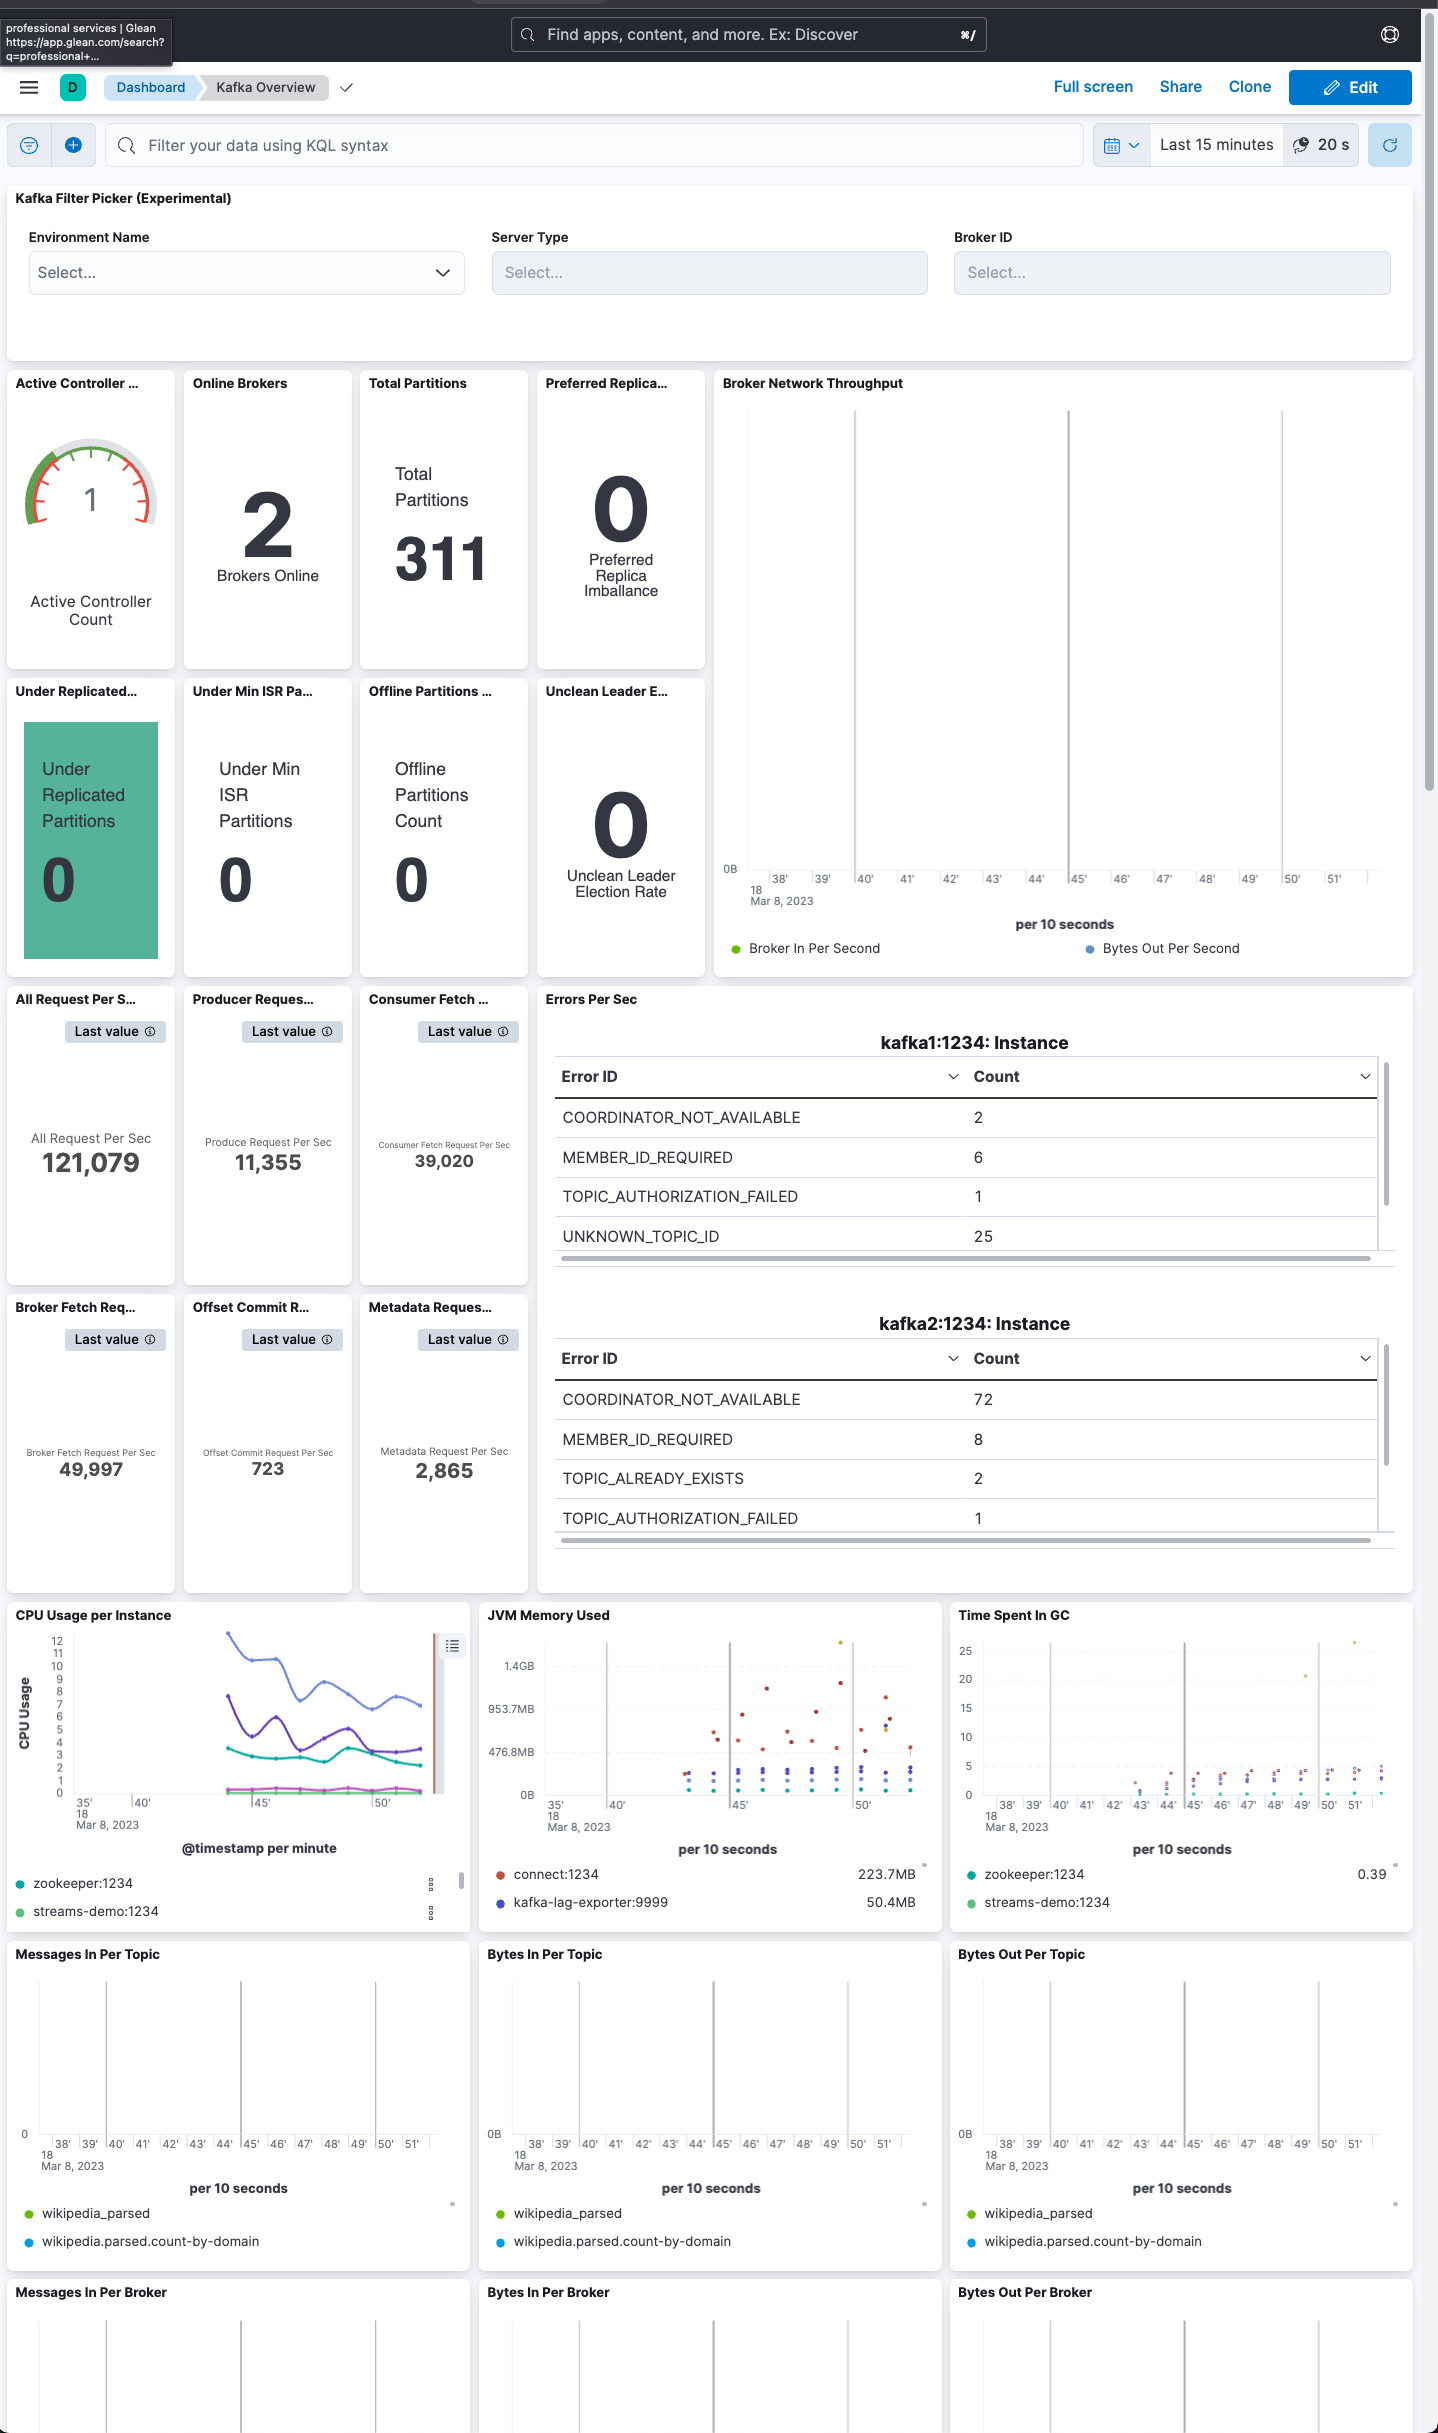
This repo demonstrates examples of JMX monitoring stacks that can monitor Confluent Cloud and Confluent Platform. While Confluent Cloud UI and Confluent Control Center provides an opinionated view of Apache Kafka monitoring, JMX monitoring stacks serve a larger purpose to our users, allowing them to setup monitoring across multiple parts of their organization, many outside of Kafka, and to have a single pane of glass.
This project provides metrics and dashboards for:
- Confluent Platform with Prometheus and Grafana
- Confluent Platform on Kubernetes with Prometheus and Grafana
- Confluent Platform with New Relic
- Confluent Platform with Metricbeat and Kibana
- Confluent Cloud with Prometheus and Grafana
- Confluent Cloud with Metricbeat and Kibana
- Confluent Cloud with Opentelemetry and New Relic
and much more...
Alerts are available for the stacks:
- jmxexporter-prometheus-grafana including alerts on broker, zookeeper and kafka connect.
The demo with Confluent Cloud needs a Confluent Cloud cluster and you (as a user) are required to gather some details before spinning up the Confluent Cloud monitoring solution. Please refer to this README for detailed steps to run a Confluent Cloud based sample dashboard.
To add JMX exporter configurations to cp-ansible, please refer to this README
To add JMX exporter configurations to your Kubernetes workspace, please refer to this README
This repo is intended to work smoothly with Confluent cp-demo.
Make sure you have enough system resources on the local host to run this. Verify in the advanced Docker preferences settings that the memory available to Docker is at least 8 GB (default is 2 GB).
NOTE: jq is required to be installed on your machine to run the demo.
NOTE: If there is interest to test Kafka Lag Exporter (included on the monitoring stacks) make sure to use JDK 8 when running the demo, as it requires JDK8-generated certificates for the container to work (seglo/kafka-lag-exporter#270).
-
Ensure that cp-demo is not already running on the local host.
-
Decide which monitoring stack to demo: either jmxexporter-prometheus-grafana, metricbeat-elastic-kibana, or jmxexporter-newrelic and set the
MONITORING_STACKvariable accordingly.
CP_DEMO_VERSION=7.5.2-post# Set one of these
MONITORING_STACK=jmxexporter-prometheus-grafana
MONITORING_STACK=metricbeat-elastic-kibana
MONITORING_STACK=jmxexporter-newrelic- Clone
cp-demoand checkout a branch (tested branches starts from 7.2.0-post).
[[ -d "cp-demo" ]] || git clone https://github.com/confluentinc/cp-demo.git
(cd cp-demo && git fetch && git checkout $CP_DEMO_VERSION && git pull)- Clone
jmx-monitoring-stacksand checkout main branch.
[[ -d "jmx-monitoring-stacks" ]] || git clone https://github.com/confluentinc/jmx-monitoring-stacks.git
(cd jmx-monitoring-stacks && git fetch && git checkout main && git pull)- Start the monitoring solution with the STACK selected. This command also starts cp-demo, you do not need to start cp-demo separately.
${MONITORING_STACK}/start.shNOTE: New Relic requires a License Key to be added in ${MONITORING_STACK}/start.sh
- Stop the monitoring solution. This command also stops cp-demo, you do not need to stop cp-demo separately.
${MONITORING_STACK}/stop.shFor an example that showcases how to monitor Apache Kafka client applications, and steps through various failure scenarios to see how they are reflected in the provided metrics, see the Observability for Apache Kafka® Clients to Confluent Cloud tutorial.
To run a lightweight dev environment:
cd dev-toolkit- Put your new dashboards into the
grafana-wipfolder start.sh-> It will create a minimal environment with a KRaft cluster, prometheus, grafana and a spring based java client- For Grafana, go to http://localhost:3000, login with admin/grafana
stop.sh
- What if I need more components?
More docker-compose envs will be released in the future, in the meantime you can use Kafka Docker Composer
- What if I need more prometheus jobs?
You can add them to the start.sh, i.e.
# ADD client monitoring to prometheus config
cat <<EOF >> assets/prometheus/prometheus-config/prometheus.yml

  - job_name: 'spring-client'
    static_configs:
      - targets: ['spring-client:9191']
        labels:
          env: "dev"
EOF
You can also change the prometheus configuration here.
