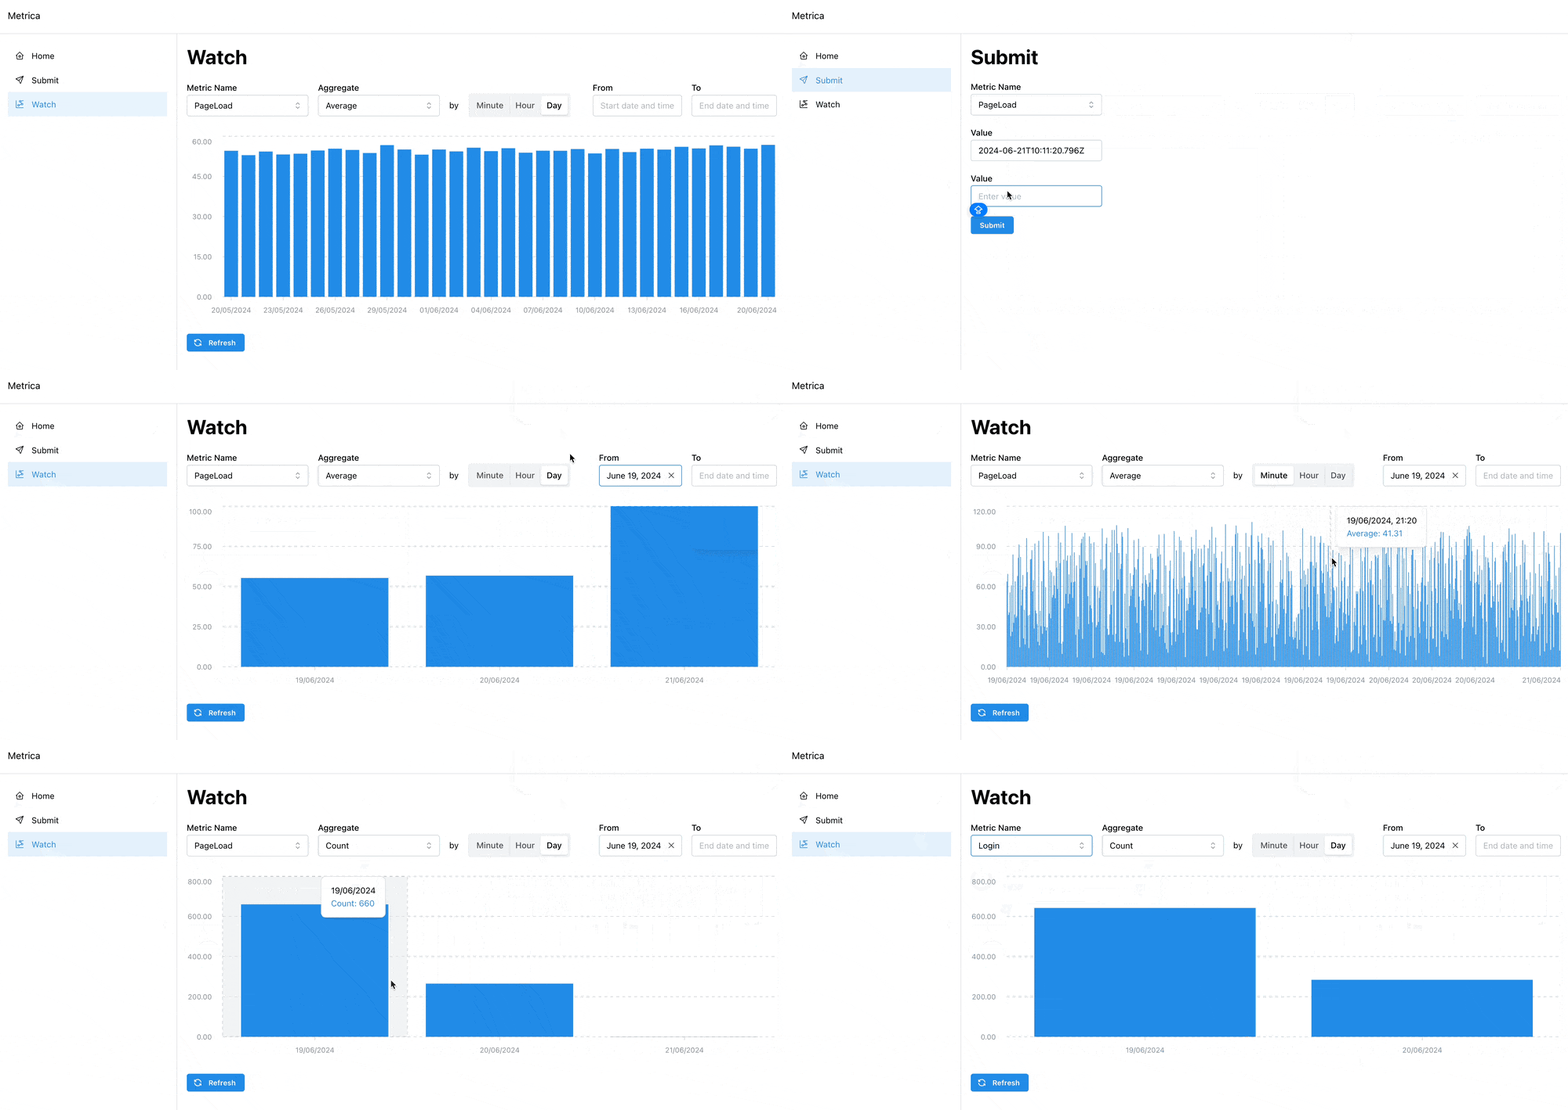
We need a Frontend + Backend application that allows you to post and visualize metrics. Each metric will have: Timestamp, name, and value. The metrics will be shown in a timeline and must show averages per minute/hour/day The metrics will be persisted in the database.
- TBD
I've built a Grafana dashboard to visualize the metrics.
The dashboard is connected to the same data source as the application.
You can find the board here: Board link.
The application is built using JS/TS stack with Next.js and deployed to Vercel.
Live preview: https://assignment-metrica.vercel.app/
Let's you submit metrics to the application.
Let's you visualise metrics submitted to the application.
See GET /api/metric
See POST /api/metric
- The Backend
- TypeScript & Next.js.
- API endpoints are deployed as Serverless Vercel Functions (aka AWS lambdas).
- Prisma ORM is used for DB operations.
- The Frontend
- Hosting and Deployemnt Infrastructure: Vercel.
- Database: PostgreSQL (Vercel).
- Database is seeded with 10 000 random metrics. See
./prisma/seed.tsfor details. - No complex infra such as WAF, Load Balancer etc.
- No Auth.
- No Tests.
- No Local dev infra such as Docker for local dev DB etc.
- Caching on the Frontend.
- Various visulisation improvements such as showing more than one metric on the same graph etc.
- Add pagination to the API "Watch" page
- Realtime data update.
- Come up with solution to store metric names. E.g. Separate DB\ Table. With indicies for faster lookups etc.
- Consider NoSQL db. E.g. MongoDB for large scale data storage and high write throughput.
- Add middleware to validate payload data types
- Autogenerate api docs with Swagger and OpenAPI
- Consider empty states
- Code clean up such as
- Move types to external file
- Move some handlers and utils to separate files etc
- Consider points from Tradeoffs section
Following tradeoffs have been made:
- No Tests
- No Auth
- No Pagination
- No Error handling
- No Logging & Monitoring
- No Rate limiting
Requirements: Node.js 18.17 or later
- Clone the repository
git clone git@github.com:pvshum/assignment-metrica.git cd assignment-metrica- Either use provided
.envfile or rename.env.exampleto.envand add your own values.
- Either use provided
- Run
npm install - Now we need to seed the DB.
- Run
npx prisma migrate deployto apply latest migrations. - If you use provided
.envfile you can skip db seeding and proceed to step 3 - If you use own DB, you can seed it with data using
npx prisma db seed- This will create 10k metrics.
- Run
- Run
npm run dev - Open http://localhost:3000 with your browser to see the application.
- To inspect the DB you can use Prisma Studio. Run
npx prisma studio
Returns aggregated metrics for a specified metric name. The aggregation can be based on average, maximum, or count of the metric values over specified intervals.
| Field | Type | Required | Description |
|---|---|---|---|
name |
string |
Yes | The name of the metric to retrieve. Current supported names: PageLoad, APIRequest, Login, Signup, Search. |
aggregate |
string |
No | The type of aggregation (avg, max, count). Default is avg. |
interval |
string |
No | The interval for aggregation (minute, hour, day). Default is day. |
timeFrom |
string |
No | The start time for the metrics retrieval in format parseable by new Date(). No Default. |
timeTo |
string |
No | The end time for the metrics retrieval in format parseable by new Date(). No Default. |
Query string:
/api/metric?name=PageLoad&aggregate=avg&interval=hour&timeFrom=2024-06-01T00:00:00Z&timeTo=2024-06-20T00:00:00Z
Query params:
{
  "name": "PageLoad",
  "aggregate": "avg",
  "interval": "hour",
  "timeFrom": "2024-06-01T00:00:00Z",
  "timeTo": "2024-06-20T00:00:00Z"
}{
"name": "PageLoad",
"aggregate": "avg",
"interval": "hour",
"metrics": [
{
"time": "2024-06-01T00:00:00Z",
"avg": 22.5
},
{
"time": "2024-06-01T01:00:00Z",
"avg": 23.0
}
]
}| Status Code | Message | Description |
|---|---|---|
| 400 | RESPONSE_MESSAGES.EMPTY_METRIC_NAME |
The metric name is missing. |
| 405 | RESPONSE_MESSAGES.METHOD_NOT_ALLOWED |
The request method is not allowed (only GET is allowed). |
{
  "error": "RESPONSE_MESSAGES.EMPTY_METRIC_NAME"
}
{
"error": "RESPONSE_MESSAGES.METHOD_NOT_ALLOWED"
}
Creates a new metric entry.
| Field | Type | Required | Description |
|---|---|---|---|
name |
string |
Yes | The name of the metric. |
value |
number |
Yes | The value of the metric. |
timestamp |
string |
No | The timestamp of the metric in format parseable by new Date(). |
{
  "name": "PageLoad",
  "value": 23.5,
  "timestamp": "2024-06-20T14:30:00Z"
}{
"id": "clxncpdto000213h0kz22kt50",
"name": "PageLoad",
"value": 23.5,
"timestamp": "2024-06-20T14:30:00Z"
}| Status Code | Message | Description |
|---|---|---|
| 400 | RESPONSE_MESSAGES.EMPTY_METRIC_NAME |
The metric name is missing. |
| 400 | RESPONSE_MESSAGES.EMPTY_METRIC_VALUE |
The metric value is missing. |
| 405 | RESPONSE_MESSAGES.METHOD_NOT_ALLOWED |
The request method is not allowed (only POST is allowed). |
{
  "error": "RESPONSE_MESSAGES.EMPTY_METRIC_NAME"
}
{
"error": "RESPONSE_MESSAGES.EMPTY_METRIC_VALUE"
}{
"error": "RESPONSE_MESSAGES.METHOD_NOT_ALLOWED"
}