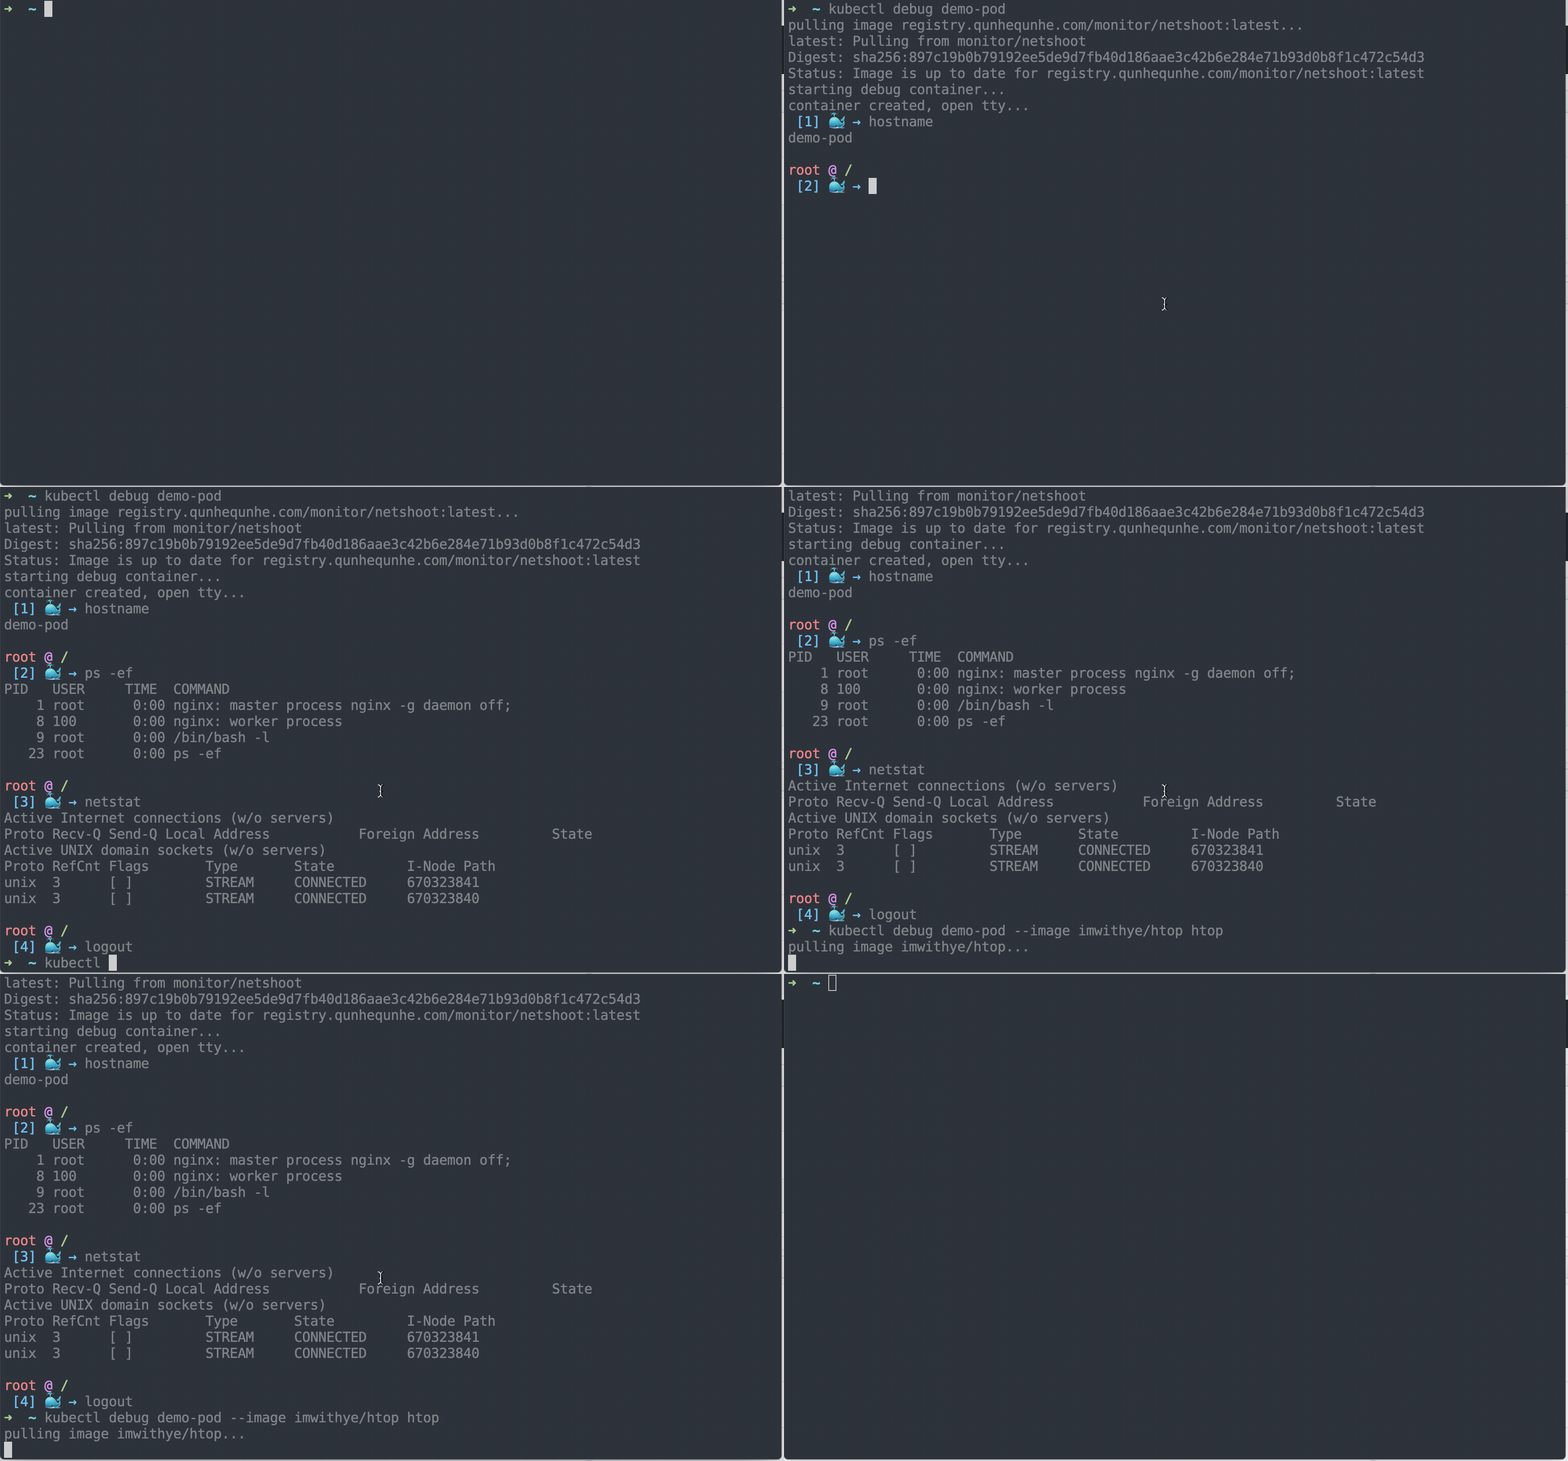
kubectl-debug is an out-of-tree solution for troubleshooting running pods, which allows you to run a new container in running pods for debugging purpose. The new container will join the pid, network, user and ipc namespaces of the target container, so you can use arbitrary trouble-shooting tools without pre-installing them in your production container image.
- screenshots
- quick start
- build from source
- configuration
- future works
- implementation details
- contribute
kubectl-debug is pretty simple, give it a try!
Install the debug agent DaemonSet in your cluster, which is responsible for running the "debug container":
kubectl apply -f https://raw.githubusercontent.com/aylei/kubectl-debug/master/scripts/agent_daemonset.yml
# or using helm
helm install -n=debug-agent ./contrib/helm/kubectl-debug
Install the kubectl debug plugin:
Using krew:
# Waiting the krew index PR to be merged...Homebrew:
brew install aylei/tap/kubectl-debugDownload the binary:
export PLUGIN_VERSION=0.1.0
# linux x86_64
curl -Lo kubectl-debug.tar.gz https://github.com/aylei/kubectl-debug/releases/download/v${PLUGIN_VERSION}/kubectl-debug_${PLUGIN_VERSION}_linux_amd64.tar.gz
# macos
curl -Lo kubectl-debug.tar.gz https://github.com/aylei/kubectl-debug/releases/download/v${PLUGIN_VERSION}/kubectl-debug_${PLUGIN_VERSION}_darwin_amd64.tar.gz

tar -zxvf kubectl-debug.tar.gz kubectl-debug
sudo mv kubectl-debug /usr/local/bin/
For windows users, download the latest archive from the release page, decompress the package and add it to your PATH.
Try it out!
# kubectl 1.12.0 or higher
kubectl debug -h
kubectl debug POD_NAME

# in case of your pod stuck in `CrashLoopBackoff` state and cannot be connected to,
# you can fork a new pod and diagnose the problem in the forked pod
kubectl debug POD_NAME --fork

# if the node ip is not directly accessible, try port-forward mode
kubectl debug POD_NAME --port-fowrad --daemonset-ns=kube-system --daemonset-name=debug-agent

# old versions of kubectl cannot discover plugins, you may execute the binary directly
kubect-debug POD_NAME
Any trouble? file and issue for help
Clone this repo and:
# make will build plugin binary and debug-agent image
make
# install plugin
mv kubectl-debug /usr/local/bin

# build plugin only
make plugin
# build agent only
make agent-dockerkubectl-debug uses nicolaka/netshoot as the default image to run debug container, and use bash as default entrypoint.
You can override the default image and entrypoint with cli flag, or even better, with config file ~/.kube/debug-config:
# debug agent listening port
# default to 10027
agentPort: 10027
# daemonset name of the debug-agent, used in port-forward
# default to 'debug-agent'
debugAgentDaemonset: debug-agent
# daemonset namespace of the debug-agent, used in port-forwad
# default to 'default'
debugAgentNamespace: kube-system
# whether using port-forward when connecting debug-agent
# default false
portForward: true
# image of the debug container
# default as showed
image: nicolaka/netshoot:latest
# start command of the debug container
# default ['bash']
command:
- '/bin/bash'
- '-l'
If the debug-agent is not accessible from host port, it is recommended to set portForward: true to using port-forawrd mode.
PS: kubectl-debug will always override the entrypoint of the container, which is by design to avoid users running an unwanted service by mistake(of course you can always do this explicitly).
kubectl-debug is supposed to be just a troubleshooting helper, and is going be replaced by the native kubectl debug command when this proposal is implemented and merged in the future kubernetes release. But for now, there is still some works to do to improve kubectl-debug.
If you are interested in any of following features, please file an issue to avoid potential duplication.
- Security.
kubectl-debugruns privileged agent on every node, and client talks to the agent directly. A possible solution is introducing a central apiserver to do RBAC, which integrates to the kube apiserver using aggregation layer - Protocol.
kubectl-debugvendor the SPDY wrapper fromclient-go. SPDY is deprecated now, websockets may be a better choice - e2e tests.
kubectl-debug consists of 2 components:
- the kubectl plugin: a cli client of
node agent, serveskubectl debugcommand, - the node agent: responsible for manipulating the "debug container"; node agent will also act as a websockets relay for remote tty
When user run kubectl debug target-pod -c <container-name> /bin/bash:
- The plugin gets the pod info from apiserver and extract the
hostIP, if the target container does not exist or is not currently running, an error is raised. - The plugin sends an HTTP request to the specific node agent running on the
hostIP, which includes a protocol upgrade from HTTP to SPDY. - The agent runs a container in the pod's namespaces (ipc, pid, network, etc) with the STDIN stay open (
-iflag). - The agent checks if the target container is actively running, if not, write an error to client.
- The agent runs a
debug containerwithttyandstdinopened, thedebug containerwill join thepid,network,ipcandusernamespace of the target container. - The agent pipes the connection into the
debug containerusingattach - Debug in the debug container.
- Job is done, user closes the SPDY connection.
- The node agent closes the SPDY connection, then waits for the
debug containerto exit and do the cleanup.
Feel free to open issues and pull requests. Any feedback is highly appreciated!


