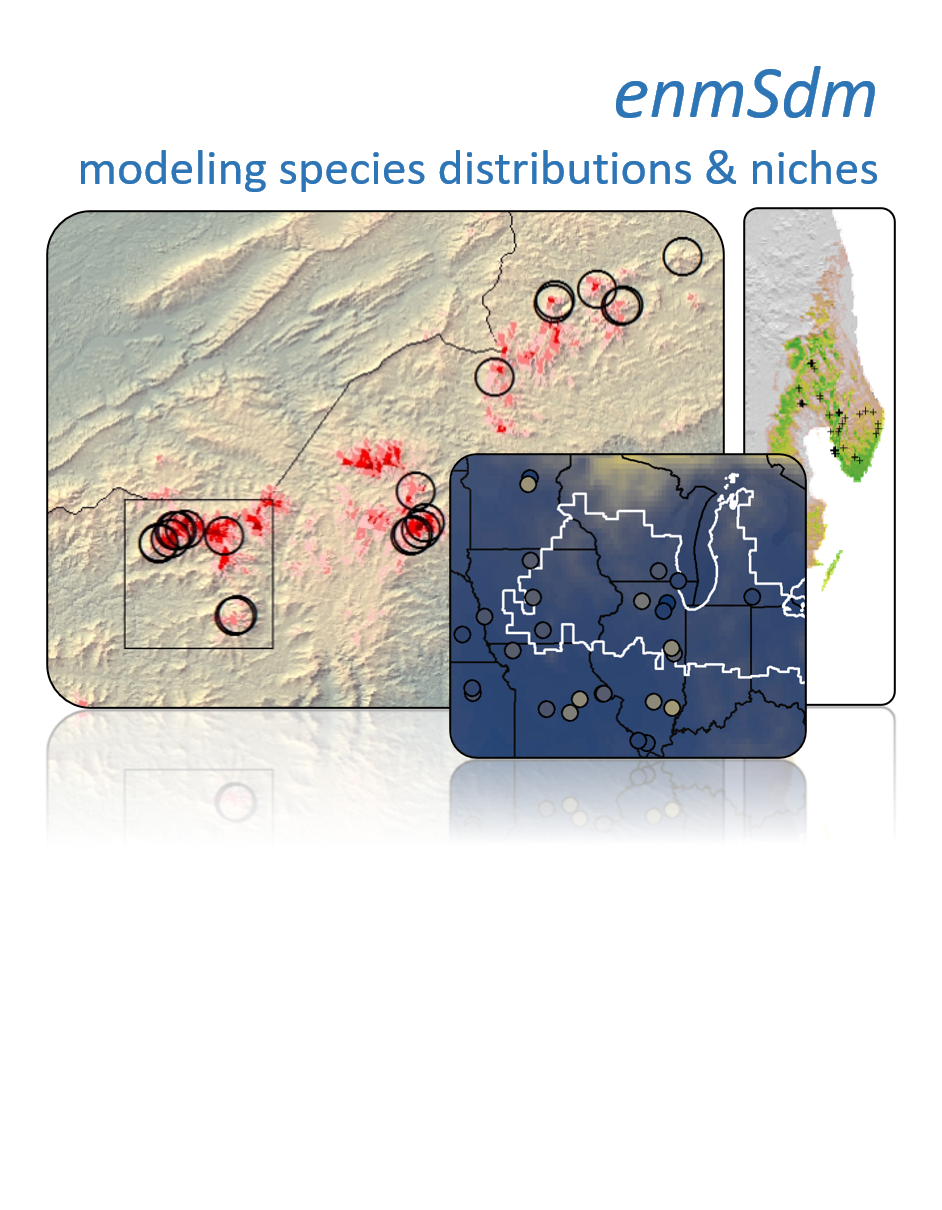
Tools for modeling niches and distributions of species
This package is a complement to the popular dismo package for R by Robert Hijmans. Its contains a suite of efficiency functions for preparing data, training and evaluating species distribution models and ecological niche models, and comparing ecological niches.
You can install this package in R using these commands:
remotes::install_github('adamlilith/enmSdm', dependencies=TRUE)
Note: If for some reason these commands don't work, you can install the package(s) by downloading the latest zip/tar file from the zipTarFiles directory and installing the package(s) manually. If you do this, you will also have to install the omnibus, statisfactory, and legendary packages, which are on GitHub also under my account (adamlilith).
elimCellDups: Eliminate duplicate points in each cell of a rastergeoFold: Generate geographically distinct k-foldsgeoThinandgeoThinApprox: Geographically thin points
trainByCrossValid: Wrapper for implementing sometrainXYZfunction across cross-validation folds (see alsosummaryByCrossValid).trainBrt: Boosted regression trees (BRTs)trainCrf: Conditional regression trees (CRFs)trainGam: Generalized additive models (GAMs)trainGlm: Generalized linear models (GLMs)trainGlmDredge: Generalized linear models (GLMs)trainLars: Least-angle regression models (LARS)trainMaxEntandtrainMaxNet: Maxent modelstrainNs: Natural splines (NSs)trainRf: Random forests (RFs)
aucWeighted: AUC (with/out site weights)aucMultiWeighted: Multivariate version of AUC (with/out site weight)contBoyce: Continuous Boyce Index (with/out site weights)contBoyce2x: "2X coverage" version of the Continuous Boyce Index (with/out site weights)fpb: Fpb measure of model discrimination capacity (with/out site weights)thresholdWeighted: Thresholds to convert continuous predictions to binary predictions (with/out site weights)thresholdStats: Model performance statistics based on thresholded predictions (with/out site weights)tssWeighted: True Skill Statistic (TSS) (with/out site weights)modelSize: Number of response values in a model object
compareNiches: Niche overlap metricscompareResponse: Compare niche model responses to a single variablemop: Calculate mobility-oriented parity, a measure of multivariate distance as per Saupe et al. 2012.nicheOverlap: Calculate niche overlap as per Broennimann et al. Global Ecology and Biogeography 21:481-497randPointsRespectingSelf: Randomize geographic points while approximately respecting observed spatial autocorrelation structure between pointsrandPointsRespectingSelfOther2: Randomize two sets of geographic points while approximately respecting observed spatial autocorrelation structure between and within setsrandPointsBatch: CallrandPointsRespectingSelforrandPointsRespectingSelfOther2multiple timesrandPointsBatchExtract: Extract environment from a set of rasters for sets of randomized points generated usingrandPointsBatchrandPointsBatchSampled: Collate all sets of randomized points generated usingrandPointsBatchrandPointsBatchNicheOverlap: Calculate niche overlap between sets of randomized points that were generated usingrandPointsBatch
spatialCorrForPoints: Calculate pairwise distance-based measure of global spatial autocorrelation between geographic pointsspatialCorrForPointsSummary: Characteristic cluster size of spatial points (distance of global autocorrelation)spatialCorrForPointsPlot: Plot observed and null distributions of pairwise distance-based measure of global spatial autocorrelationspatialCorrForPointsWeight: Assign weights to points based on pairwise distance-based measure of global spatial autocorrelation
bioticVelocity: Velocity of movement across a series of rastersinterpolateRasters: Interpolate a stack of rasterslongLatRasters: Generate rasters with values of longitude/latitude for cell valuesrastWithSquareCells: Create a raster with square cells from an object with an extentsampleRastandsampleRastStrat: Sample raster with/out replacement and possibly in a stratified mannersquareRastCells: Resample a raster so cells are square
mcpFromPolygons: Minimum convex polygon from a set of polygons and pointsareaFromPointsOrPoly: Area of a spatial polygon or set of points
convertTropicosCoords: Convert coordinates from the TROPICOS databasecoordPrecision: Calculate maximum possible coordinate precisiondecimalToDms: Convert decimal coordinate to degrees-minutes-secondsdmsToDecimal: Convert degrees-minutes-seconds coordinate to decimalgetCRS: Return a proj4string (coordinate reference system string) using a nicknamegetEPSG: Return a EPSG code (coordinate reference system codeg) using a nicknamepointDist: Geographic distance between set(s) of pointsxToCoords: Extract geographic coordinates from a data frame, matrix, or SpatialPoints* object
lemurs: Lemur occurrencesmad0: Madagascar spatial object
As of October 2020 there is no package-specific publication for enmSdm, but the package was first used and cited in:
Morelli*, T.L., Smith*, A.B., Mancini, A.N., Balko, E. A., Borgenson, C., Dolch, R., Farris, Z., Federman, S., Golden, C.D., Holmes, S., Irwin, M., Jacobs, R.L., Johnson, S., King, T., Lehman, S., Louis, E.E. Jr., Murphy, A., Randriahaingo, H.N.T., Lucien, Randriannarimanana, H.L.L., Ratsimbazafy, J., Razafindratsima, O.H., and Baden, A.L. 2020. The fate of Madagascar’s rainforest habitat. Nature Climate Change 10:89-96. * Equal contribution https://doi.org/10.1038/s41558-019-0647-x
Abstract. Madagascar has experienced extensive deforestation and overharvesting, and anthropogenic climate change will compound these pressures. Anticipating these threats to endangered species and their ecosystems requires considering both climate change and habitat loss effects. The genus Varecia (ruffed lemurs), which is composed of two Critically Endangered forest-obligate species, can serve as a status indicator of the biodiverse eastern rainforest of Madagascar. Here, we combined decades of research to show that the suitable habitat for ruffed lemurs could be reduced by 29–59% from deforestation, 14–75% from climate change (representative concentration pathway 8.5) or 38–93% from both by 2070. If current protected areas avoid further deforestation, climate change will still reduce the suitable habitat by 62% (range: 38–83%). If ongoing deforestation continues, the suitable habitat will decline by 81% (range: 66–93%). Maintaining and enhancing the integrity of protected areas, where rates of forest loss are lower, will be essential for ensuring persistence of the diversity of the rapidly diminishing Malagasy rainforests.
