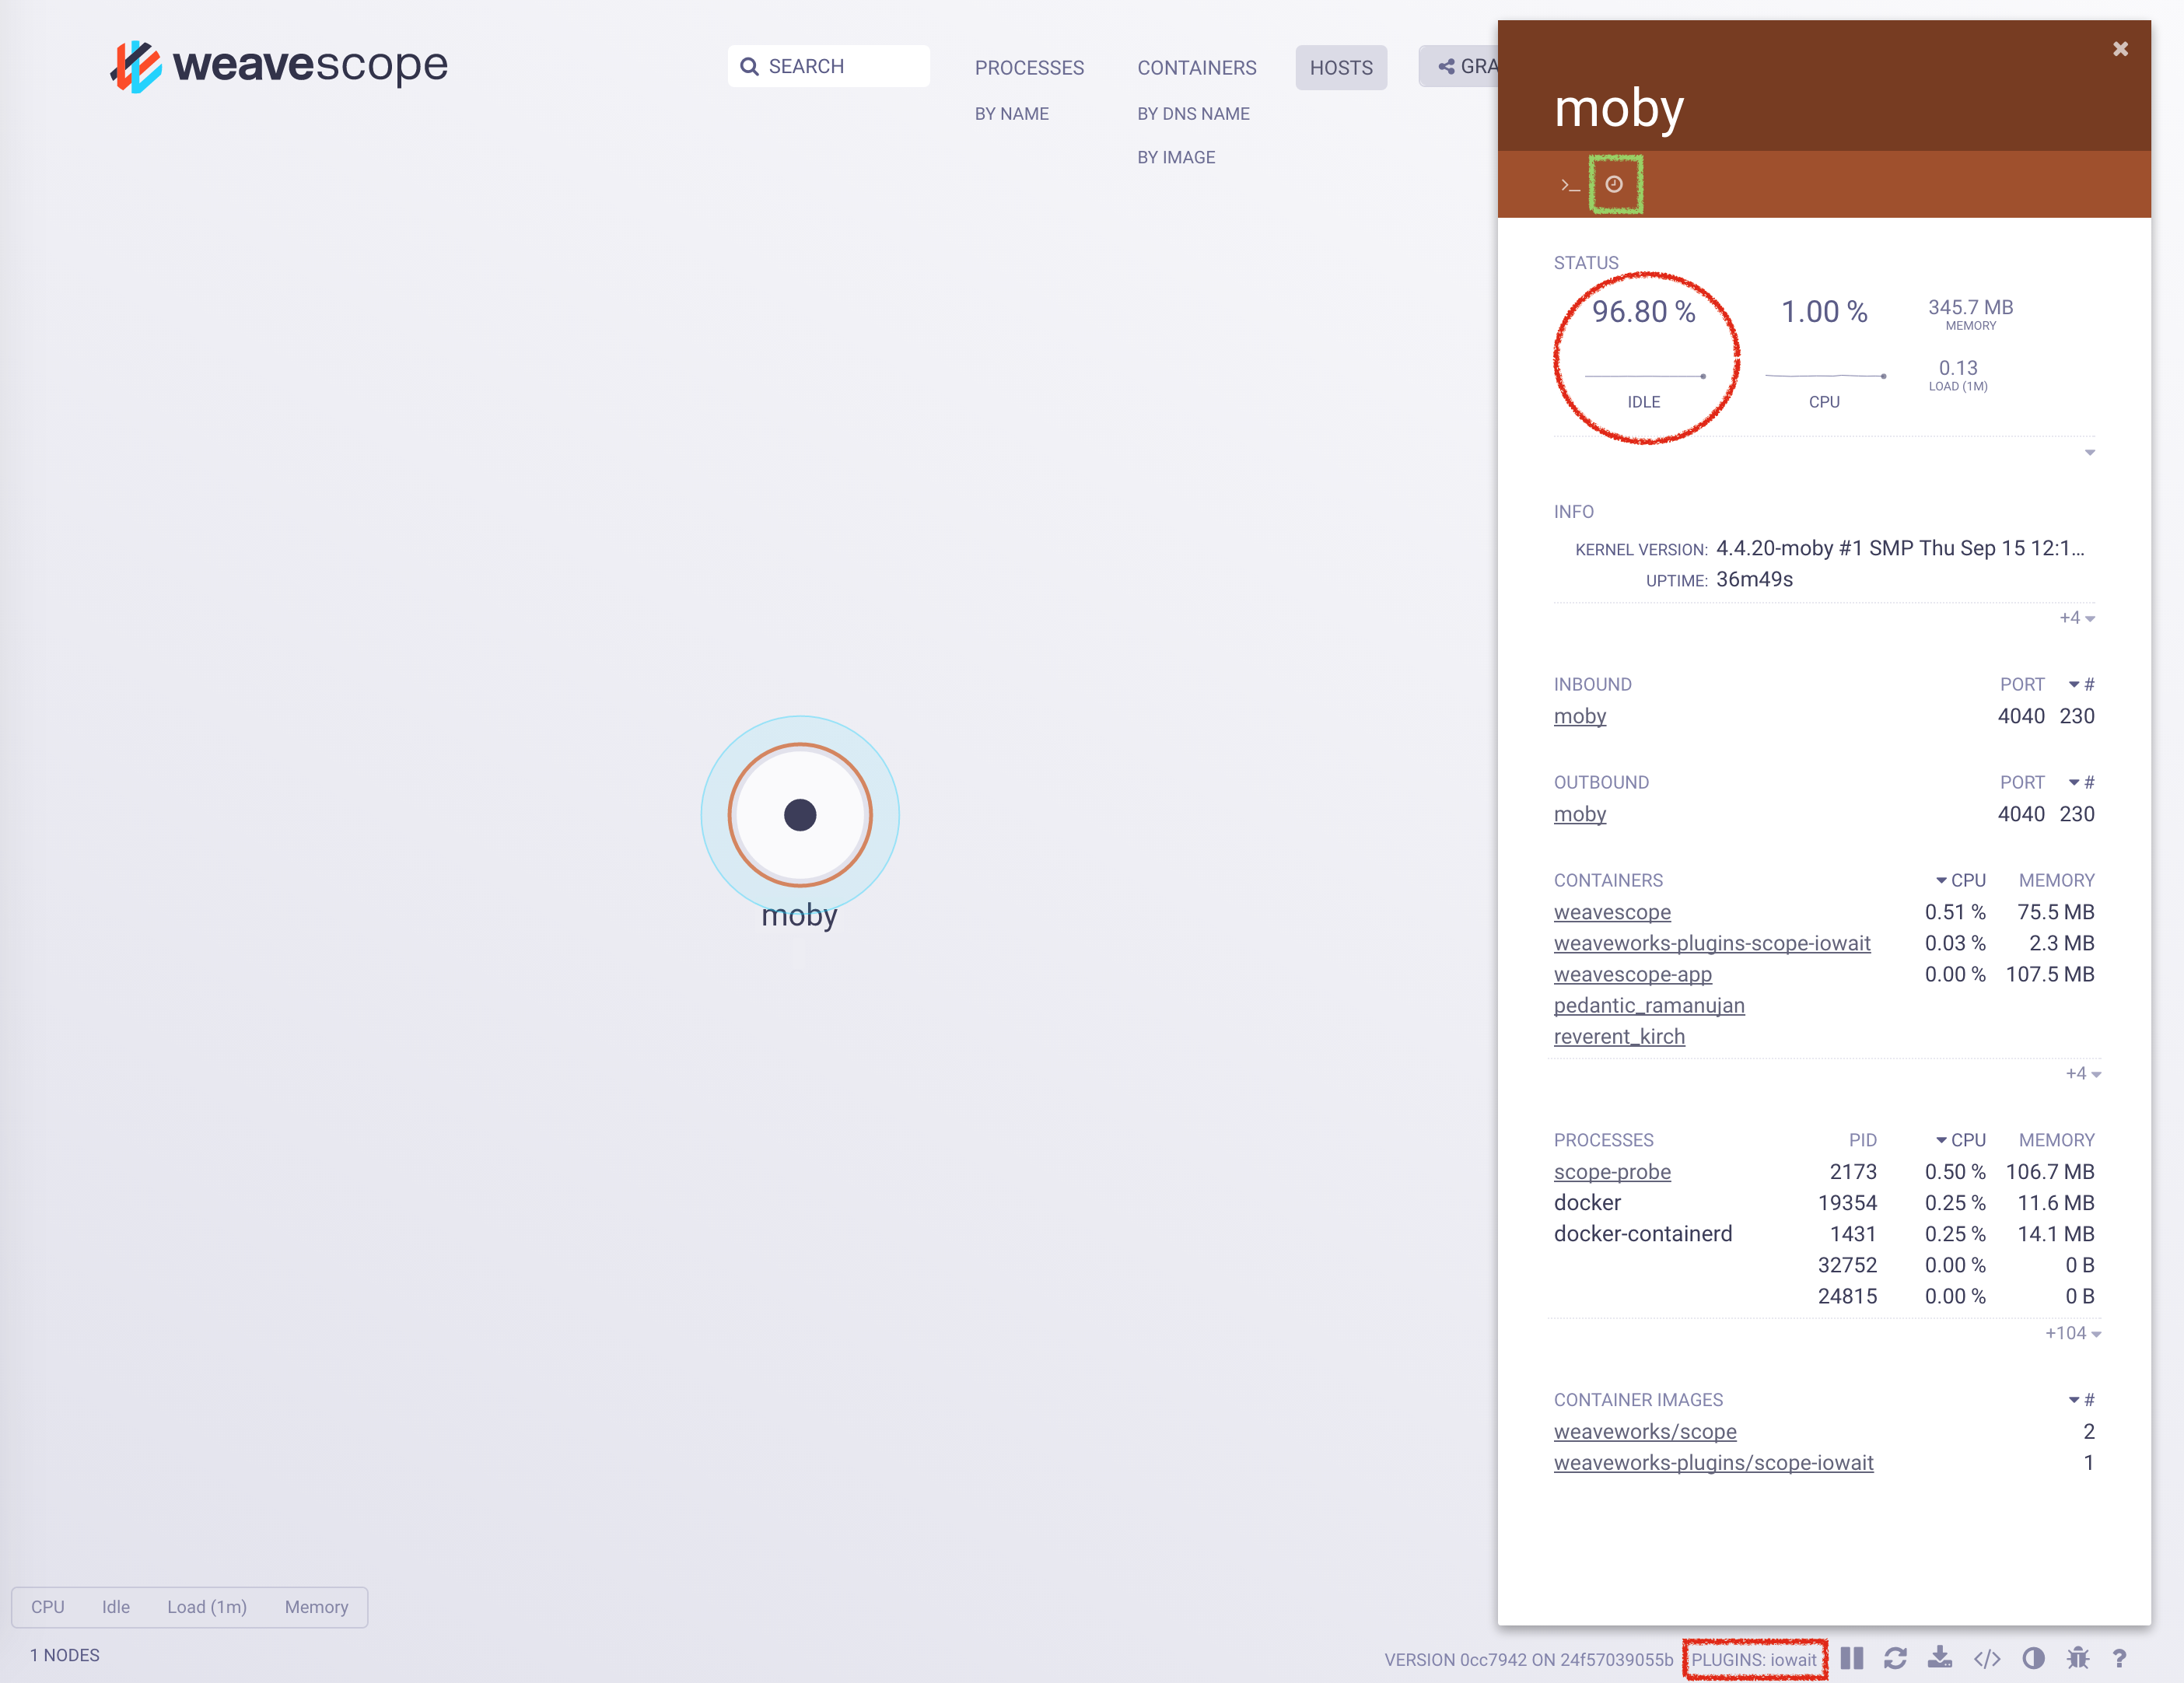
The Scope IOWait plugin is a GO application that uses iostat to provide host-level CPU IO wait or idle metrics in the Weave Scope UI.
The Scope IOWait plugin can be executed stand alone.
It will respond to GET /report request on the /var/run/scope/plugins/iowait/iowait.sock in a JSON format.
If the running plugin has been registered by Scope, you will see it in the list of PLUGINS in the bottom right of the UI (see the red rectangle in the above figure).
The measured value is shown in the STATUS section (see the circle in the above figure).
If you want to make sure of running the latest available version of the plugin, you pull the image from docker hub.
docker pull weaveworksplugins/scope-iowait:latest
To run the Scope IOWait plugin you just need to run the following command.
docker run --rm -ti \
	--net=host \
	-v /var/run/scope/plugins:/var/run/scope/plugins \
	--name weaveworksplugins-scope-iowait weaveworksplugins/scope-iowait:latest
If you want to use the Scope IOWait plugin in an already set up Kubernetes cluster with Weave Scope running on it, you just need to run:
kubectl apply -f https://raw.githubusercontent.com/weaveworks-plugins/scope-iowait/master/deployments/k8s-iowait.yaml
git clone git@github.com:weaveworks-plugins/scope-iowait.git
cd scope-iowait; make;
The plugin can show in the UI 2 metrics collected by iostat:
- Idle: show the percentage of time that the CPU or CPUs were idle and the system did not have an outstanding disk I/O request. This metrics is shown by the default.
- IO Wait: Show the percentage of time that the CPU or CPUs were idle during which the system had an outstanding disk I/O request.
To switch between metrics you can use the controls. The clock icon (see green box in the above figure) switches to IO Wait metric and the gears icon switches to idle metric.
