by Qin Yu, Jun 2018
This is the coursework for the master level statistics course ME317/ST429 Statistical Methods for Risk Management at LSE.
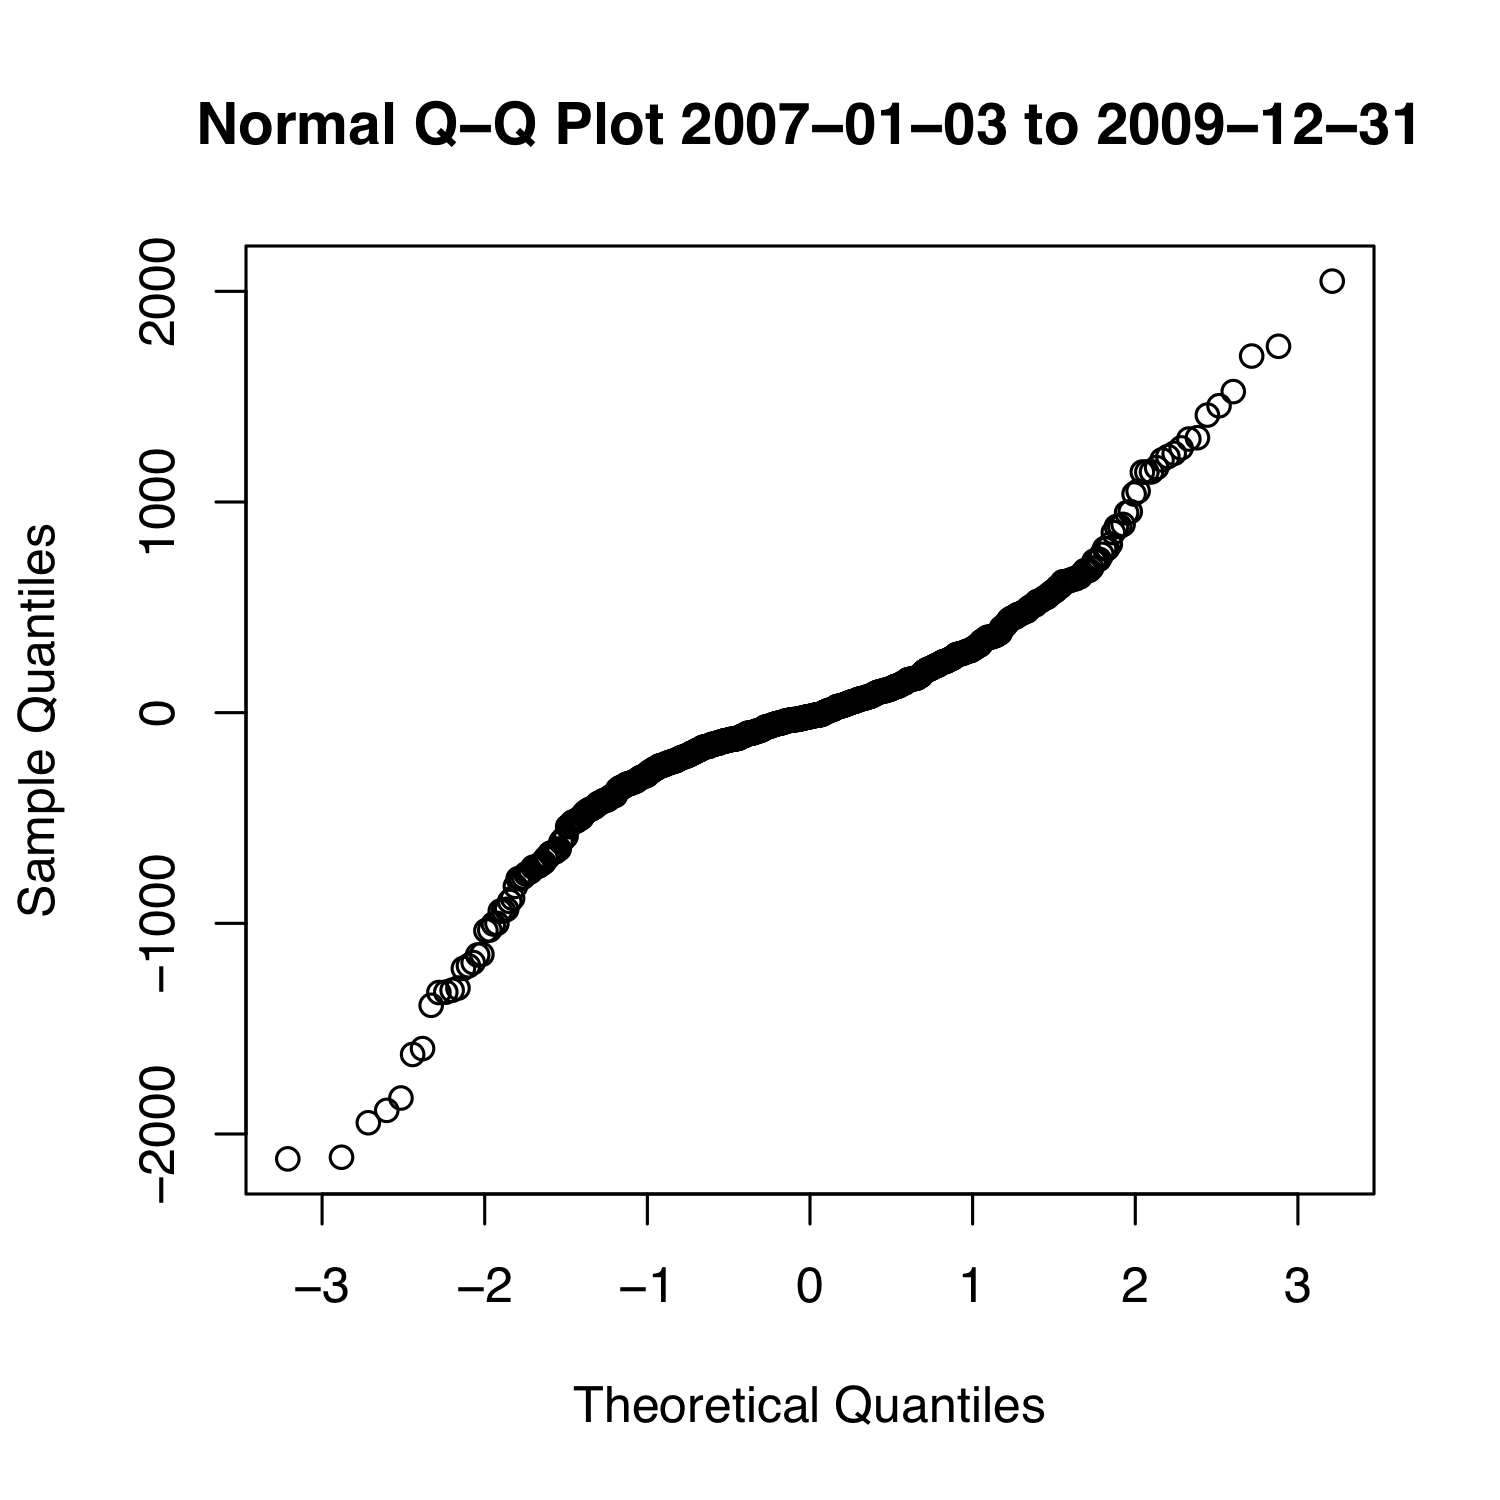
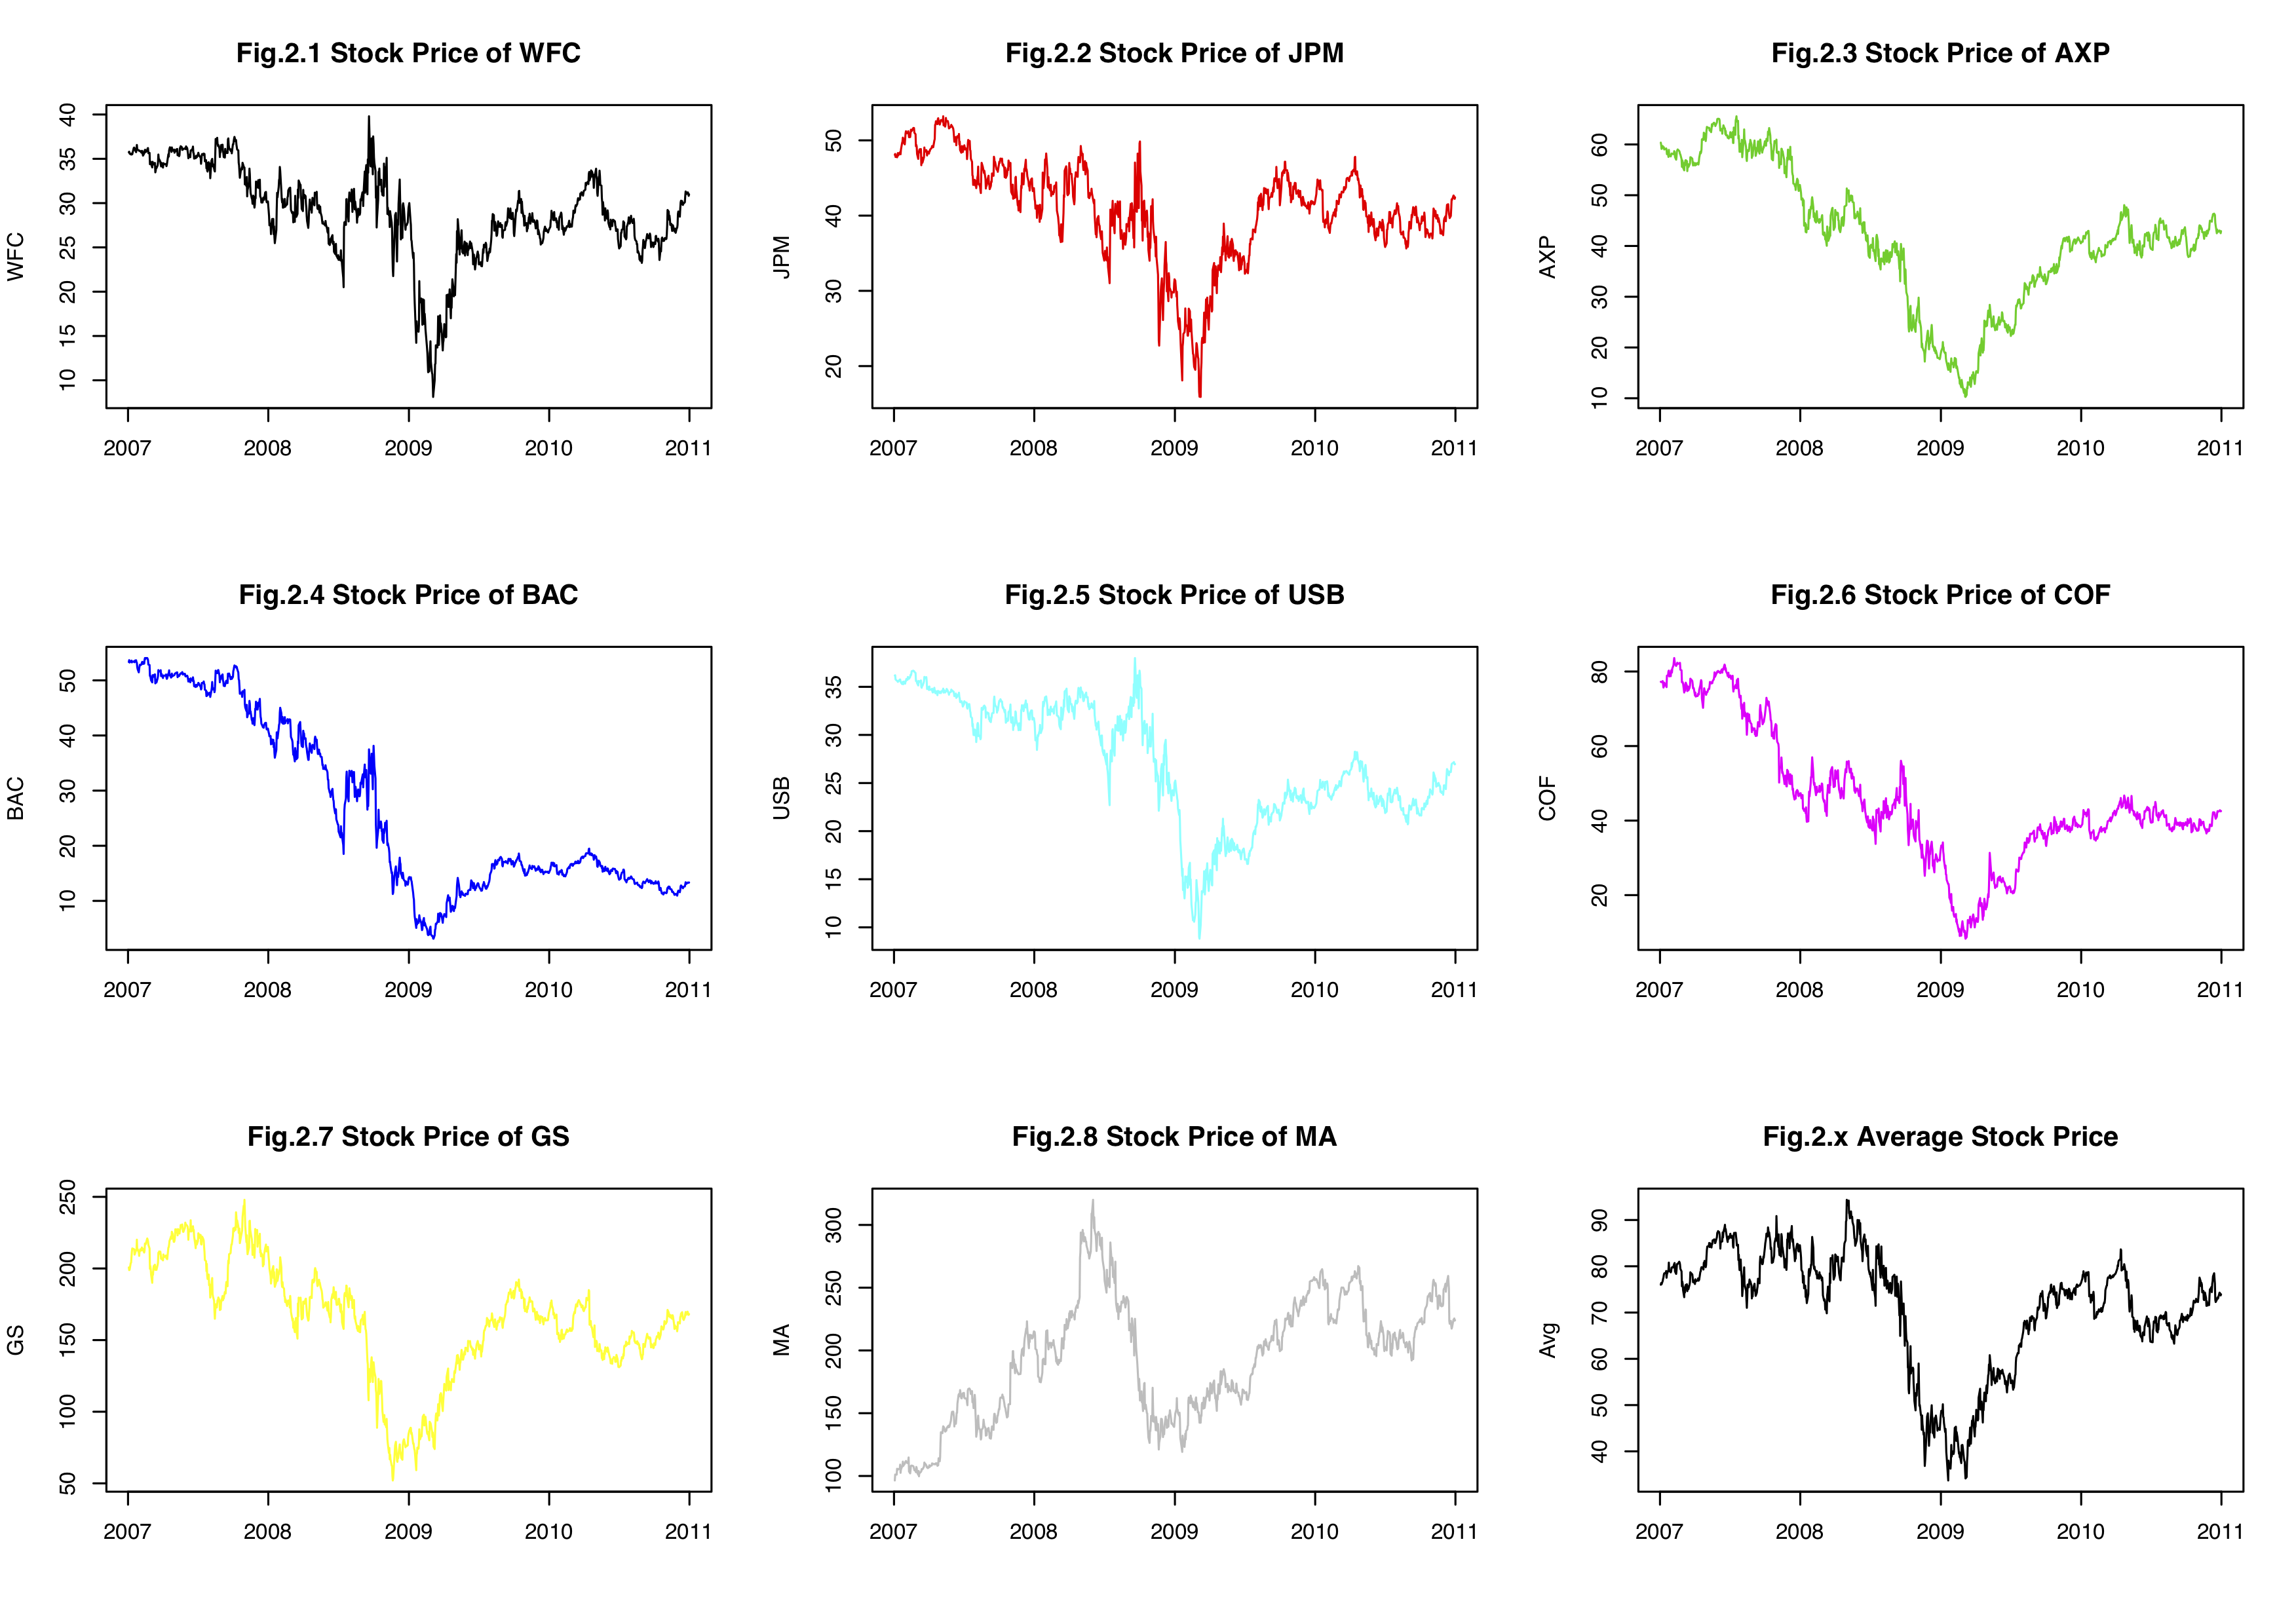
To analyse the stock price data, statistically, during the Global Financial Crisis, the auther used R on selected once including 8 stocks for the financial industry (and the average), 4 stocks for the technology industry, and 4 stocks for the energy industry, from 1st July 2006 to 30th june 2011 (but focus on 1st Jan. 2007 to 31st Dec 2010). With illustrations, we shall see from a mathematical and statistical point of view, what happend to these industries in the Global financial crisis.


