print("Hello, Python!")(setq org-babel-python-command "/home/j-brady/anaconda3/bin/python")import pandas as pd
df = pd.DataFrame({"a":[1,2,3,4],"b":[5,6,7,8]})
return df.valuesChange to another python environment…
(setq org-babel-python-command "/home/j-brady/anaconda3/envs/test/bin/python")
import sys
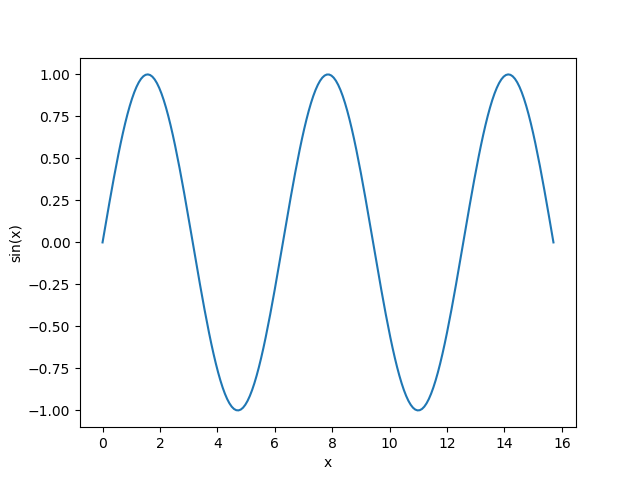
return sys.version_infoMatplotlib plots can be created and viewed within org-mode using the following code adapted from this awesome blog post.

(setq org-roam-dailies-directory "daily/")
(setq org-roam-dailies-capture-templates
      '(("l" "lab" entry
         #'org-roam-capture--get-point
         "* %?"
         :file-name "daily/%<%Y-%m-%d>-${name}"
         :head "#+title: %<%Y-%m-%d> - ${name}\n"
         :olp ("Lab notes for ${name}"))

        ("p" "project-1" entry
         #'org-roam-capture--get-point
         "* %?"
         :file-name "daily/%<%Y-%m-%d>-project-1"
         :head "#+title: %<%Y-%m-%d> - project-code-1\n#+roam_tags: project-code-1"
         :olp ("Lab notes for project-1"))

        ("j" "journal" entry
         #'org-roam-capture--get-point
         "* %?"
         :file-name "daily/%<%Y-%m-%d>"
         :head "#+title: %<%Y-%m-%d>\n"
         :olp ("Journal"))))
Then use M-x org-roam-dailies-capture-today to access the template menu.
- one
- two
- three
- one
- two
- three