Simple Statistical Analysis of Australian Lottery
Idea:
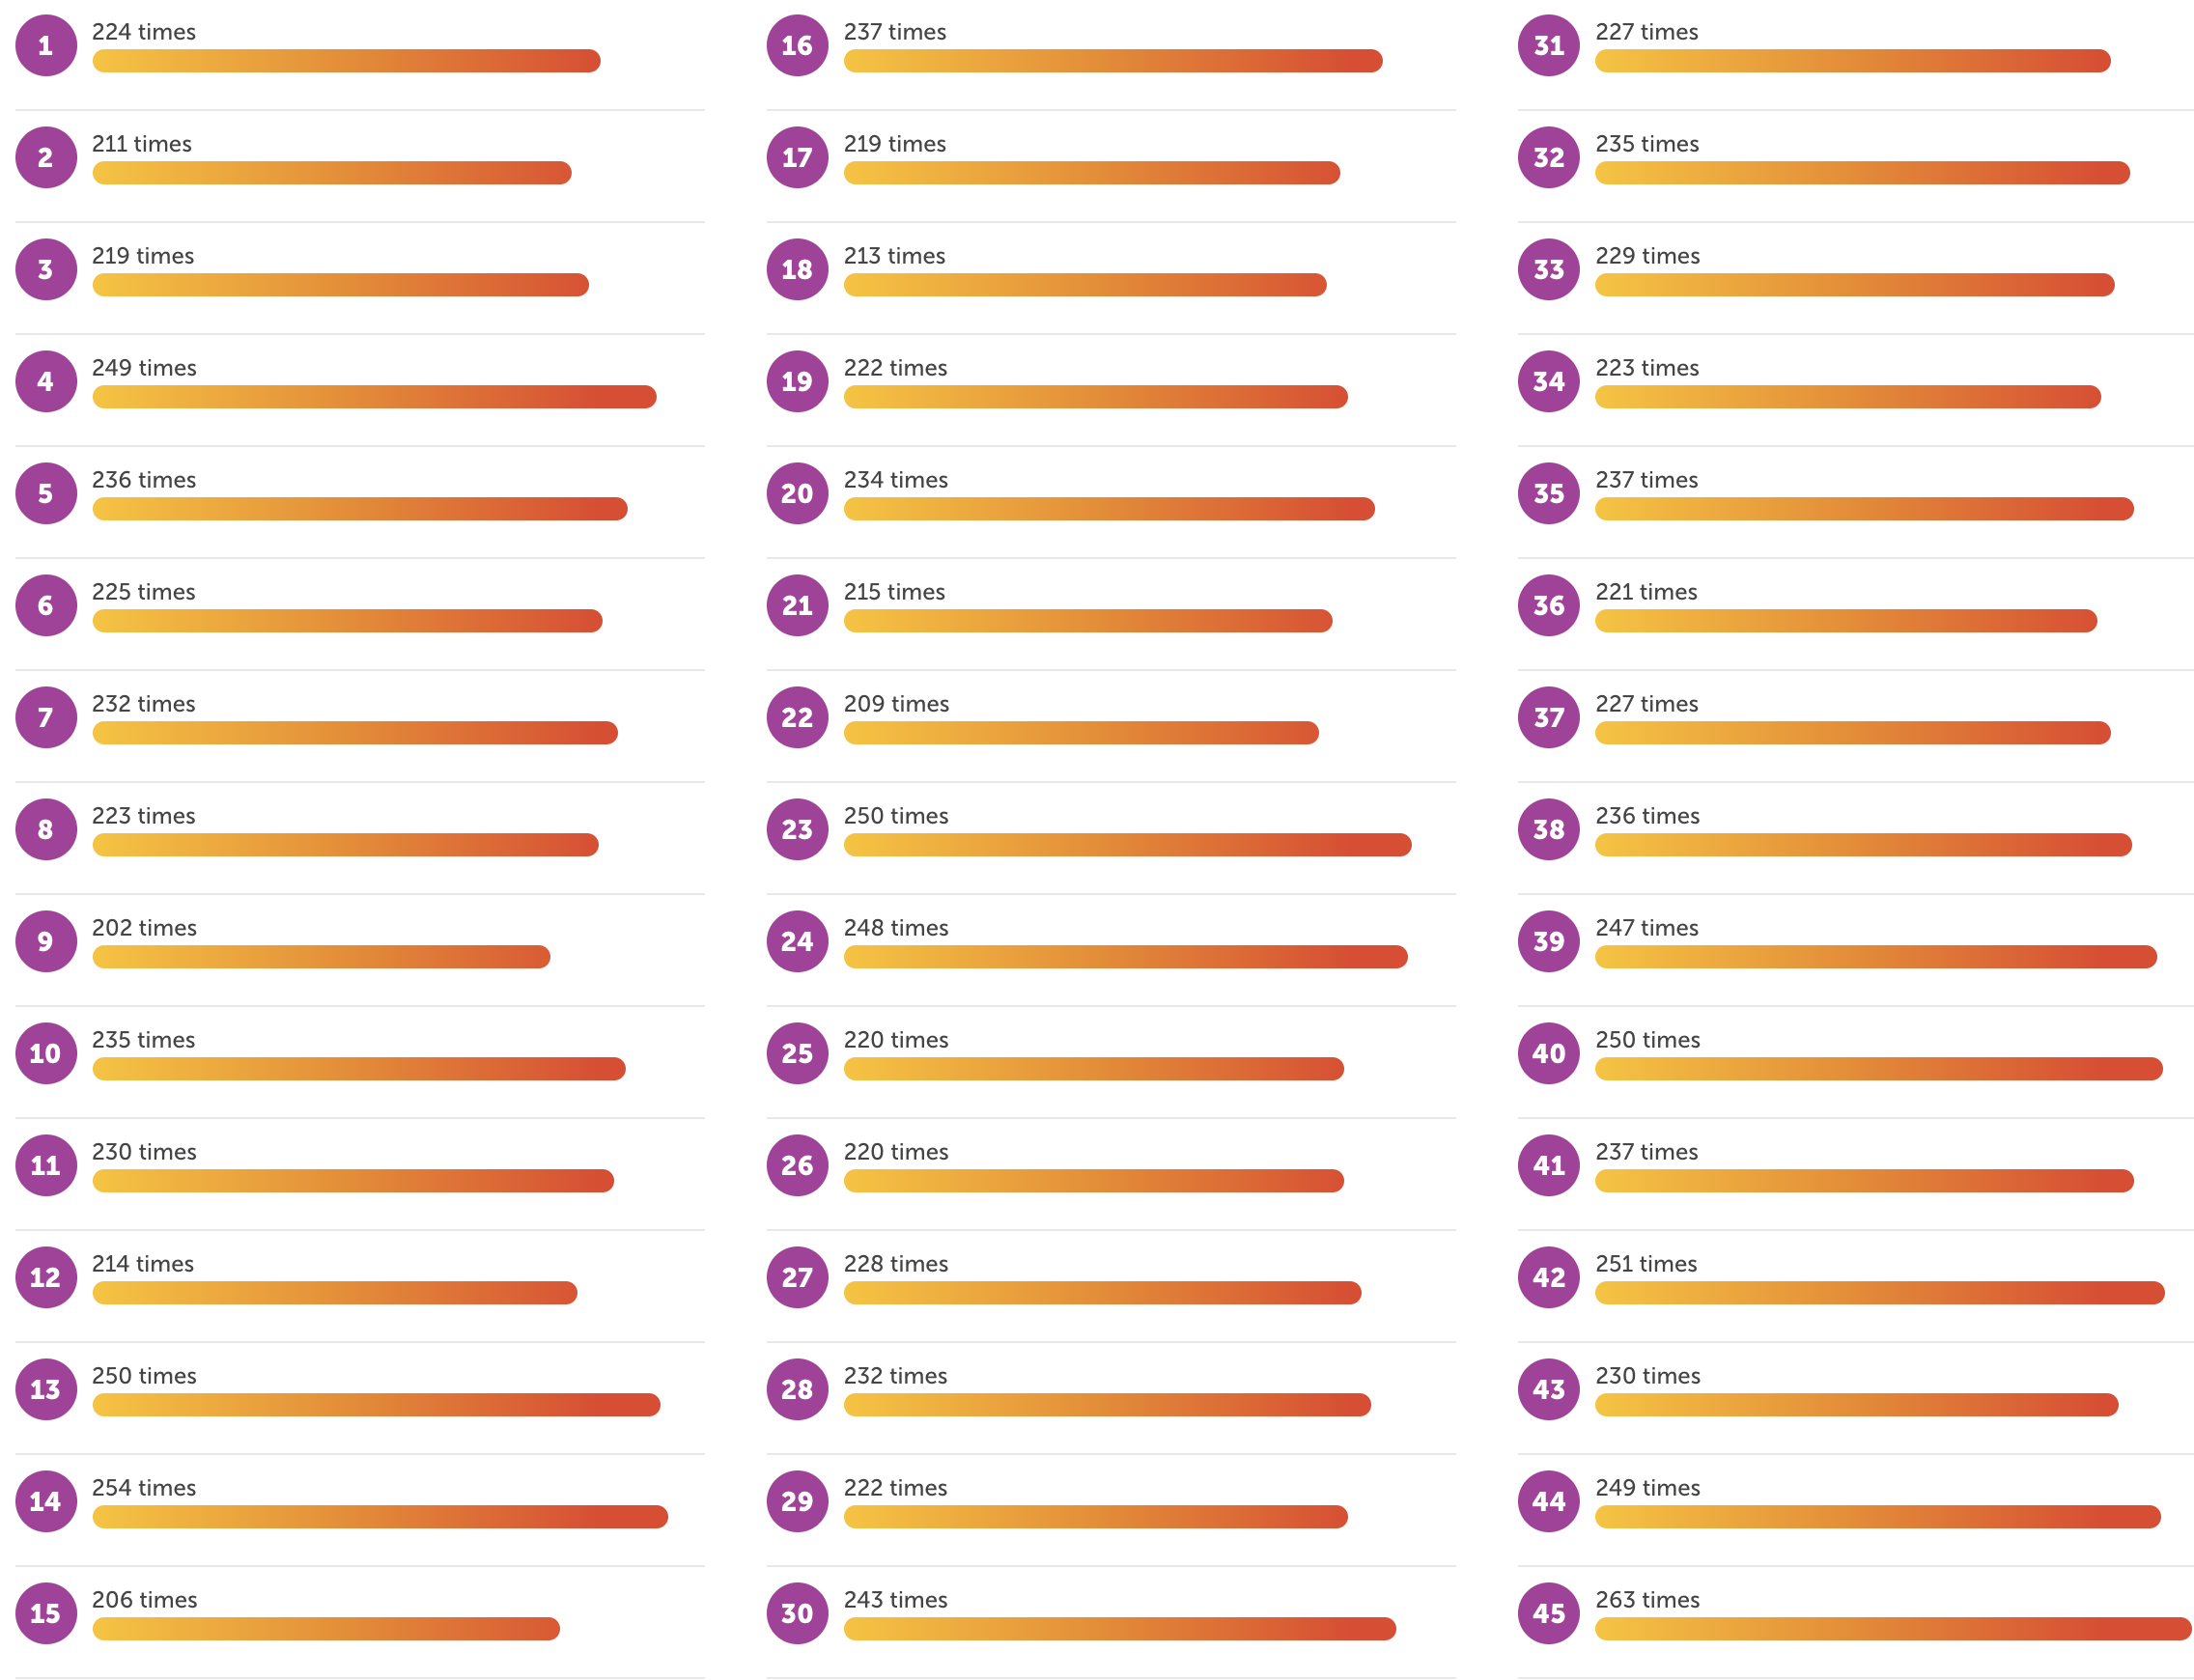
Previous Draws of MonWedLotto per number
Image Source: https://www.thelott.com/mon-wed-lotto/results
-
Statistically, each number has the same chances for being drawn (independently). Hence the repetitions per number are roughly the same in the long term perspective.
-
The image shown above shows that the "draws" of numbers are almost-equally distributed.
- It seems like it implies that the lottery machine abides by the rule "true randomness."
-
If the lottery machine plays by the "true randomness" rule, with a number drawn, the chances of the other number gets picked are identically equal to each other. (1 / remainders in the machine).
Objective:
- The main objective of this side-project is conducting a simple statistical analysis to visually check whether the lottery machine follows the rule based on the previous draws since 2012 January.
- Conducted against two lotteries: Mon & Wed Lotto and Saturday Lotto. It is only because those are the two lotteries I buy weekly.
- The minor objective is making a ticket generator based on the conducted analysis to have a "higher-chance-of-winning" for fun.
Result:
Analysis:

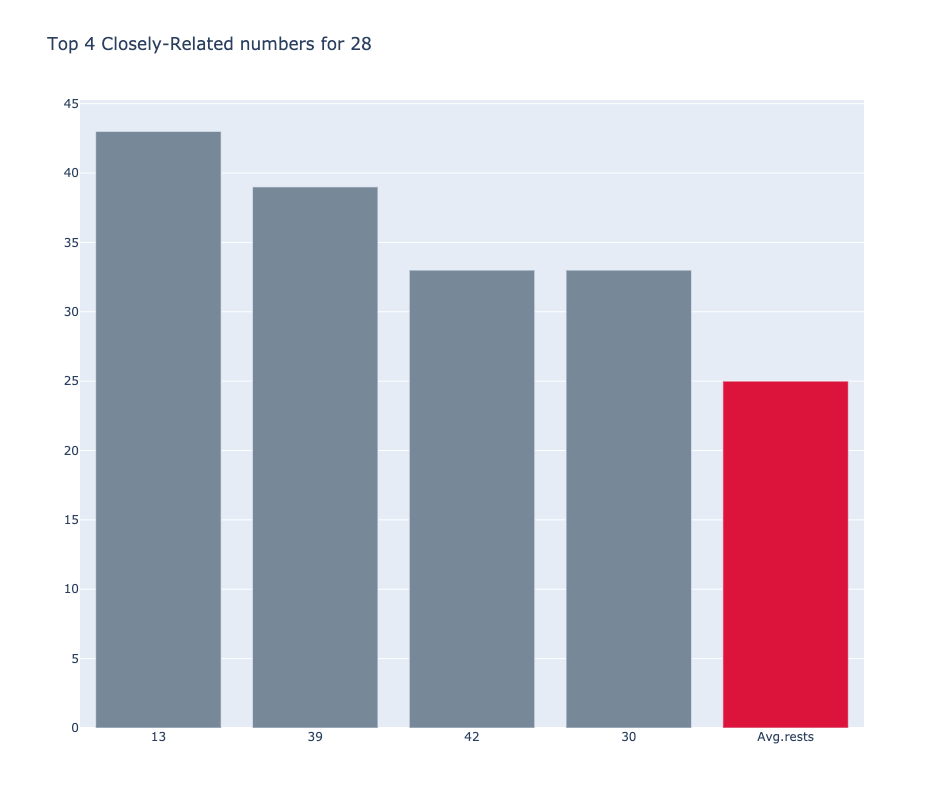
Top 4 numbers that are drawn the most with number ___28___
- The number 13 were drawn 43 times, which is 70% more than the average; 25 times.
- Most of the numbers tend to have around 20-30% more chances to be drawn together with its top four numbers than the averages.
# Adjust n to create data with top_n numbers per each number
retrieve_plot_info(corrNums_data, n)
Ticket Generator:
- Again, this is for fun and the used odds are BASED ON the previous draws.
- If you want to make complete-random tickets, do so at https://www.random.org/quick-pick/
# Ignore 0.5 - threshold for future implemenation
# 5 - top_n elements you want to generate from the data.
ticket_generator(df_wed_corrNums, 0.5, 5)

# By setting None -> Random First number pick
# Otherwise, put number in it
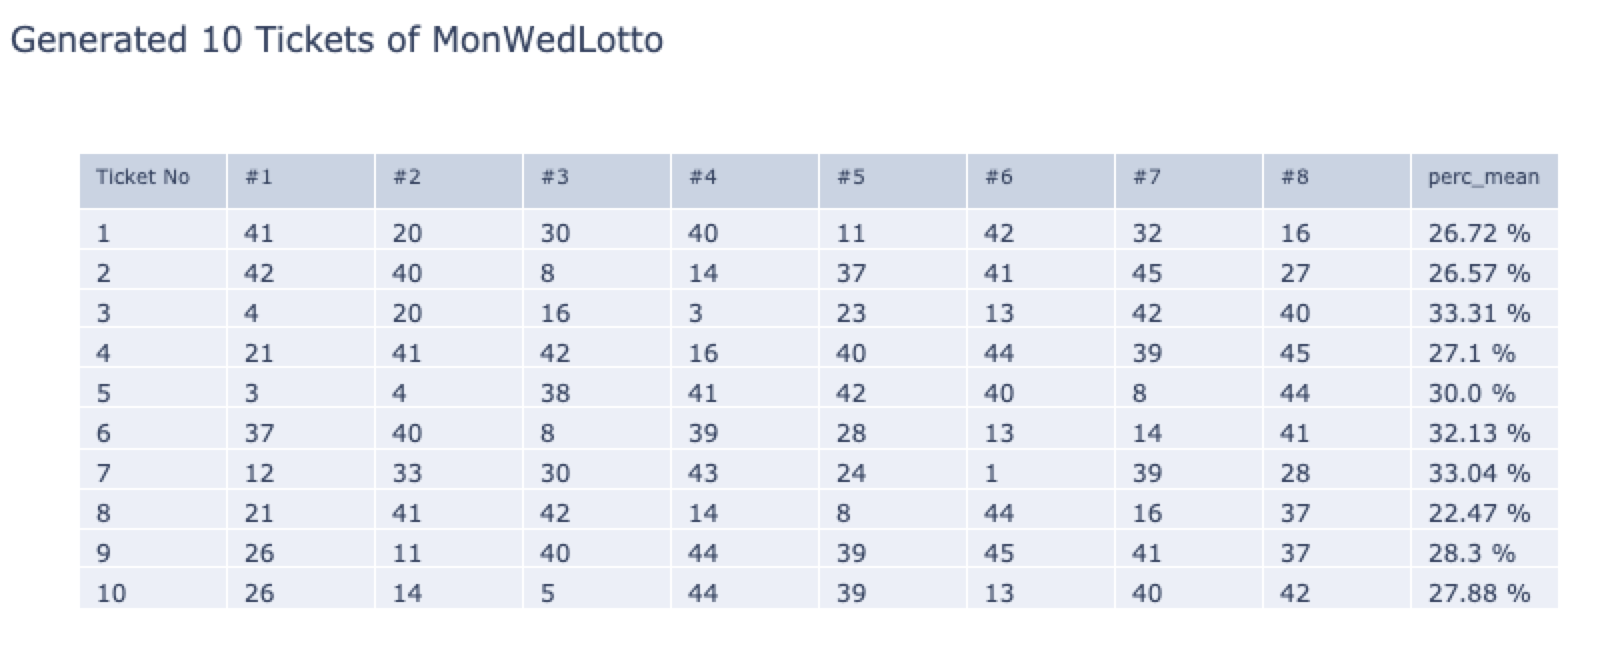
gameGenerator(df_wed_corrNums, 10, 5, None)- By running the above functions, you will be able to have the following generated tickets:

Generated Tickets based on the above conducted analysis
- perc_mean is the average percentage that shows how much more likely the ticket to be drawn together compares to the other numbers (in average) as a set.
- For example, in Ticket No. 1:
- 20 (#2) has 25% (roughly) chances of more likely being drawn together with 41 (#1)
- #3 has a% chances of .... with 20 (#2)
- and so on...
- In another interpretation, it could be said that those numbers (in each generated ticket) are perc_mean more bound to each other.
