Analyzing Critic & Audience Ratings of Popular Movies with Python and Power BI
Overview • Prerequisites • Architecture • Demo • Support • License
Overview
This project focuses on analyzing and finding correlations between the audience and critic ratings for some of the popular movies released between 2009-2011.
The deep-dive analysis of ratings also takes the movie genre and movie budget into account.
The repository directory structure is as follows:
Movies-Ratings-Analysis
├─ 01_DATA
├─ 02_ANALYSIS
├─ 03_DASHBOARD
├─ 04_RESOURCES
The type of content present in the directories is as follows:
01_DATA
This directory contains the data that can be directly used for exploratory data analysis and data visualization purposes.
02_ANALYSIS
This directory contains the python notebooks that analyzes the clean dataset to generate insights
03_DASHBOARD
This directory contains the python notebook with an embedded Power BI report that visualizes the data. The Power BI dashboard contains slicers, cross-filtering and other advance capabilities that end user can play with to visualize a specific facet of the data or, to get additional insights.
04_RESOURCES
This directory contains images, icons, layouts, etc. that are used in this project
Prerequisites
The major skills that are required as prerequisite to fully understand this project are as follows:
- Basics of Python
- Python libraries: Numpy, Pandas, Matplotlib, Seaborn
- Basics of Python Notebooks
- Basics of Power BI
In order to complete the project, I've used the following applications and libraries
- Python
- Python libraries mentioned in requirements.txt file
- Jupyter Notebook
- Visual Studio Code
- Microsoft Power BI
The choice of applications & their installation might vary based on individual preferences & system settings.
Architecture
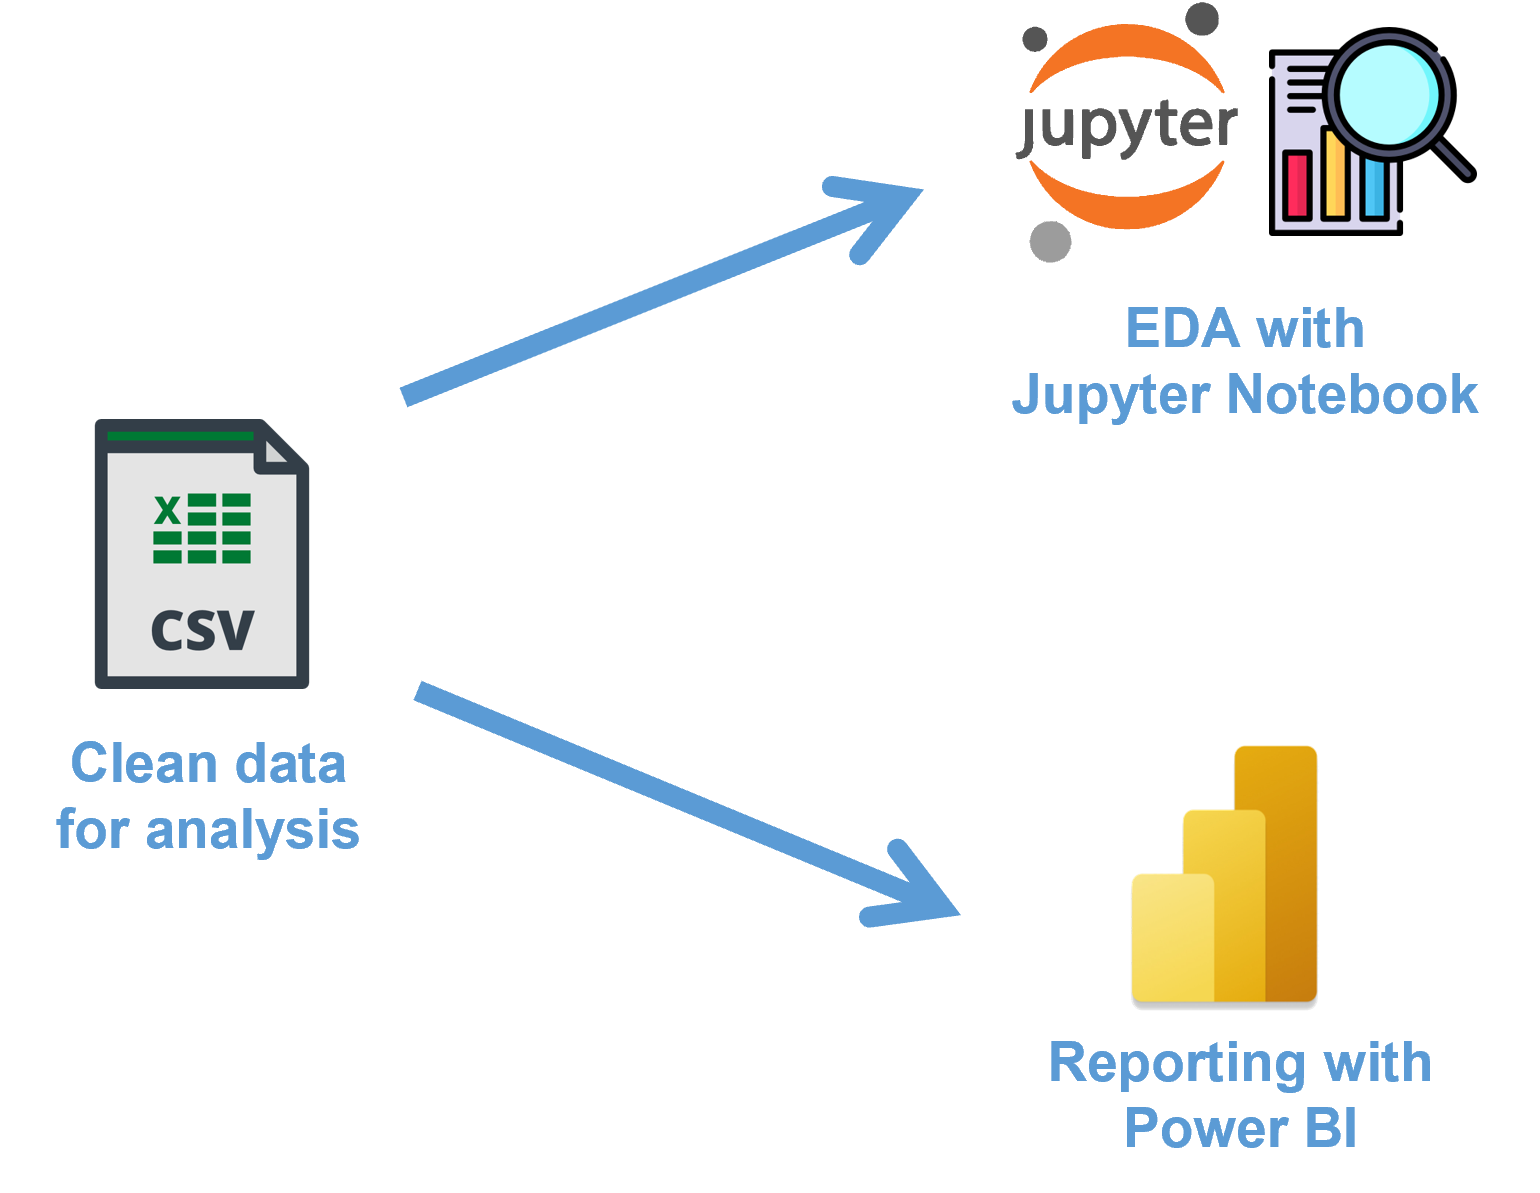
The project architecture is quite straight forward and can be explained through the below image:
As per the above workflow; we are first importing data present as numpy matrix from the Python file which is then processed and cleaned with another ETL specific Python script.
Finally; we leverage the clean & analysis-ready dataset for some exploratory data analysis (EDA) using Jupyter Notebook and creating an insightful report using Power BI
Demo
To be updated.
Support
If you have any doubts, queries or, suggestions then, please connect with me in any of the following platforms:
If you like my work then, you may support me at Patreon:

License
This license allows reusers to distribute, remix, adapt, and build upon the material in any medium or format for noncommercial purposes only, and only so long as attribution is given to the creator. If you remix, adapt, or build upon the material, you must license the modified material under identical terms.


