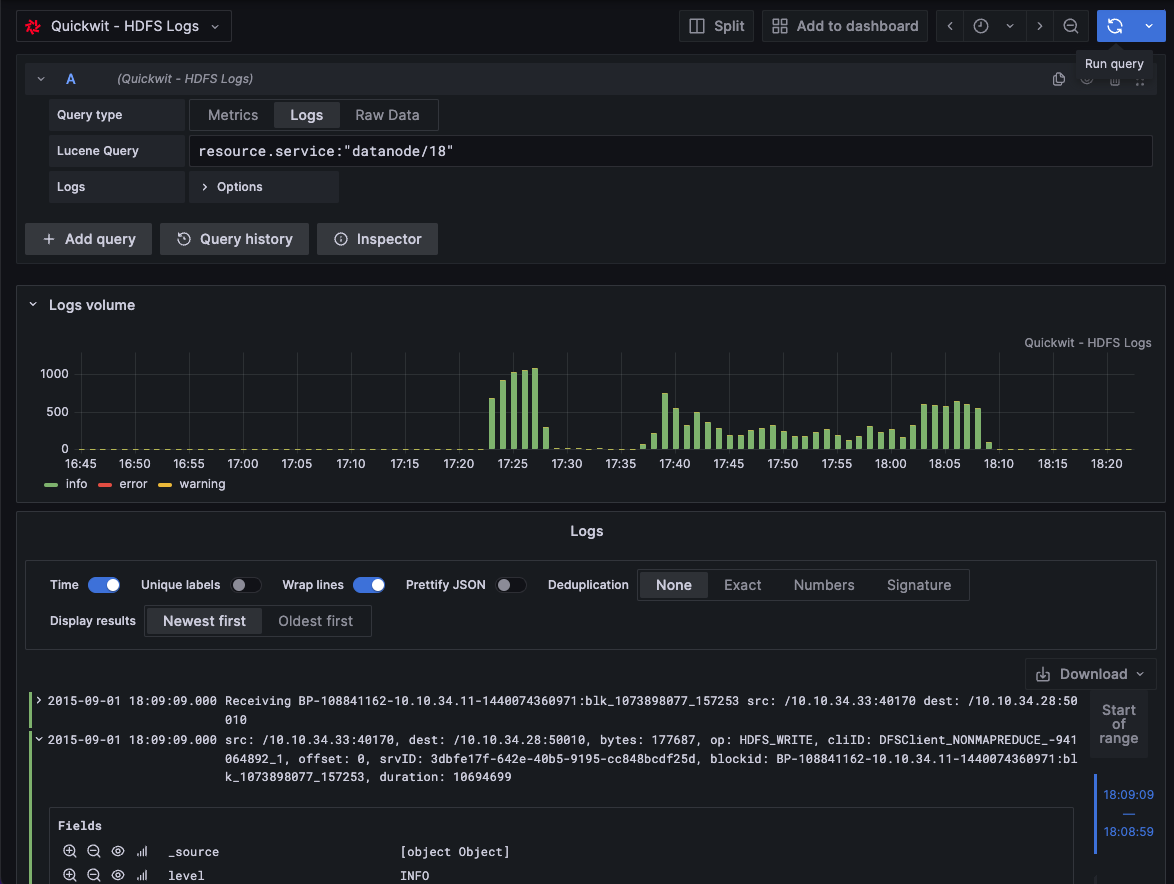
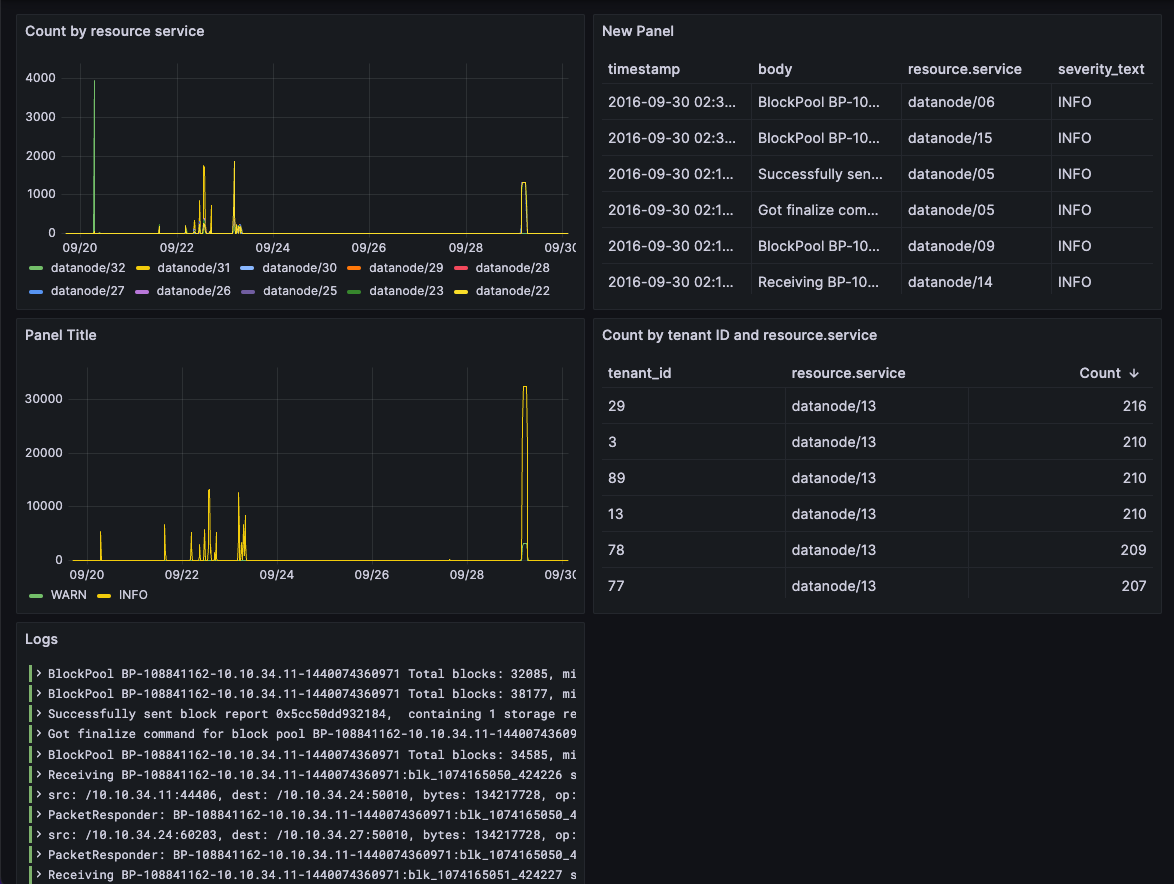
The Quickwit data source plugin allows you to query and visualize Quickwit data from within Grafana.
- Grafana 11.x Support
- Fixed Adhoc Filters: Improved adhoc filters feature for dynamic query building
- Enhanced Stability: Various bug fixes and improvements
It is available for installation directly from the Grafana catalog until version 0.4.5 or you can download the latest version and follow the installation guide.
We recommend Grafana v10.X or v11.X.
Quickwit 0.7 is compatible with 0.3.x versions only.
Quickwit 0.8 is compatible with 0.4.x and 0.5.x versions.
- v0.5.x (Latest): Grafana 11.x with improved adhoc filters
- v0.4.x: Grafana 10.x
- v0.3.x: Grafana 9.x / Quickwit 0.7
You can either download the plugin manually and unzip it into the plugin directory or use the env variable GF_INSTALL_PLUGINS to install it.
Run grafana container with the env variable:
docker run -p 3000:3000 -e GF_INSTALL_PLUGINS="https://github.com/quickwit-oss/quickwit-datasource/releases/download/v0.5.0/quickwit-quickwit-datasource-0.5.0.zip;quickwit-quickwit-datasource" grafana/grafana runOr download the plugin manually and start Grafana
wget https://github.com/quickwit-oss/quickwit-datasource/releases/download/v0.5.0/quickwit-quickwit-datasource-0.5.0.zip
mkdir -p plugins
unzip quickwit-quickwit-datasource-0.5.0.zip -d plugins/quickwit-quickwit-datasource-0.5.0
docker run -p 3000:3000 -e GF_PATHS_PLUGINS=/data/plugins -v ${PWD}/plugins:/data/plugins grafana/grafana runRun grafana-oss container with the env variable:
docker run -p 3000:3000 -e GF_INSTALL_PLUGINS="https://github.com/quickwit-oss/quickwit-datasource/releases/download/v0.4.6/quickwit-quickwit-datasource-0.4.6.zip;quickwit-quickwit-datasource" grafana/grafana-oss runOr download the plugin manually and start Grafana
wget https://github.com/quickwit-oss/quickwit-datasource/releases/download/v0.4.6/quickwit-quickwit-datasource-0.4.6.zip
mkdir -p plugins
unzip quickwit-quickwit-datasource-0.4.6.zip -d plugins/quickwit-quickwit-datasource-0.4.6
docker run -p 3000:3000 -e GF_PATHS_PLUGINS=/data/plugins -v ${PWD}/plugins:/data/plugins grafana/grafana-oss runRun grafana-oss container with the env variable:
docker run -p 3000:3000 -e GF_INSTALL_PLUGINS="https://github.com/quickwit-oss/quickwit-datasource/releases/download/v0.3.2/quickwit-quickwit-datasource-0.3.2.zip;quickwit-quickwit-datasource" grafana/grafana-oss runOr download the plugin manually and start Grafana
wget https://github.com/quickwit-oss/quickwit-datasource/releases/download/v0.3.2/quickwit-quickwit-datasource-0.3.2.zip
mkdir -p plugins
unzip quickwit-quickwit-datasource-0.3.2.zip -d plugins/quickwit-quickwit-datasource-0.3.2
docker run -p 3000:3000 -e GF_PATHS_PLUGINS=/data/plugins -v ${PWD}/plugins:/data/plugins grafana/grafana-oss runIf you are running a local Quickwit instance on Linux, add the --network=host argument to the docker run command. This will allow Grafana to access services on the host machine. You can later use http://localhost:7280/api/v1 in the Quickwit API URL when configuring the data source.
The default username and password are admin and admin.
You're all set!
For detailed instructions on how to install plugins on Grafana Cloud or locally, please check out the Plugin management docs.
To configure the Quickwit datasource, you need to provide the following information:
- The Quickwit API URL with the
/api/v1suffix. If you have a Quickwit local instance, set the host tohttp://host.docker.internal:7280/api/v1on macOS orhttp://localhost:7280/api/v1on Linux. - The index name.
- The log message field name (optional). This is the field displayed in the explorer view.
- The log level field name (optional). It must be a fast field.
Follow these instructions to add a new Quickwit data source, and enter configuration options.
apiVersion: 1

datasources:
  - name: Quickwit
    type: quickwit-quickwit-datasource
    url: http://localhost:7280/api/v1
    jsonData:
      index: 'hdfs-logs'
      logMessageField: body
logLevelField: severity_text- Explore view.
- Dashboard view.
- Template variables.
- Adhoc filters.
- Annotations
- Explore Log Context.
- Alerting.
If you’re sure your query is correct and the results are fetched, then you’re fine! The query linting feature is still quite rough around the edges and will improve in future versions of the plugin. If results are not fetched, make sure you are using a recent version of Quickwit, as some improvements have been made to the query parser.
This is probably due to a bug in Grafana up to versions 10.3, the next release of Grafana v10.4 should fix the issue.
This may be due to a limitation of the pagination scheme. In order to avoid querying data without controlling the size of the response, we set a limit on how many records to fetch per query. The pagination scheme then tries to fetch the next chunk of results based on the timestamps already collected and may skip some logs if there was more records with a given timestamp. To avoid that : try using timestamps with a finer resolution if possible, set the query limits higher or refine your query.
Details on our contributing guide.
This plugin is heavily inspired by the elasticsearch plugin available on the Grafana repository. First of all, huge thanks to the Grafana team for open-sourcing all their work.
It's more or less a fork of this plugin to adapt the code to Quickwit API. See LICENSING for details on the license and the changes made.
The license for this project is AGPL-3.0, and a notice was added to respect the Grafana Labs license.

