Over the years, Twitter has become a critical communication tool for responding to natural disasters.
In this project, the goal is to build Maching learning application that predicts which Tweets are about the real disaster and which ones aren't. Furthemore, I built the a MLOps systems, the objective is to streamline and automate the deployement, monitoring, maintenance ML models in production enviroments. The repository contains a Jupyter notebook, code source for modelling, as well as additional documentation and resources. The source data is mentioned here:
https://www.kaggle.com/competitions/nlp-getting-started
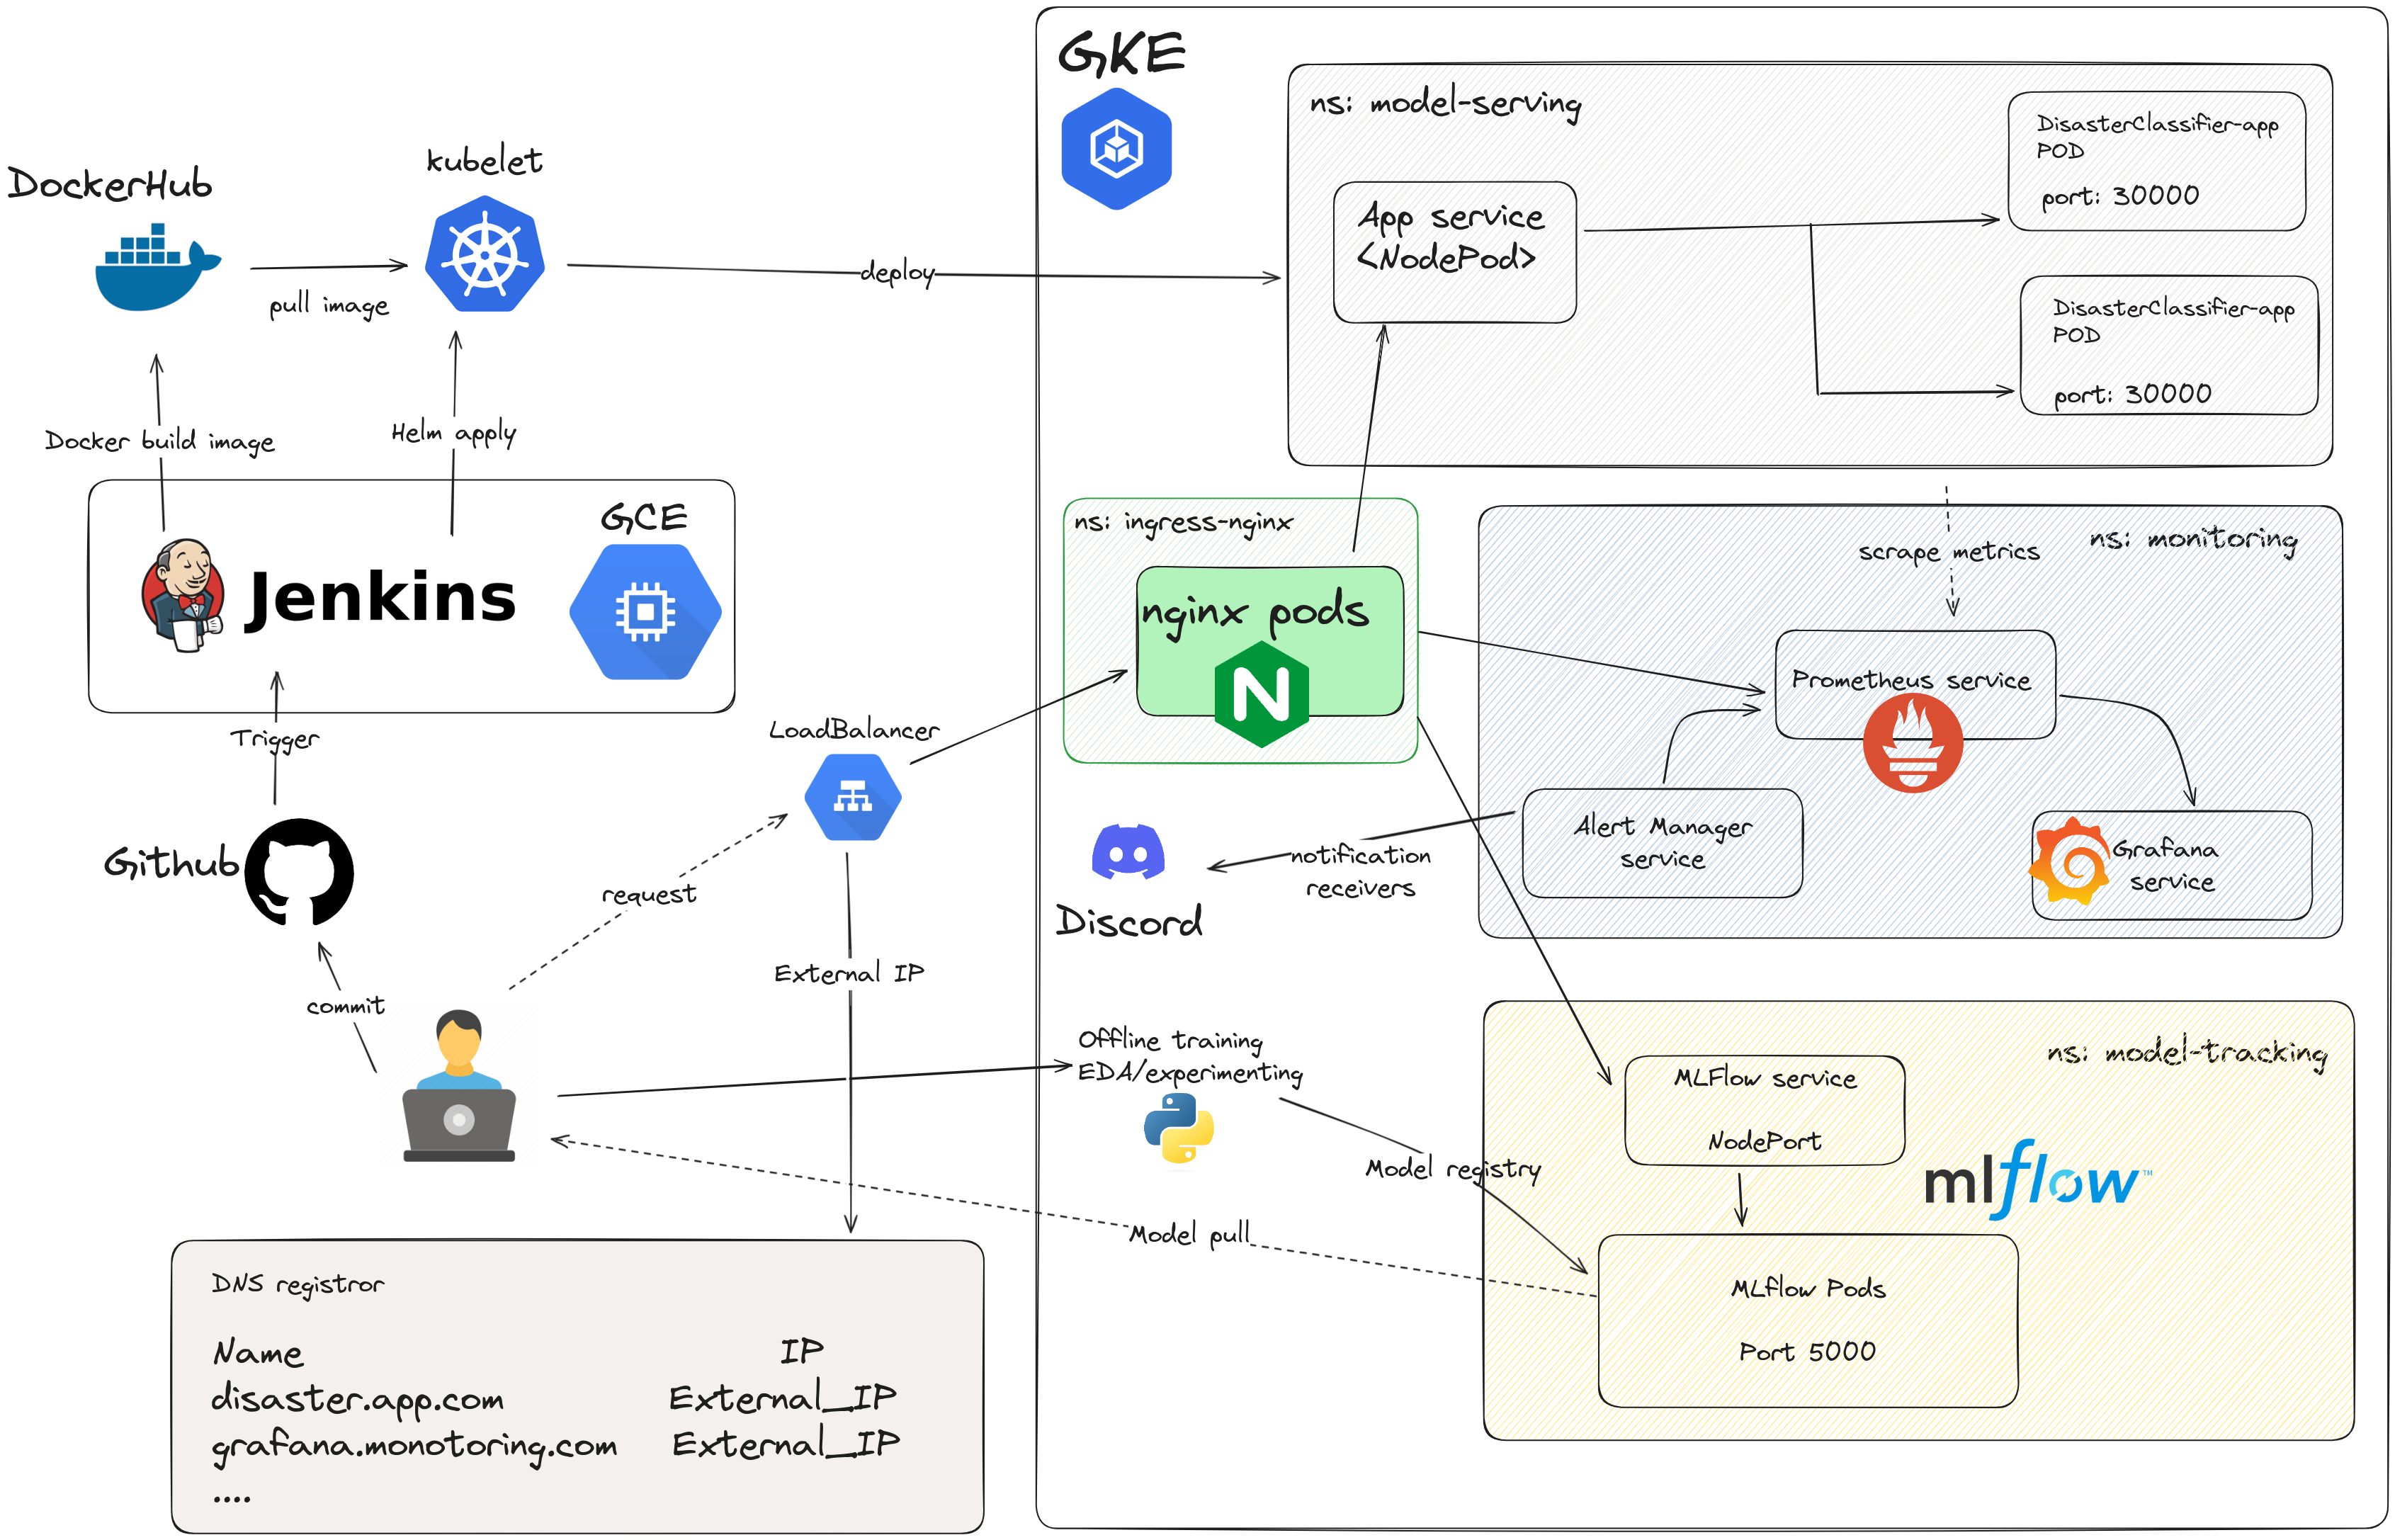
- Overal architecture
- Project structure
- Getting started
- On-premise deployment
- Cloud migration
- Demo
├── ansible                      # Ansible configurations for GCE
├── data                         # Storing data files
├── deployment                   # Deployment-related configurations
│   ├── jenkins                  # Jenkins deployment configurations
│   │   ├── build_jenkins_image.sh
│   │   ├── docker-compose.yaml
│   │   └── Dockerfile
│   ├── mlflow                   # MLflow deployment configurations
│   │   ├── build_mlflow_image.sh
│   │   ├── docker-compose.yaml
│   │   ├── Dockerfile
│   │   └── run_env                 # Environment for running MLflow
│   │       └── data                # Data directory for MLflow
│   │           └── mlflow.db       # MLflow SQLite database
│   └── model_predictor          #  App deployment configurations
│       ├── docker-compose.yaml
│       └── Dockerfile
├── helm                         # Helm charts for Kubernetes deployments
│   ├── disaster_chart           # Helm chart for app
│   ├── grafana-prometheus       # Helm chart for Grafana and Prometheus
│   ├── mlflow                   # Helm chart for MLflow deployment
│   └── nginx-ingress            # Helm chart for Nginx Ingress setup
├── Jenkinsfile                  # Jenkins pipeline configuration file
├── main.py                      # app fast api
├── Makefile
├── models                       # Folder for storing trained models
├── notebook                     # EDA
├── README.md
├── requirements.txt             # Python package dependencies
├── src                          # Source code directory
├── terraform                    # Terraform configurations for GKE
└── test # Folder for storing test scriptsTo get started with this project, we will need to do the following
Clone the repository to your local machine.
git clone git@github.com:quochungtran/NLP-with-Disaster-Tweets.git
Install all dependencies dedicated to the project
conda create -n nlp-with-disaster-tweets python=<python_version> # Here I used version 3.9.18
conda activate nlp-with-disaster-tweets
pip install -r requirements.txt
make mlflow_up- Process data
python src/text_preprocessing.py- Train model
python src/tfv_train.py --pre true --fold <fold number> --model <name_model_from_model_dispatcher>The fold number ranges from 1 to 5, corresponding to the partitions dedicated to testing data, created during k-fold cross-validation for splitting the training data.
- Register model at
http://localhost:5001to access to MLFLOW UI.
- Build and run the Docker image using the following command
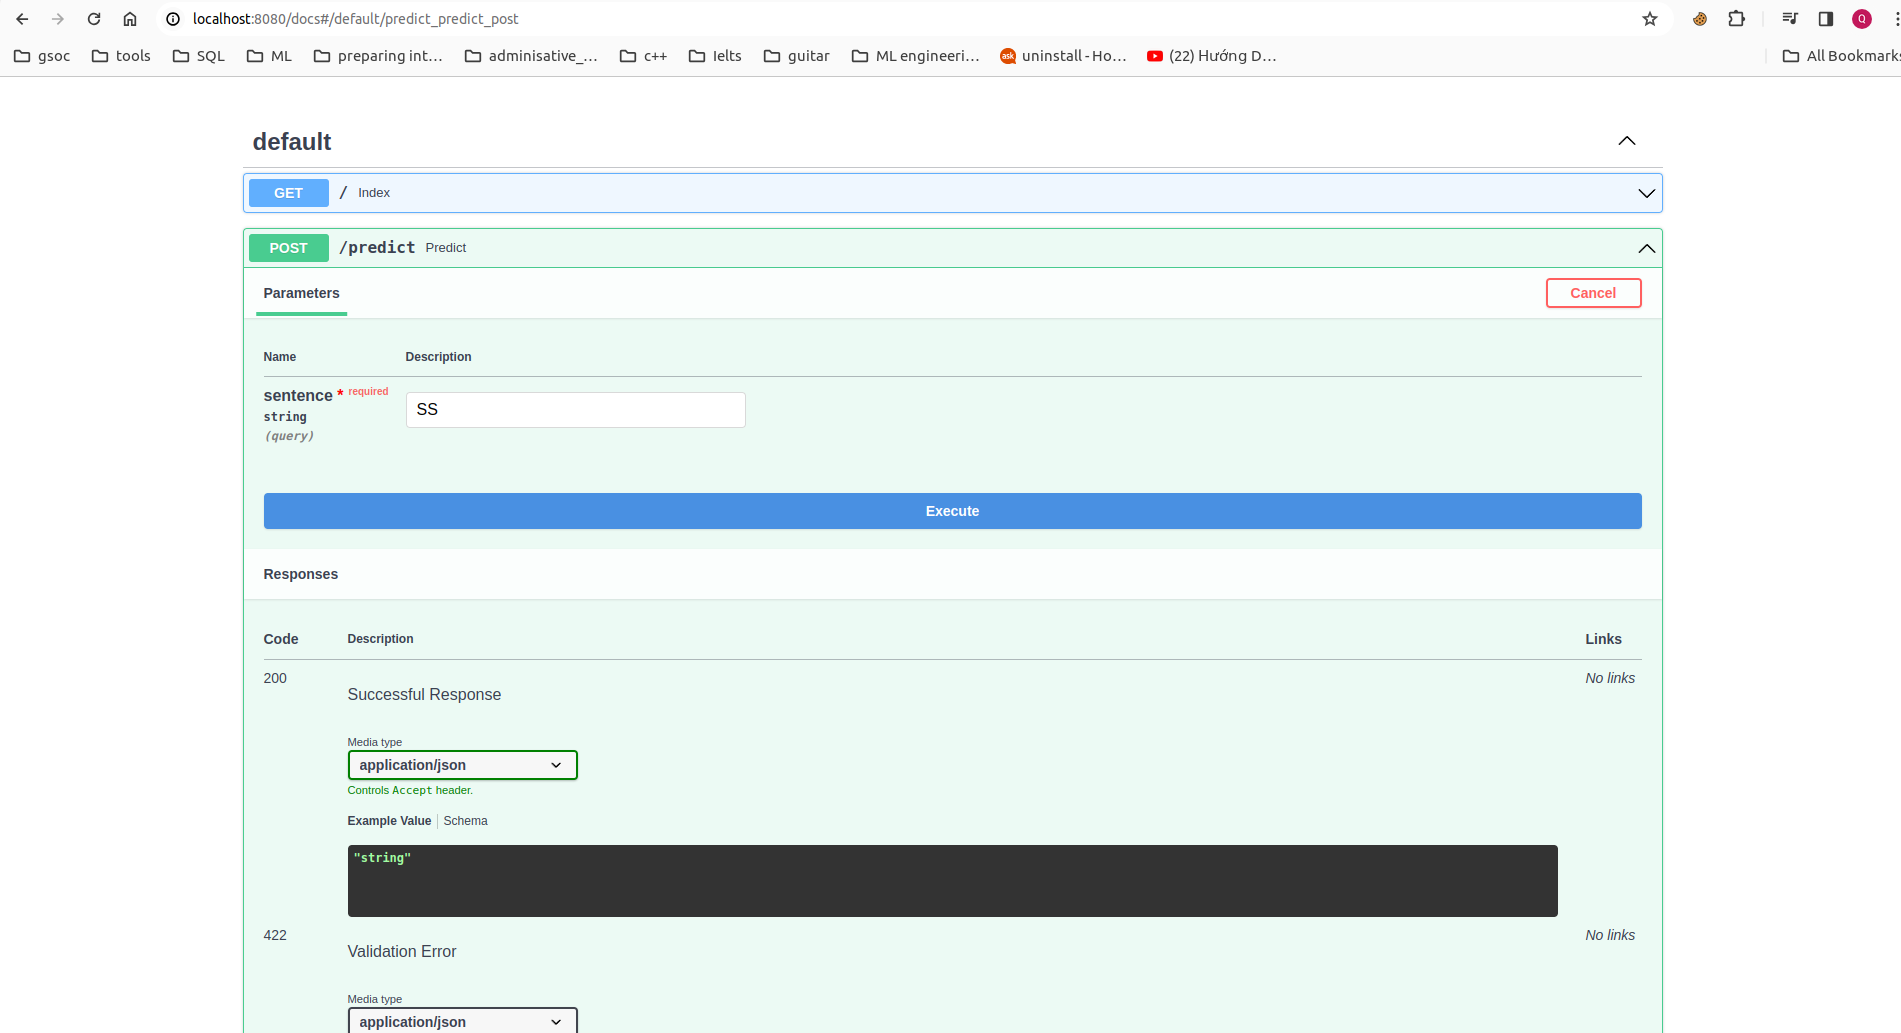
make app_local_upNavigating FastAPI deployement model using localhost:8080/docs on host machine
Deploying your ML application on-premises imposes various constraints and limitations, hindering scalability, flexibility and security as well. However, migrating your ML application to Google Cloud Platform (GCP) offers a strategic advantage, enabling to leverage scalable infrastructure, advanced analytics, and managed services tailored for machine learning workflows.
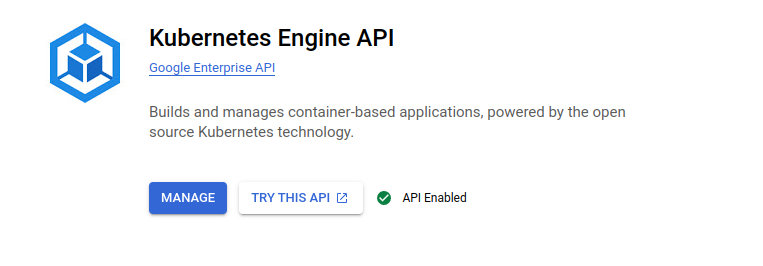
To migrate our application service to the cloud using Google Cloud Platform (GCP), we'll start by enabling the Kubernetes Engine API as shown below:
First we need to create a project in GCP
-
gclound CLI can be installed in the following document
-
Initialize gclound CLI, then type Y
gcloud init
Y-
A pop-up will prompt us to select your Google account. Select the account associated with your GCP registration and click
Allow. -
Go back to your terminal, in which you typed
gcloud init, type 1, and Enter. -
Then type Y, select the GCE zone corresponding to europe-west4-a (in my case), then Enter.
In the next step, we'll install the GKE Cloud Authentication Plugin for the gcloud CLI tool. This plugin facilitates authentication with GKE clusters using the gcloud cli.
We can install the plugin using the following command:
sudo apt-get install google-cloud-cli-gke-gcloud-auth-plugin
This command will install the necessary plugin for authenticating with GKE clusters.
Terraform is a powerful infrastructure as code tool that allows us to define and provision infrastructure in a declarative manner. It helps to facilitate to automate the creation, modification, and deletion of infrastructure resources across various cloud providers.
To provision a GKE cluster using Terraform, follow these steps:
- We should update the invidual project ID, the corresponding GKE zone and its node machine. In my case, a gke cluster will be deployed in zone
europe-west4-awith its node machine is:
cd terraform
terraform init  # Initialize Terraform in the directory
terraform plan  # Plan the configuration
terraform apply # Apply the configuration to create the GKE cluster- A created cluster will be pop up in GKE UI (after 8 to 10 minutes)
- connect to gke cluster using
gcloud cli
gcloud container clusters get-credentials mlops-415023-gke --zone europe-west4-a --project mlops-415023- To view your highlighted cluster ID in the terminal, you can use the
kubectxcommand.
Ensure that we have these tools to manage k8s cluster
What are kubectx and kubens?
- kubectx is a tool to switch between contexts (clusters) on kubectl faster.
- kubens is a tool to switch between Kubernetes namespaces (and configure them for kubectl) easily.
To install these tools, follow the instructions provided in the following section: https://github.com/ahmetb/kubectx#manual-installation-macos-and-linux.
In my case kubens and kubectl cli were saved in usr/local/bin/.
An Ingress controller is a specialized load balancer for k8s enviroment, which accept traffic from outside the k8s platform, and load balance it to application containers running inside the platform.
Deploy Nginx ingress controller in corresponding name space in following commands:
cd helm/nginx-ingress
kubectl create ns nginx-ingress # Create a K8s namespace nginx-ingress
kubens nginx-ingress            # switch the context to the newly created namespace 'nginx-ingress'
helm upgrade --install nginx-ingress-controller . # Deploy nginx Ingress
Verify if the pod running in the specified namespace nginx-ingress
kubectl get pods -n nginx-ingressI decided to deploy the FastAPI application container on GKE within the model-serving namespace. Two replicas will be created, corresponding to the two pods.
cd helm/disaster_chart
kubectl create ns model-serving
kubens model-serving
helm upgrade --install disaster-text-classifier .- Get IP address of nginx-ingress
kubectl get ing- Add the domain name
disaster.classify.comof this IP to/etc/hostswhere the hostnames are mapped to IP addresses.
Alternatively, you can utilize the wildcard DNS service provided by *.nip.io, eliminating the need to manually edit the /etc/hosts file. This service allows you to access your service using a domain name based on the IP address. For example, if your IP address is 192.168.1.100, you can access your service using 192-168-1-100.nip.io.
sudo nano /etc/hosts
[INGRESS_IP_ADDRESS] disaster.classify.comRather than manually accessing the MLFlow server to keep track of experiments and models in local machine, we can facilitate collaboration by sharing artifacts with stakeholders in other locations. This can be achieved by deploying MLFlow on the cloud within the model-tracking namespace.
cd helm/model_tracking
kubectl create ns model-tracking
kubens model-tracking
helm upgrade --install model-tracking .- Add the domain name
mlflow.classify.comof this IP to/etc/hostswhere the hostnames are mapped to IP addresses.
sudo nano /etc/hosts
[INGRESS_IP_ADDRESS] mlflow.tracking.comcd helm/grafana-prometheus/kube-prometheus-stack/
kubectl create ns monitoring
kubens monitoring
helm upgrade --install kube-grafana-prometheus .- Check if pods are running within a namespace in Kubernetes, you can use the kubectl in monitoring namespace:
kubectl get pods -n monitoring- Add all the services of this external IP to
/etc/hosts, including:
sudo nano /etc/hosts
[INGRESS_IP_ADDRESS]  grafana.monitoring.com
[INGRESS_IP_ADDRESS]  promeutheus.monitoring.com
[INGRESS_IP_ADDRESS]  alertmanager.monitoring.com
To get grafana credentails, you could launch the following command to access the enviroment variable from the container, for example:
kubectl exec kube-grafana-prometheus-d5c9d4696-z6487 -- env | grep ADMINWhen I describe the pod, it states the ENV variable will be set from the secret:
Environment:
    GF_SECURITY_ADMIN_USER:      <set to the key 'admin-user' in secret 'kube-prometheus-stack-grafana'>      Optional: false
GF_SECURITY_ADMIN_PASSWORD: <set to the key 'admin-password' in secret 'kube-prometheus-stack-grafana'> Optional: falseNow, we would like to set up a CI/CD with Jenkins on Google Compute Engine(GCE), the objective is to establish a streamlined and automated process for Continuous Delivery of Machine Learning application.
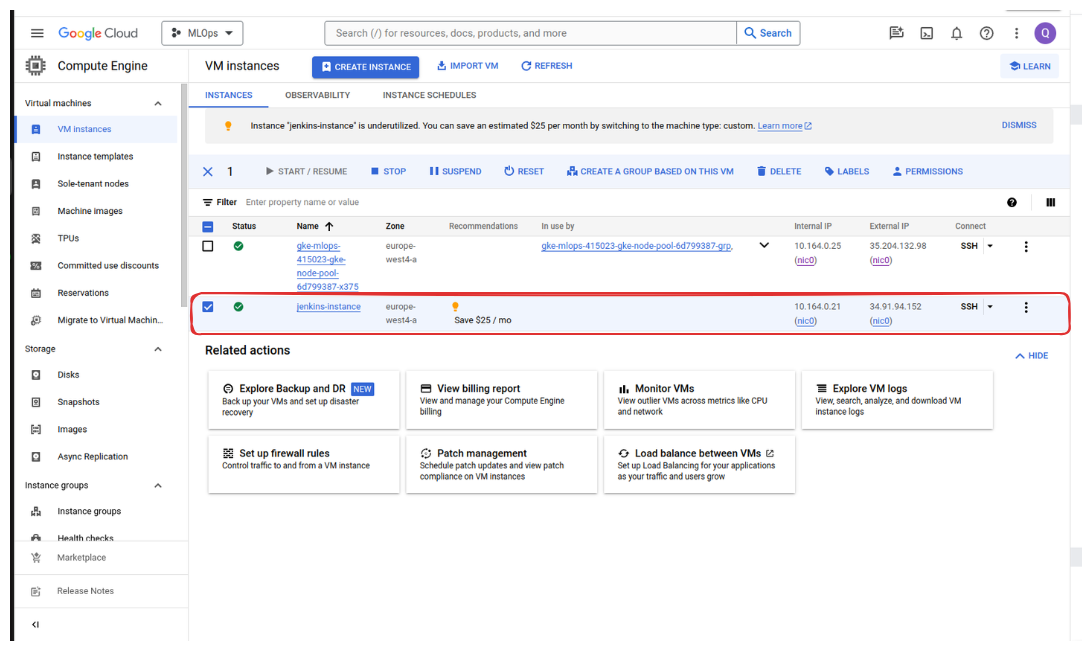
We use Ansible to define and deploy the infrastructure such as virutal machine to deploy Jenkins on GCE.
Access to Service accounts and select Compute Admin role (Full control of all Compute Engine resources) for your account.
Generate and download new key as json file. Remind that we need to keeps this file safely. Put your credentials in the folder ansible/secrets, which is used to connect GCE.
We should update project ID and service_account_file in ansible/deploy_jenkins/create_compute_instance.yaml.
- Execute the playbook to create the Compute Engine instance:
cd ansible/playbook_with_jenkins
ansible-playbook create_compute_instance.yamlDeploy our custom Jenkins (which use custom image from the folder deployment/jenkins) in following steps:
- Update the external IP of newly created instance to
inventoryfile.
cd ansible/playbook_with_jenkins
ansible-playbook -i ../inventory deploy_jenkins.yml- Access to the instance via ssh command in terminal :
ssh user_name@external_IP-
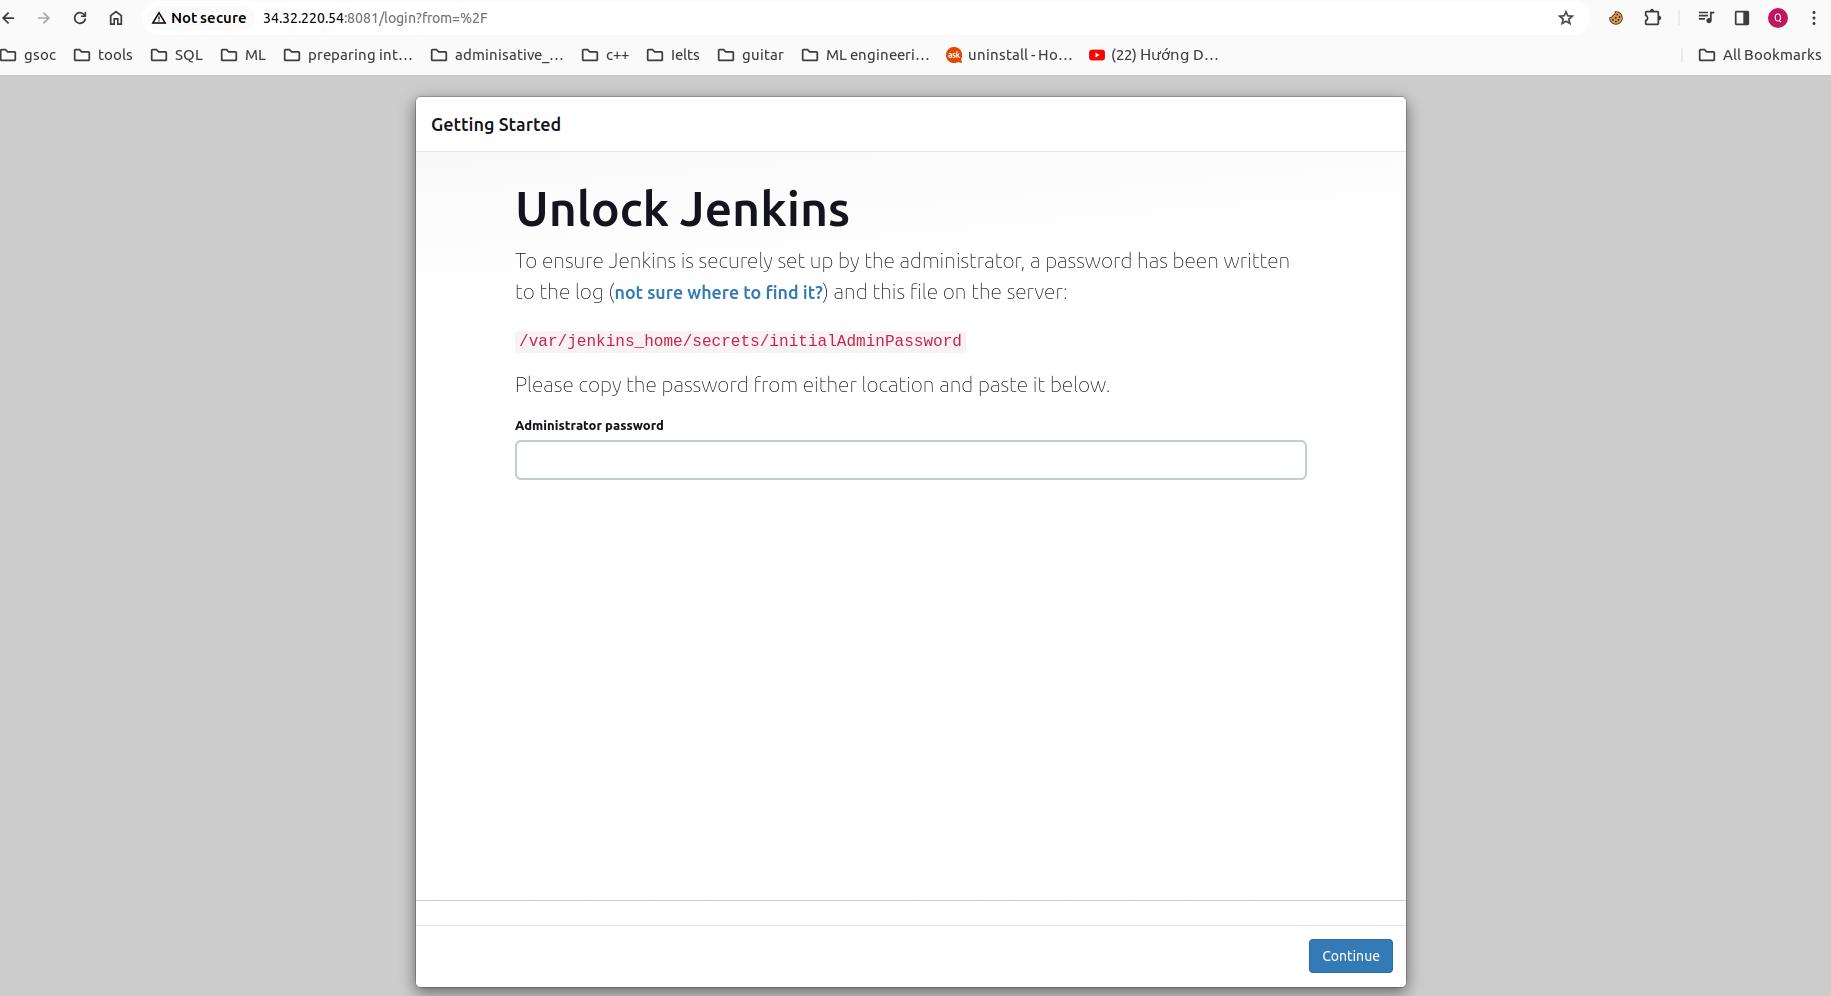
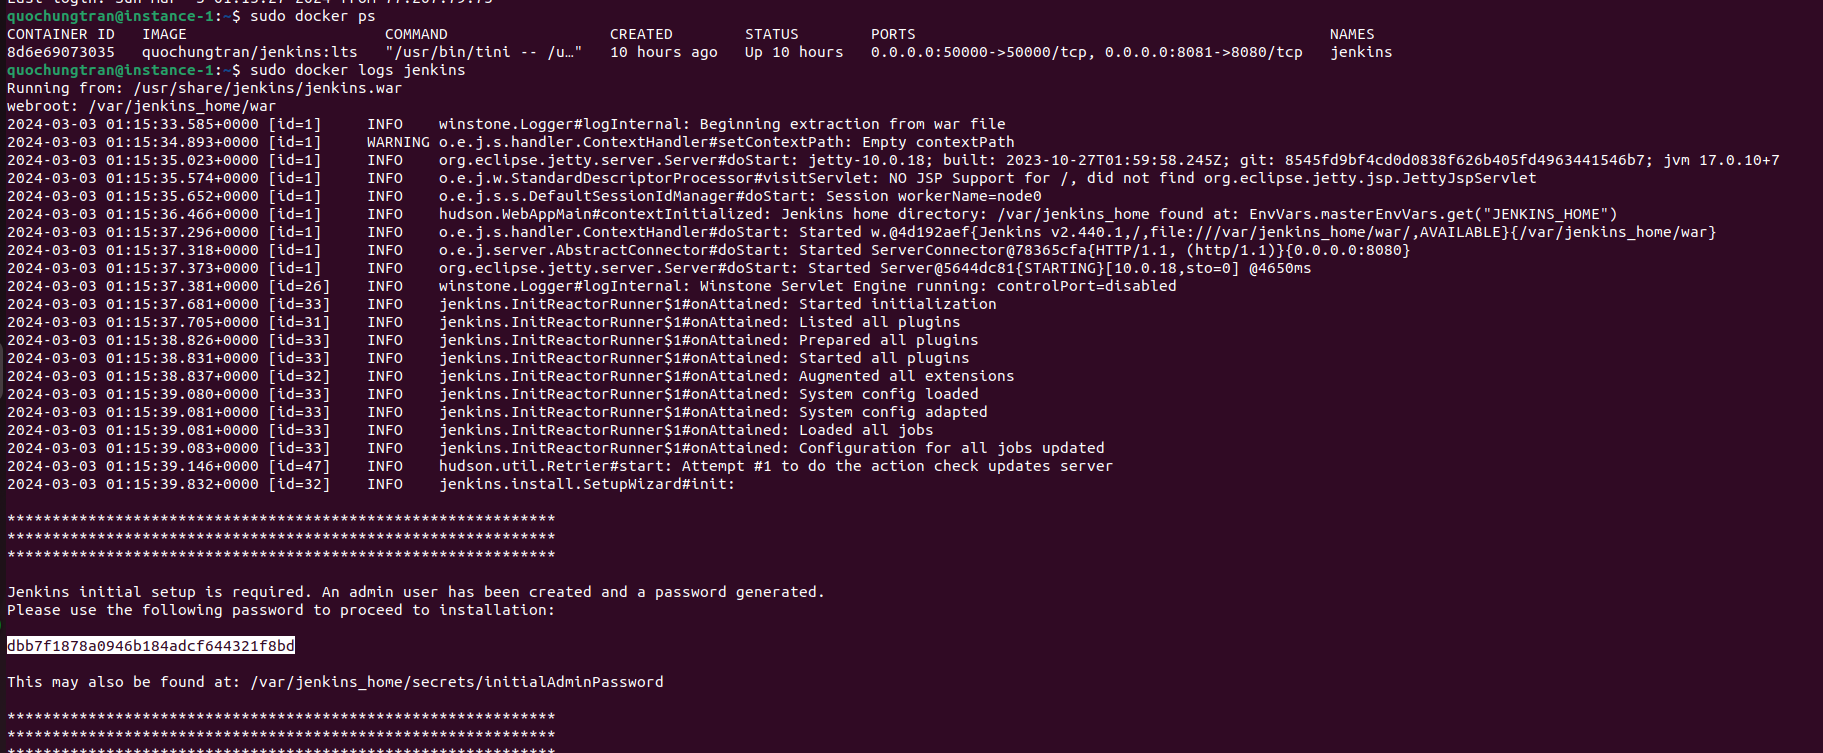
For unlock Jenkins, copy password from terminal and paste into web browser:
sudo docker ps # check if the Jenkins container is running
sudo docker logs jenkins- Type
skip and continue as adminandsave and Continue. So to log in, I use the usernameadminas the the username.
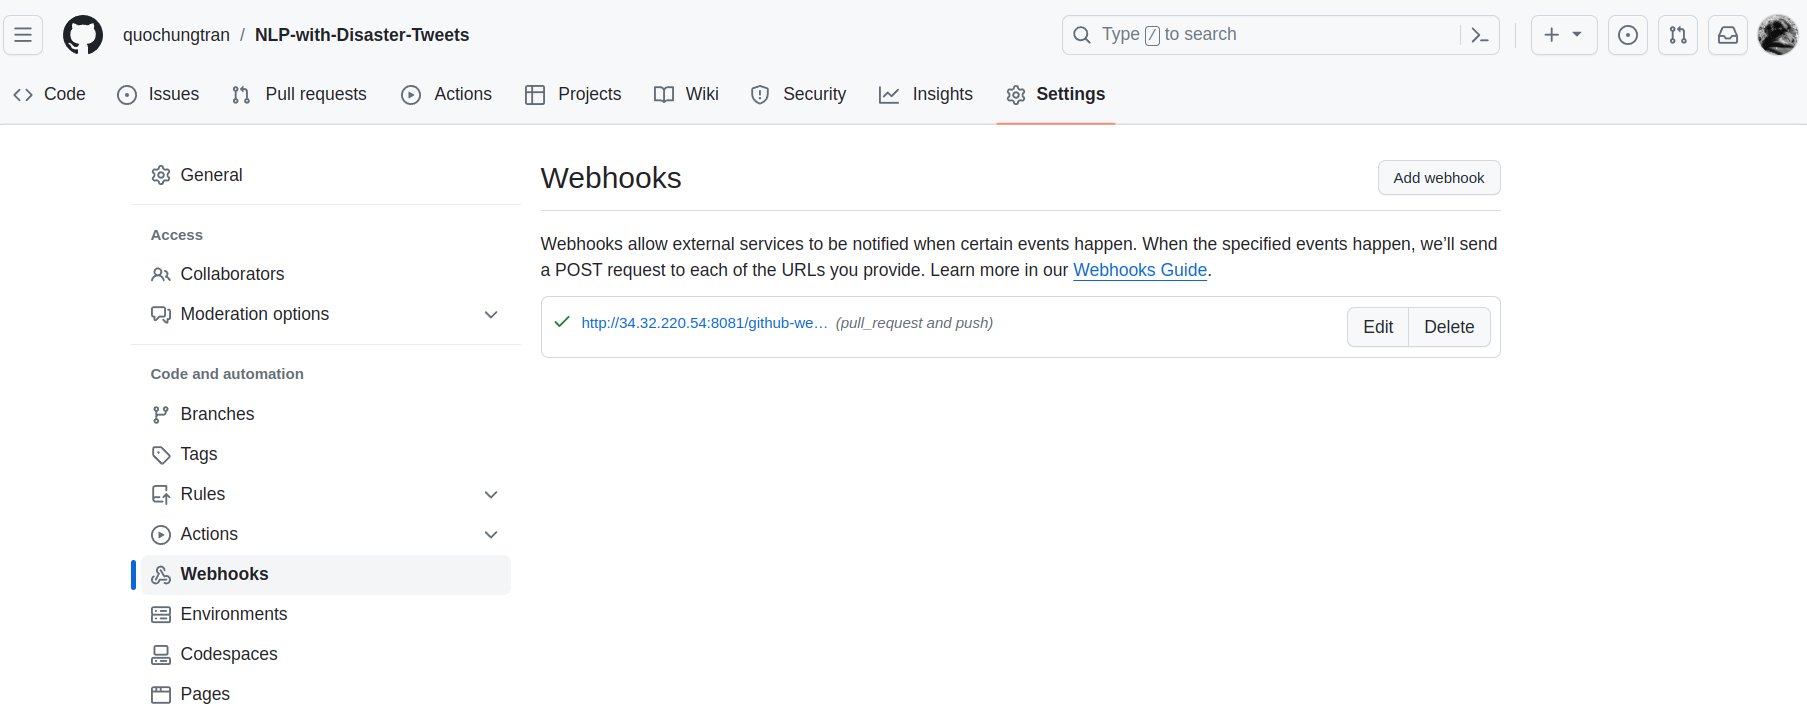
- Add Jenkins url to webhooks in github repo:
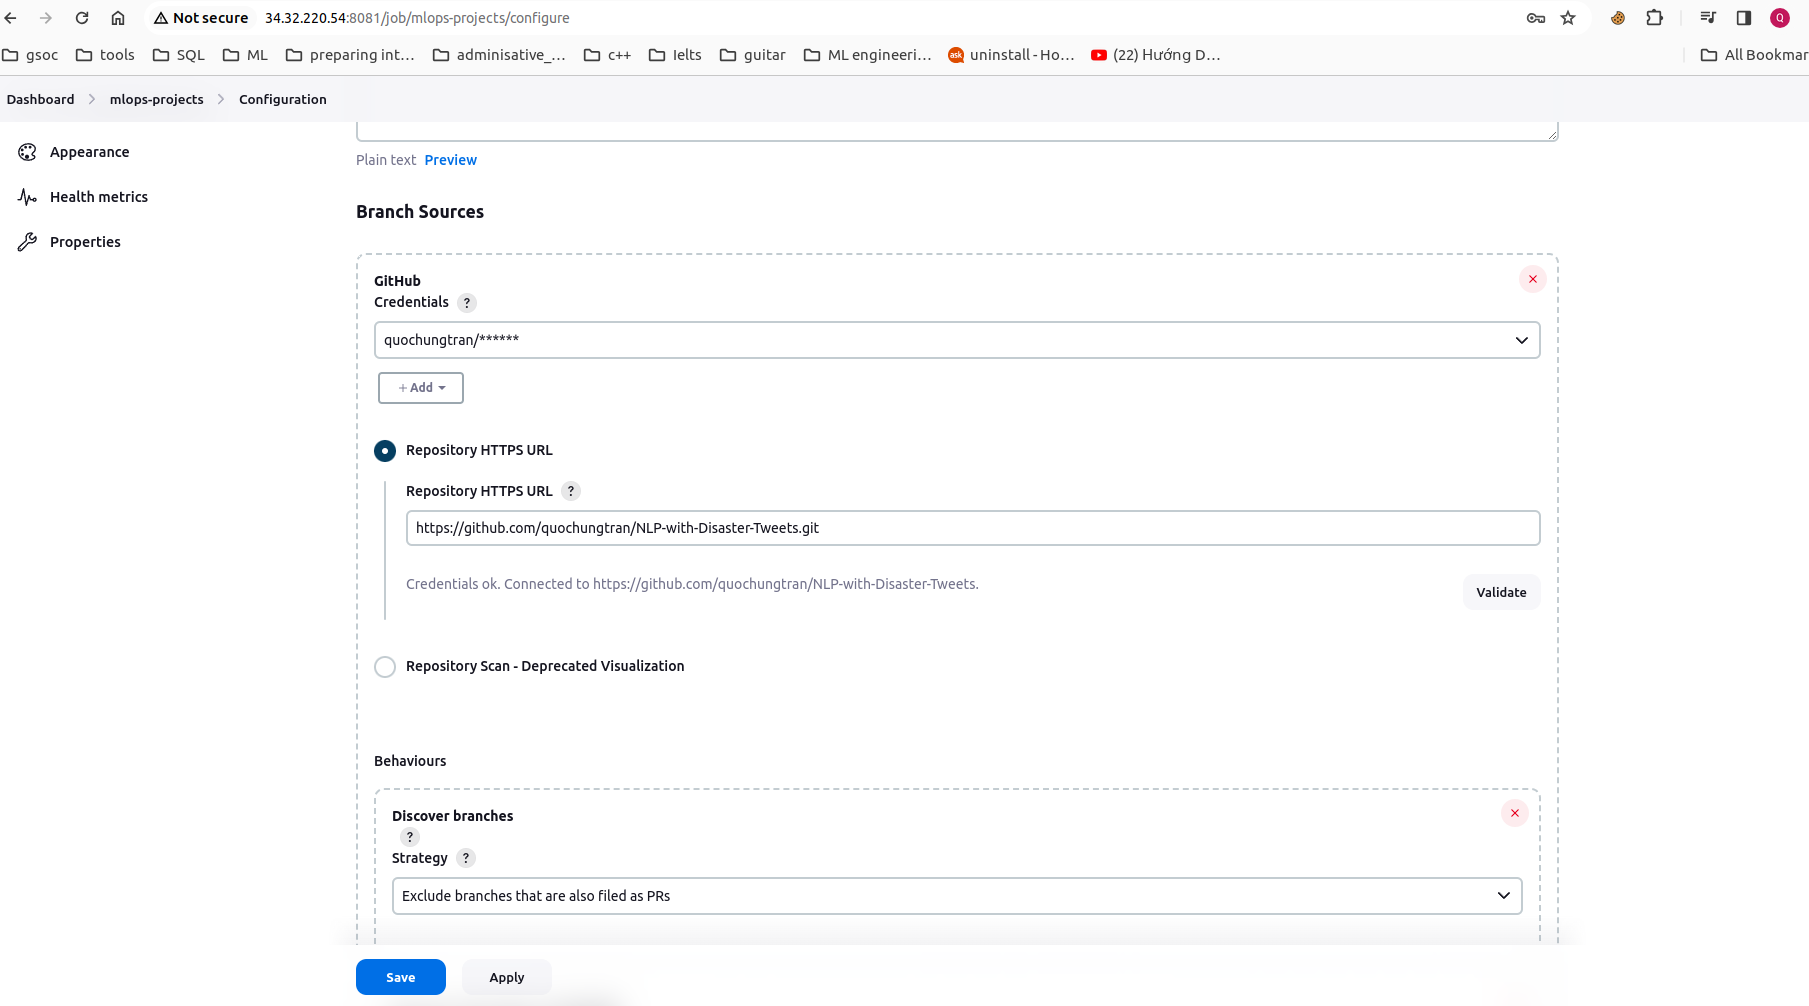
- Configure the github credentials for connecting to Jenkins and then integrate additional DockerHub credentials into Jenkins to enable image registration. These credentials are allowed to access in github project.
- Install the Kurbenestes, Docker, DockerPipeline, GCLOUD SDK plugins at
Manage Jenkins/Pluginsthen restart jenkins after complete installation
sudo docker restart jenkinsAdd the cluster certificate key at Manage Jenkins/Clouds. Be ensure that Kurbenestes plugins has been installed.
Don't forget to grant permissions to the service account which is trying to connect to our cluster by the following command:
kubectl create clusterrolebinding model-serving-admin-binding \
  --clusterrole=admin \
  --serviceaccount=modelmesh-serving:default \
  --namespace=modelmesh-serving

kubectl create clusterrolebinding anonymous-admin-binding \
  --clusterrole=admin \
  --user=system:anonymous \
--namespace=modelmesh-servingThe CI/CD pipleine consist the three stages:
- Test model correctness, unit test cases dedicated to source code.
- Building the application image, and register it into DockerHub.
- Deploy the application with latest image from DockerHub to GKE cluster.
An overview of success build pipeline in jenkins:
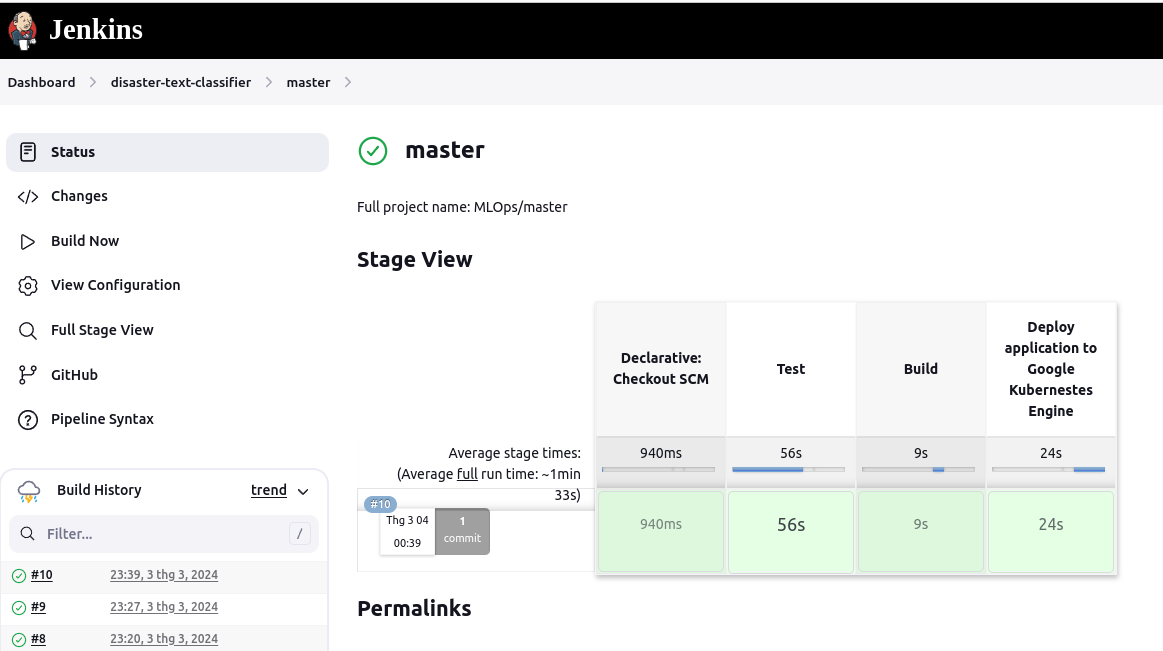
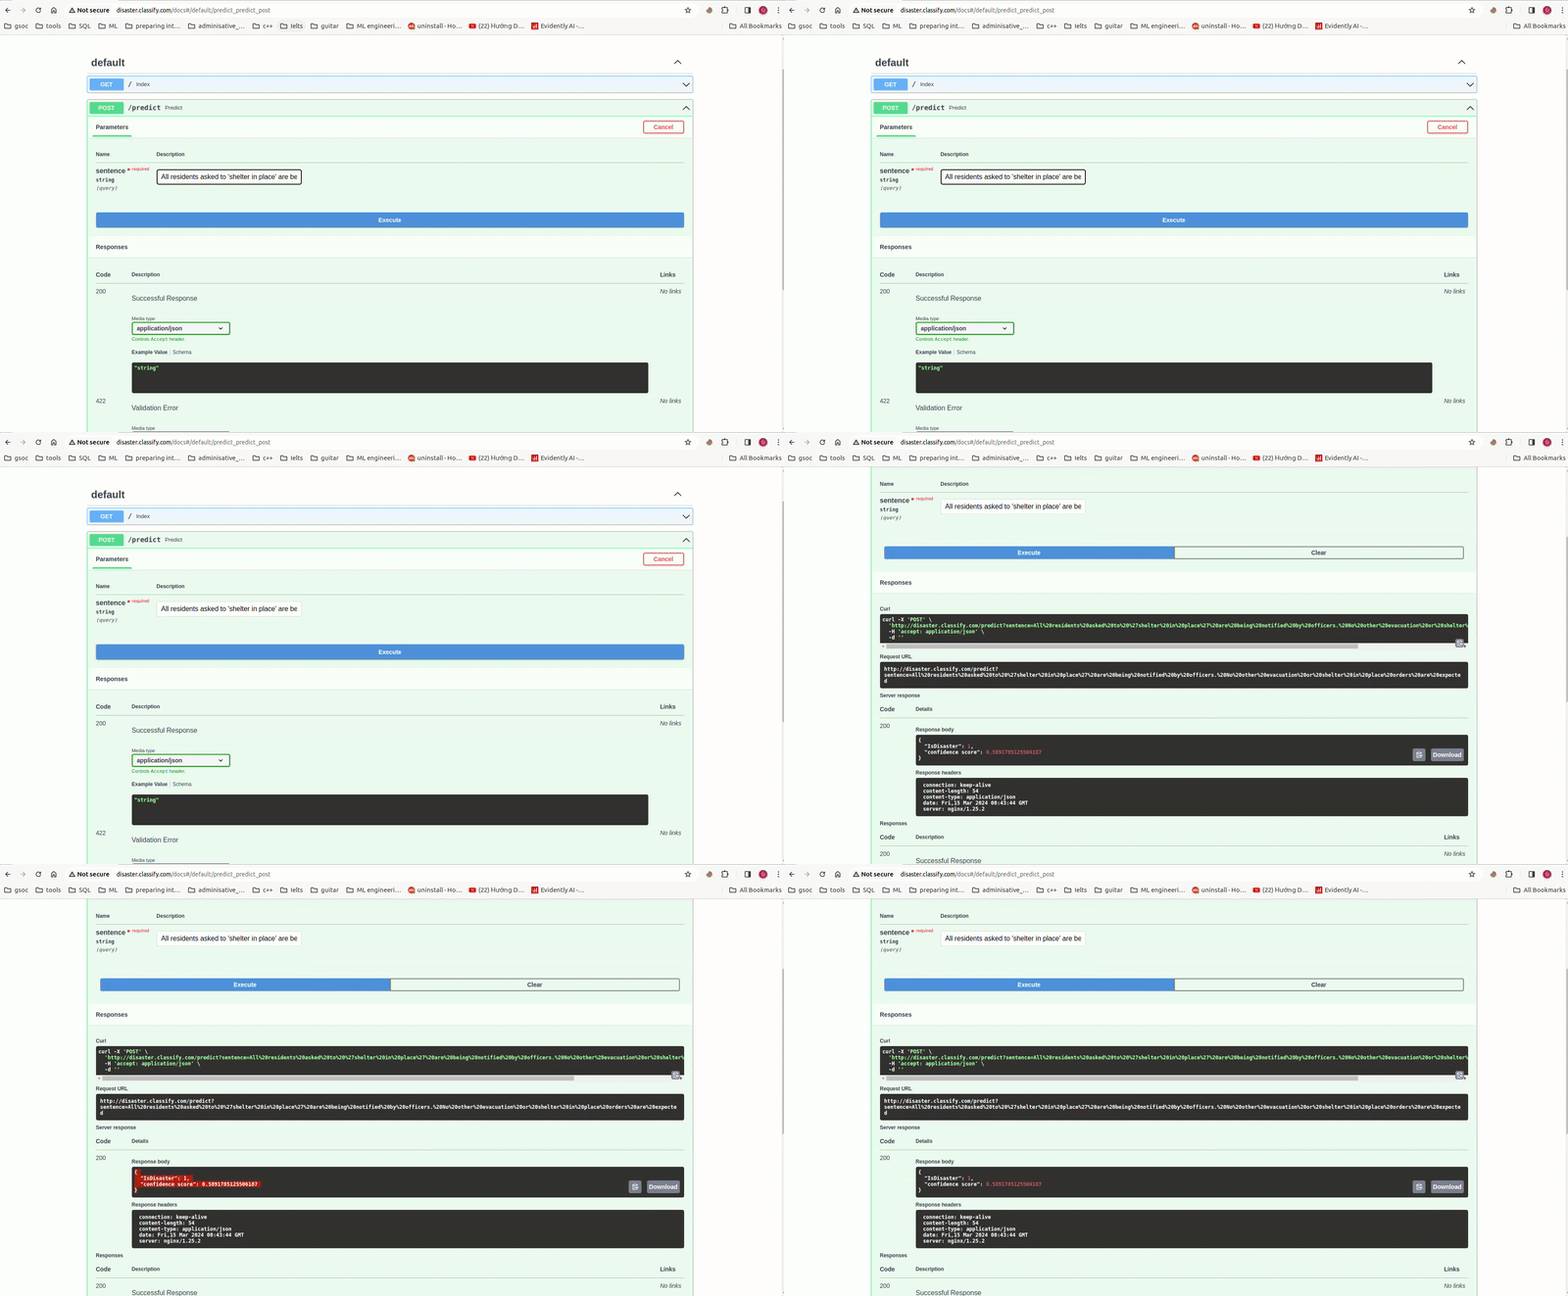
To explore the Disaster classification API, you can access http://disaster.classify.com/docs. This endpoint provides a comprehensive overview of the API's functionality, allowing you to test its capabilities effortlessly.
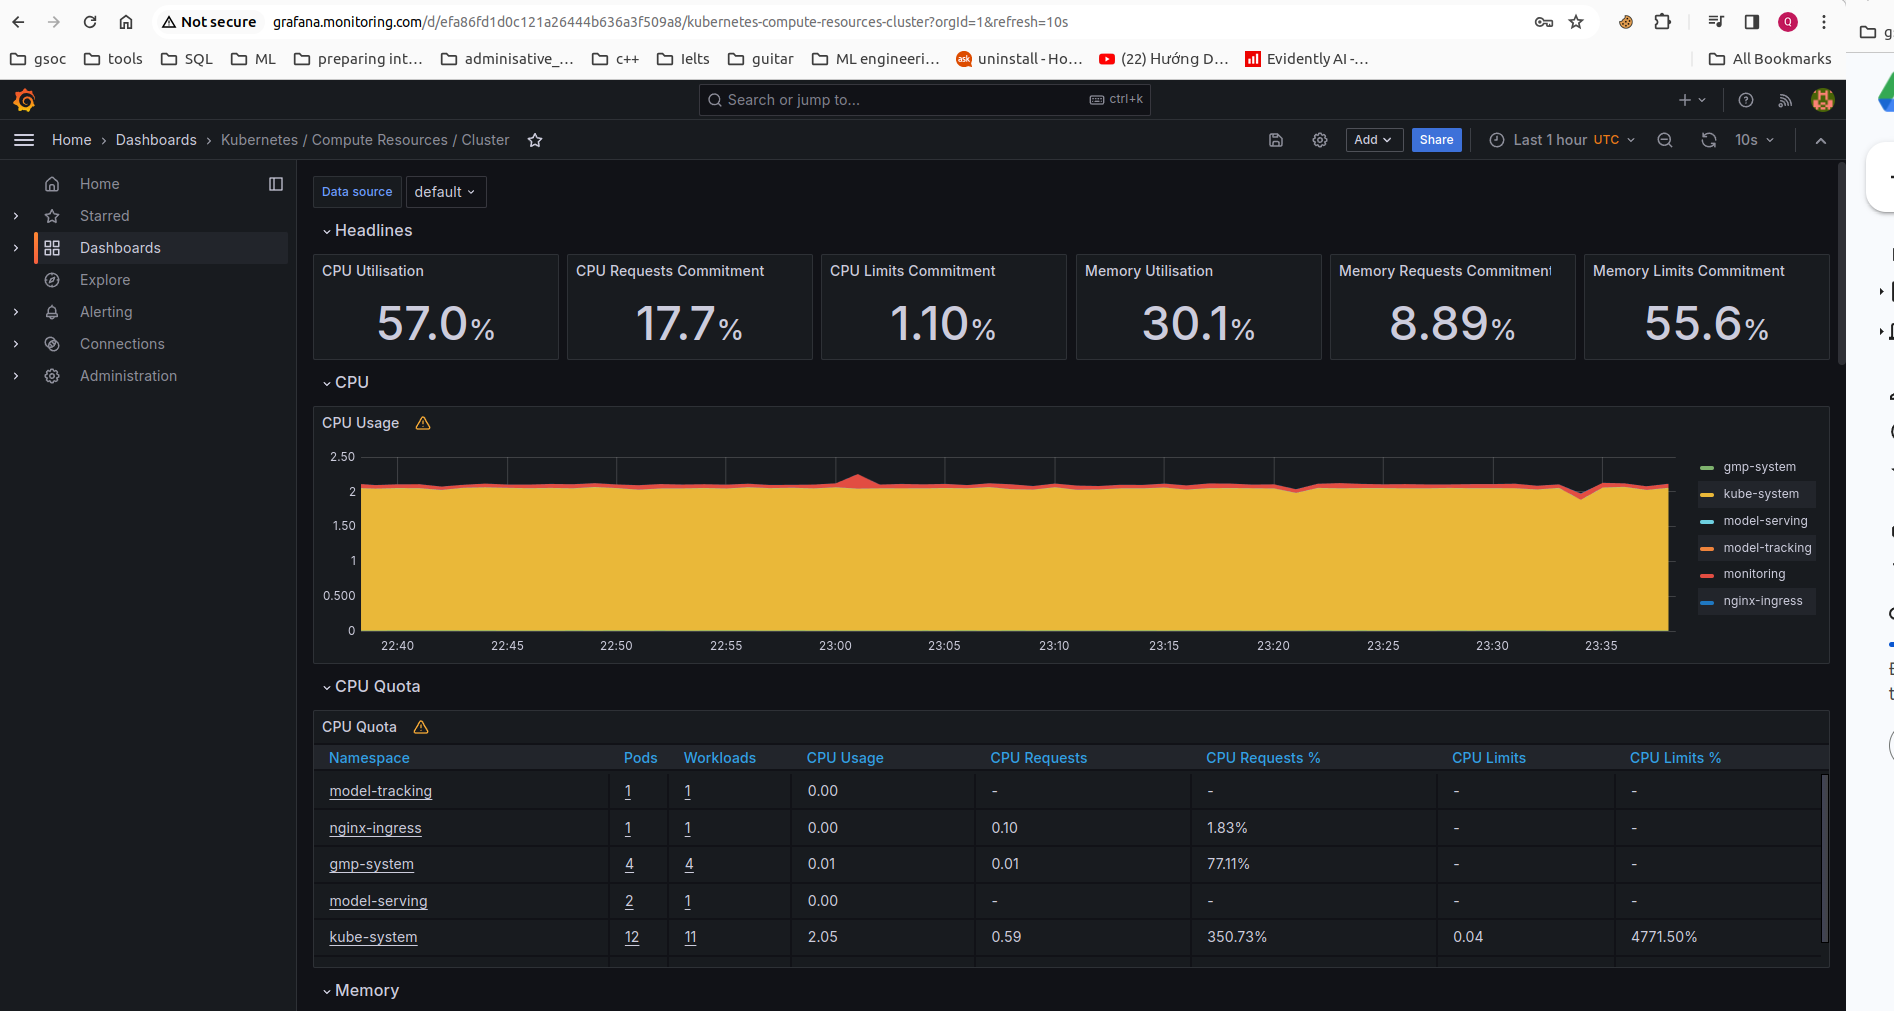
For monitoring the resource quotas across namespaces within our Kubernetes cluster, Grafana provides an intuitive interface accessible via grafana.monitoring.com. This dashboard offers insights into resource utilization, including CPU, memory, and more, for each pod within the cluster.
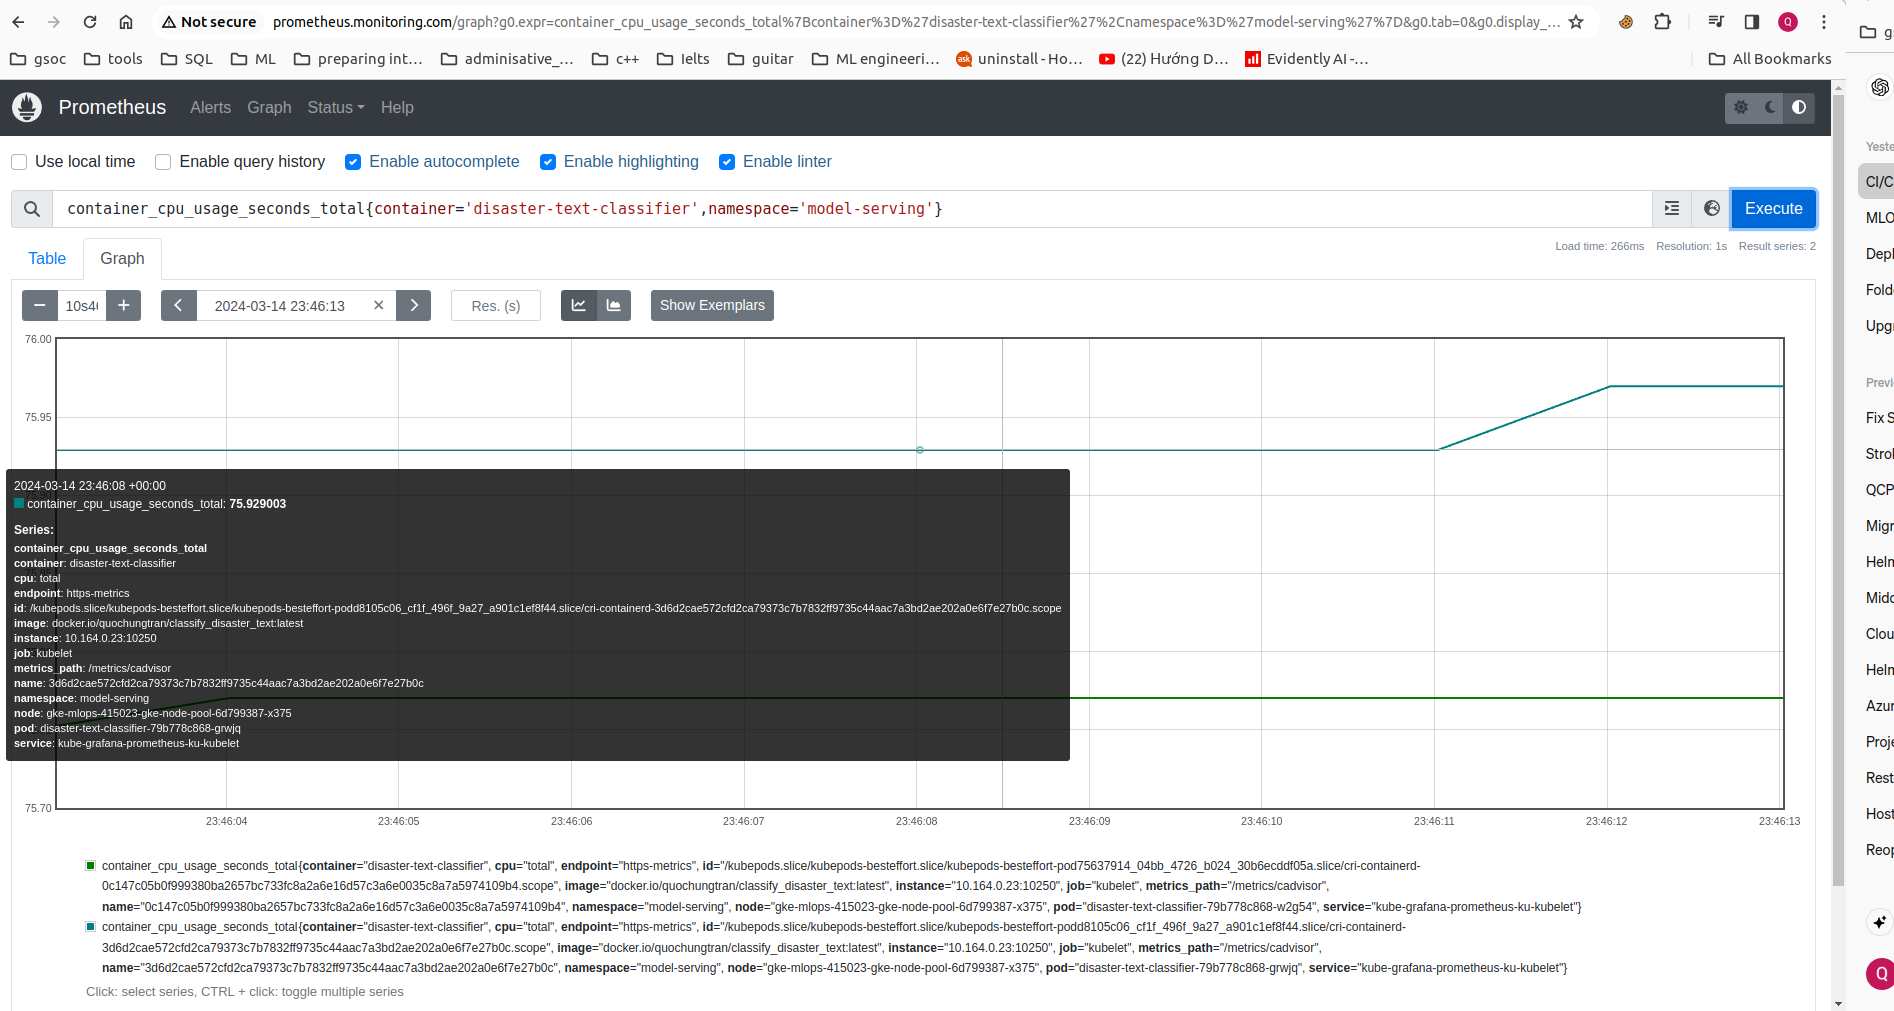
Moreover, we've implemented a custom dashboard in Grafana to monitor specific resource metrics, such as CPU usage, for pods within the model-serving namespace. This provides targeted insights into the performance of critical components within our infrastructure.
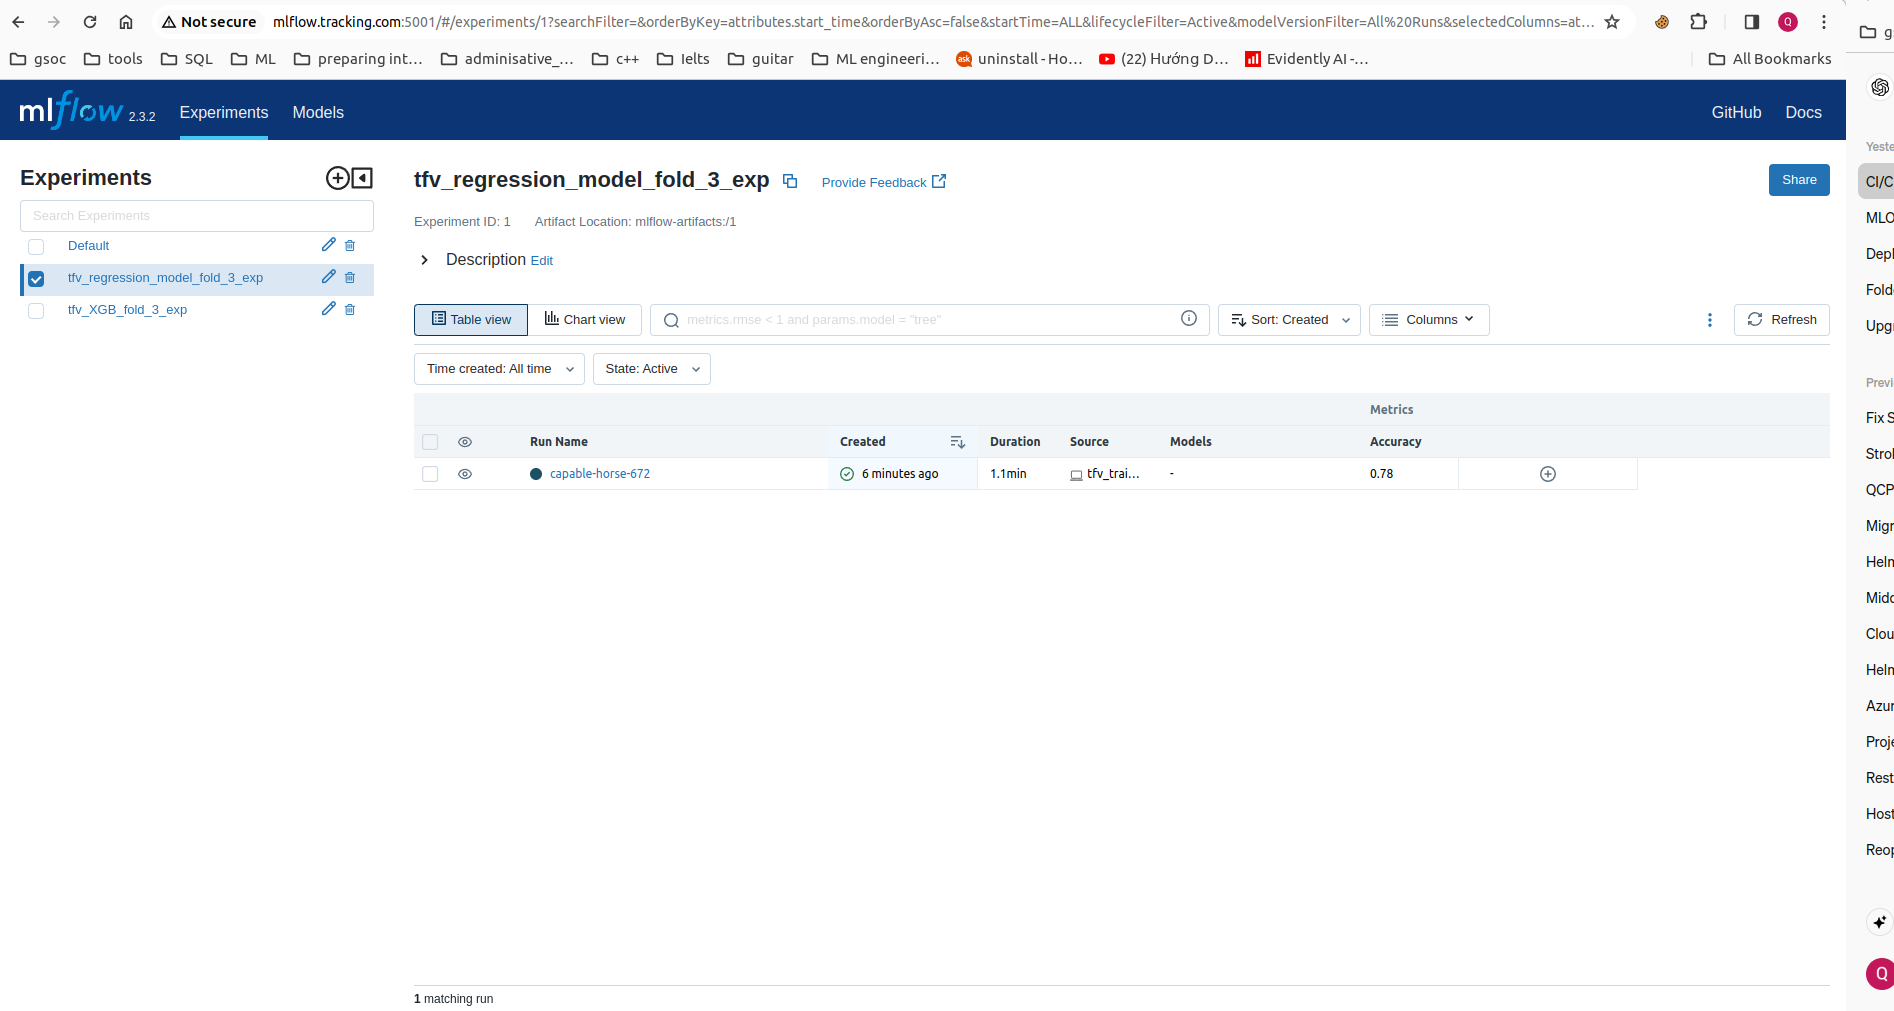
In addition to infrastructure monitoring, a model tracking service is provided accessibly via http://mlflow.tracking.com:5001. This platform allows us to efficiently manage and track model artifacts, performance metrics, dataset sizes, and other relevant information, providing valuable insights into model inference processes.
- Add new model/experiments, redesign the code base.
- Apply nginx controller routing to mlflow.
- Add dashboard monitor model.
