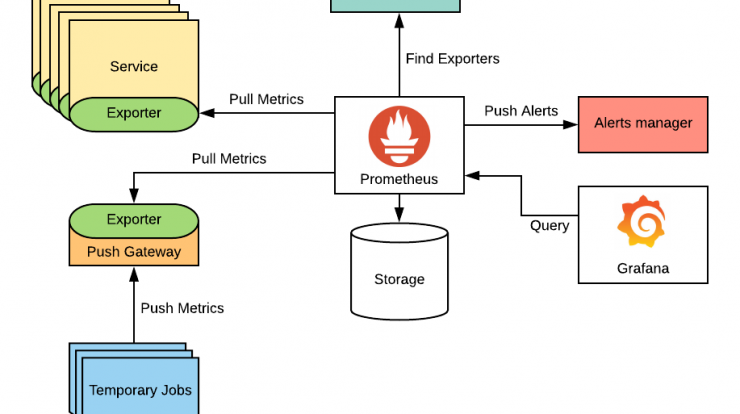
In Prometheus architecture, with each machine that needs to be monitored we install the several exporters depend on what we want to monitor (Learn more at: https://prometheus.io/docs/instrumenting/exporters/)
The exporters launch as an API service & Prometheus server pulls the metrics from exporters (described on the diagram). So to build a monitoring system with Prometheus, the first we need to run the exporters on each machines.
All components have been defined on docker compose file. Before run the docker containers, we need to configure some things.
Learn more about exporters: https://prometheus.io/docs/instrumenting/exporters/
For easy install, we run exporter as docker containers. Examples:
DCGM Exporter for NVIDIA GPU monitoring metrics
sudo docker run -d --restart unless-stopped --gpus all -p 9400:9400 nvcr.io/nvidia/k8s/dcgm-exporter:2.3.1-2.6.1-ubuntu20.04
NVIDIA Exporter for NVIDIA GPU monitoring metrics
sudo docker run -d --name nvidia_smi_exporter --restart unless-stopped --device /dev/nvidiactl:/dev/nvidiactl --device /dev/nvidia0:/dev/nvidia0 --device /dev/nvidia1:/dev/nvidia1 --device /dev/nvidia2:/dev/nvidia2 --device /dev/nvidia3:/dev/nvidia3 --device /dev/nvidia4:/dev/nvidia4 --device /dev/nvidia5:/dev/nvidia5 --device /dev/nvidia6:/dev/nvidia6 --device /dev/nvidia7:/dev/nvidia7 -v /usr/lib/x86_64-linux-gnu/libnvidia-ml.so:/usr/lib/x86_64
Node exporter for system monitoring metrics
sudo docker run -d --net="host" --pid="host" -v "/:/host:ro,rslave" quay.io/prometheus/node-exporter:latest --path.rootfs=/host
Or run using docker-compose file on ./exporters/docker-compose.yaml
cd exporters
docker-compose -f docker-compose.yaml up -d
Each exporter service will run as an API server
To edit configurations for Prometheus server, edit the file ./prometheus/prometheus.yml
Add the exporter configurations on the scrape_configs. Example:
scrape_configs:
  - job_name: 'dcgm-exporter'
    scrape_interval: 5s
    static_configs:
      - targets: ['10.124.64.125:9400'] #exporter address
Configuration of alertmanager:
# Alertmanager configuration
alerting:
  alertmanagers:
    - static_configs:
        - targets:
            - 10.124.69.101:9093 #alertmanager server address
Alertmanager is a pool of alerts in that the Prometheus server will push the alert events to and prom2teams act as a bridge between alertmanager and Microsoft Teams
On ./docker-compose.yaml file add the PROM2TEAMS_CONNECTOR = <MS_Team_webhook_URL> environment variable on prom2teams service so that prom2teams can identify the channel to send notifications.
On ./alertmanager/config.yml notice the webhook_configs in which we set the prom2teams server address.
Run containers using docker-compose
docker-compose -f docker-compose.yaml up -d