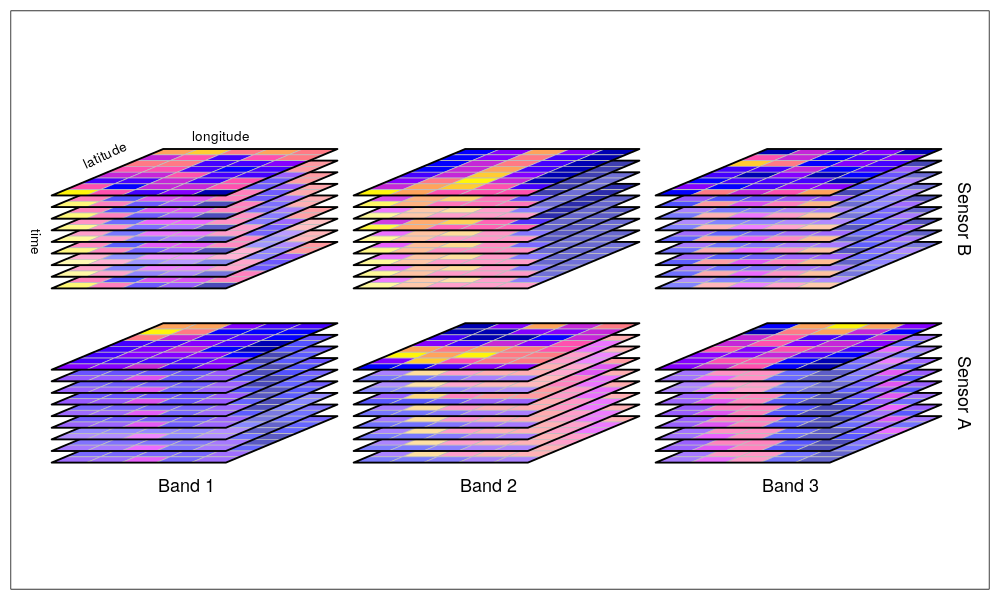
Create a spatial raster data cube figure
Closed this issue · 7 comments
It would be great to create a figure similar to the one below from https://r-spatial.github.io/stars/, but using tmap.
@mtennekes do you have any idea if this can be done programmatically?
I would actually use basic grid graphics, similar to https://github.com/r-tmap/tmap-book/blob/master/code/crs_examples.R#L333-L355. Once we have a function plots one layer (which should be fairly easy), it is easy to draw stacked layers.
If you really want to use tmap for that, I would first create sheared stars objects, and shift them apart from each other.
Hi @mtennekes, my answer here and for the two related issues (#6 and #4) is the same -- I would be great if you could make a start with these figures.
I think that having all of the figures in the tmap book actually made in R would be a great achievement.
@mtennekes it is great!
I am thinking about simplifying this figure for the book: use the first row only and replace "Band" with "Attribute".
Thanks!
Yes, that makes sense. To me the difference between bands and attributes in a stars object is just how the data is structured. However, in 99% of the cases, a stars object either consists of multiple attributes or multiple bands.
I'll update the figure.
Done
Great!

