Power IQ® DCIM Monitoring Software enables data center and facility managers to closely monitor and efficiently utilize their existing data center power infrastructure. This script extract this data from an API and places it into an influxDB.
-
Obtain the API URL in which your PowerIQ PDU use
-
You will also need to obtain the API Authentication token. Typically, this should be Basic Authentication
-
Download the python script which you require, either single or dual pdu's. The scripts are based on being placed in a rack, so typically it will be the dual pdu script you will need. This script also provides the kilowatt total in the rack, in case you are charged by this from your DC operator.
-
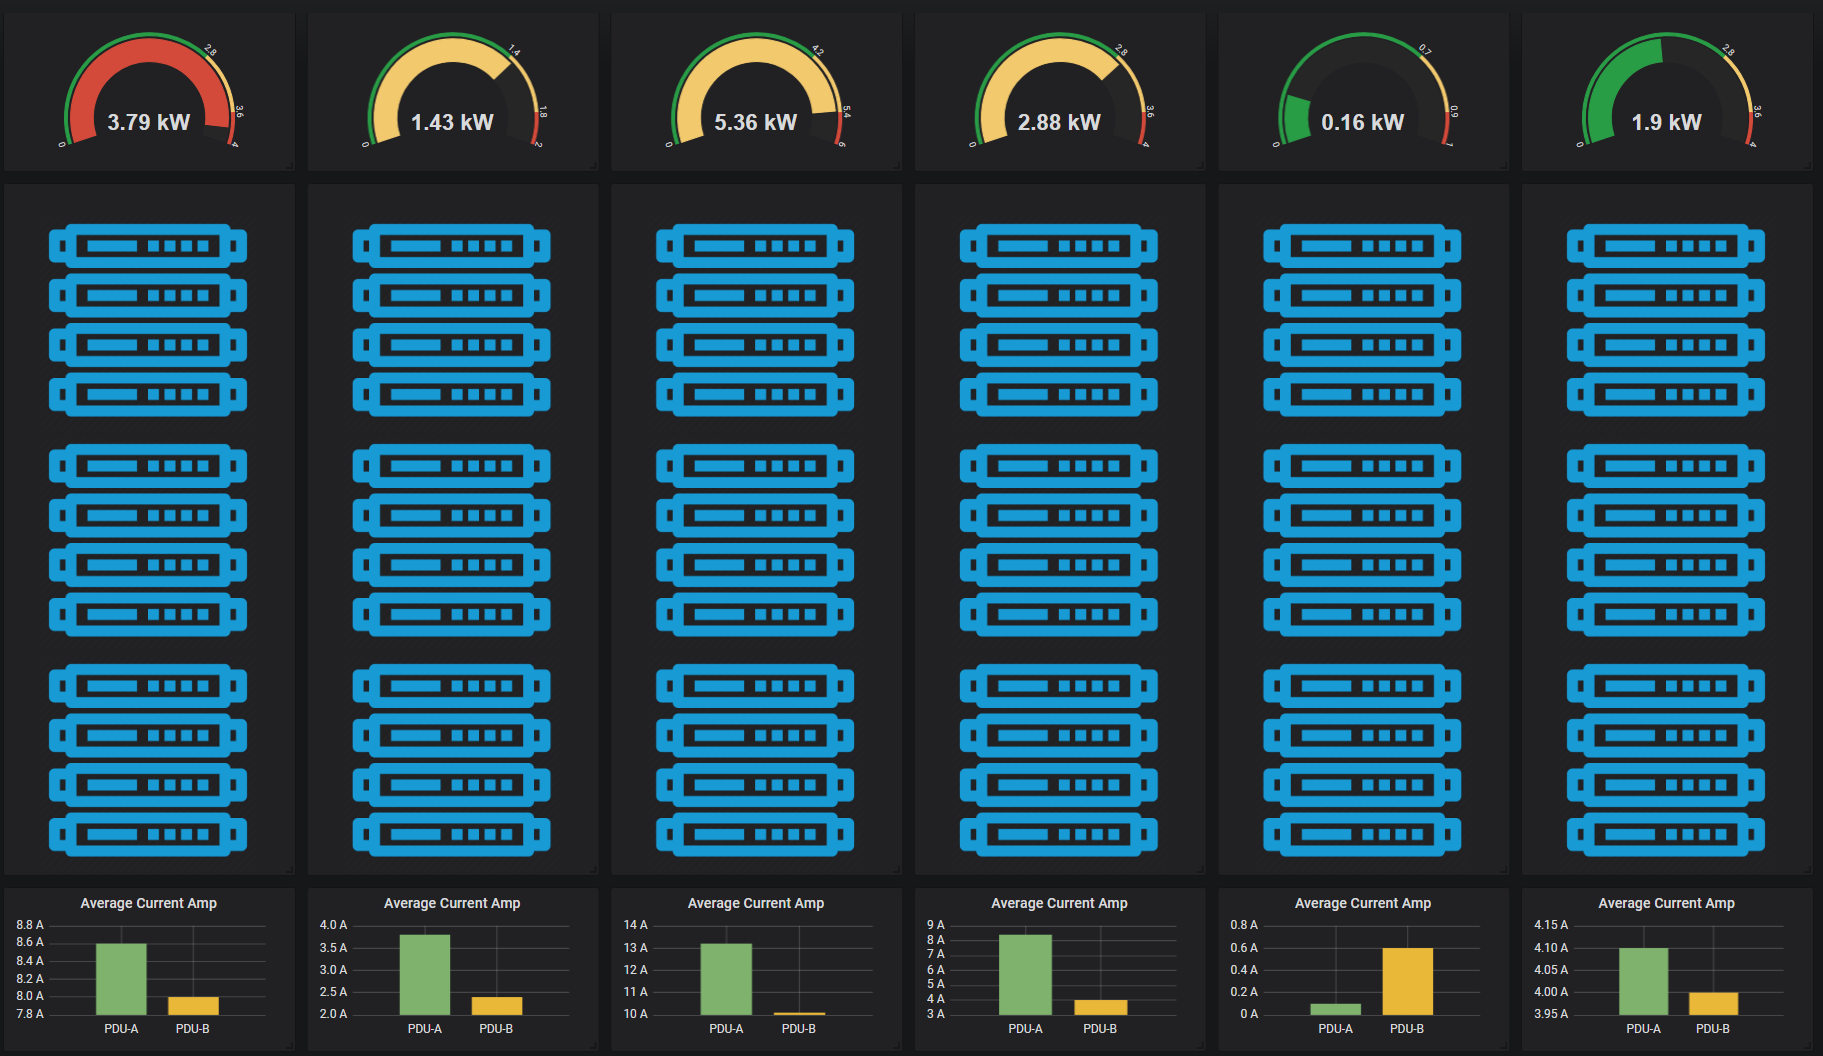
Download and Import the JSON dashboard, this is for Grafana v5.
-
Import the script into your server
-
You will require the following modules install for python to run successfully; * getopt * sys * requests * urllib3 * json * time * InfluxDBClient
-
Edit the script with the appropriate information for you influxdb If you are running Linux this script will need to be added to the crontab, Ensure that you set the scheduling appropriately.
* * * * * root /usr/bin/python /root/poweriq-script/current/poweriq-dual.py <api-token> <pdu-a> <pdu-b>
- Enjoy!
If there is something which this script is missing, please feel free to let me know and I'll attempt to add it, or if you would like to contribute to this script. I am happy for you to do that too! I hope you find this script of some use.