#HelloCharts for Android
Charting library for Android compatible with API 8+(Android 2.2). Works best when hardware acceleration is available, so API 14+(Android 4.0) is recommended. Apache License 2.0.
##Features
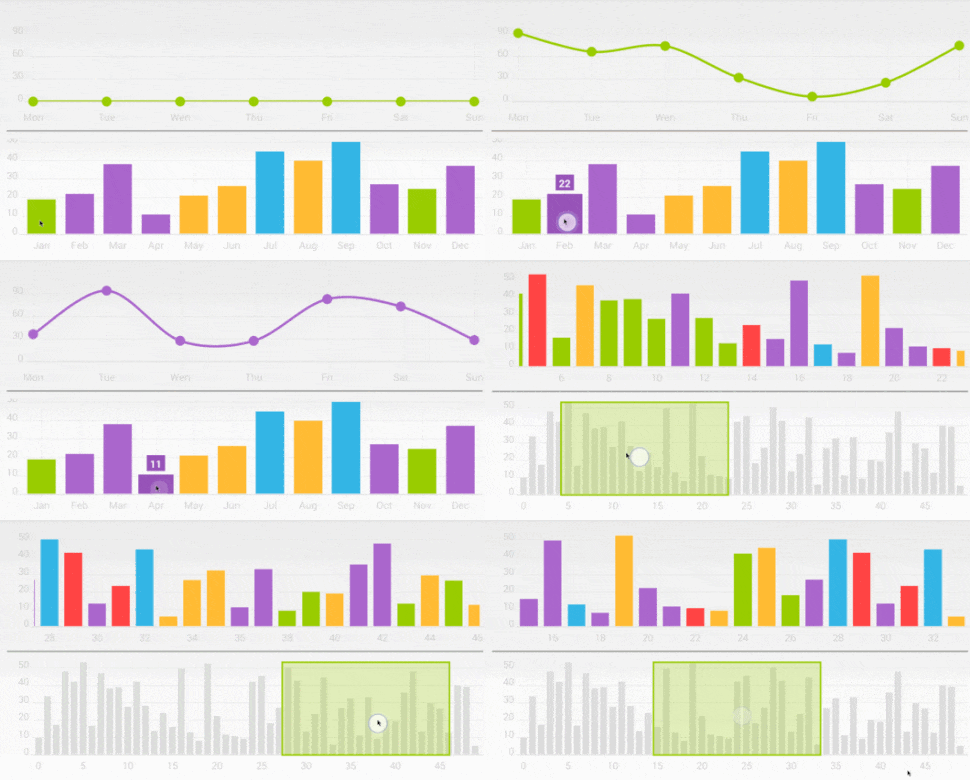
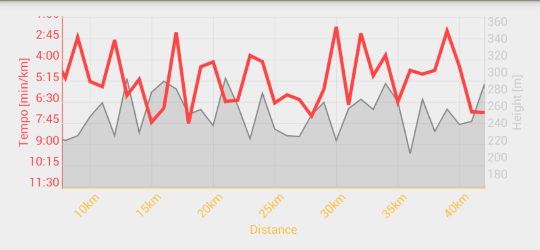
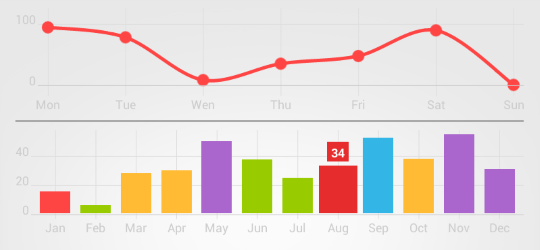
- Line chart(cubic lines, filled lines, scattered points)
- Column chart(grouped, stacked, negative values)
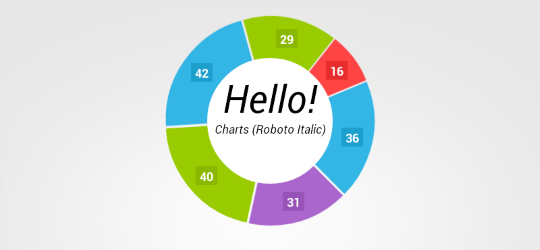
- Pie chart
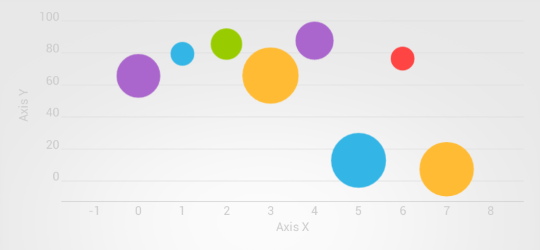
- Bubble chart
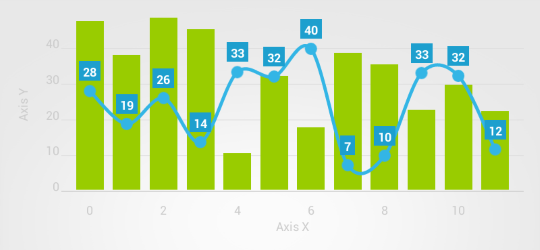
- Combo chart(columns/lines)
- Preview charts(for column chart and line chart)
- Zoom(pinch to zoom, double tap zoom), scroll and fling
- Custom and auto-generated axes(top, bottom, left, right, inside)
- Animations
##Screens and Demos
- Code of a demo application is in
hellocharts-samplesdirectory, requires appcompat v21. - The demo app is also ready for download on Google Play.
- Short video is available on YouTube.
##Download and Import
####Android Studio/Gradle
- Maven Central/jCenter, add dependency to your
build.gradle:
   dependencies{
		compile 'com.github.lecho:hellocharts-library:1.5.8@aar'
}- JitPack.io, add
jitpack.iorepositiory and dependency to yourbuild.gradle:
   repositories {
       maven {
           url "https://jitpack.io"
       }
   }

   dependencies {
       compile 'com.github.lecho:hellocharts-android:v1.5.8'
   }
####Eclipse/ADT
- Download the latest release jar file.
- Copy
hellocharts-library-<version>.jarinto thelibsfolder of your application project.
##Usage
Every chart view can be defined in layout xml file:
   <lecho.lib.hellocharts.view.LineChartView
       android:id="@+id/chart"
       android:layout_width="match_parent"
       android:layout_height="match_parent" />
or created in code and added to layout later:
   LineChartView chart = new LineChartView(context);
   layout.addView(chart);
Use methods from *Chart classes to define chart behaviour, example methods:
   Chart.setInteractive(boolean isInteractive);
   Chart.setZoomType(ZoomType zoomType);
   Chart.setContainerScrollEnabled(boolean isEnabled, ContainerScrollType type);
Use methods from data models to define how chart looks like, example methods:
   ChartData.setAxisXBottom(Axis axisX);
   ColumnChartData.setStacked(boolean isStacked);
   Line.setStrokeWidth(int strokeWidthDp);
Every chart has its own method to set chart data and its own data model, example for line chart:
   List<PointValue> values = new ArrayList<PointValue>();
   values.add(new PointValue(0, 2));
   values.add(new PointValue(1, 4));
   values.add(new PointValue(2, 3));
   values.add(new PointValue(3, 4));

   //In most cased you can call data model methods in builder-pattern-like manner.
   Line line = new Line(values).setColor(Color.BLUE).setCubic(true);
   List<Line> lines = new ArrayList<Line>();
   lines.add(line);

   LineChartData data = new LineChartData();
   data.setLines(lines);

   LineChartView chart = new LineChartView(context);
   chart.setLineChartData(data);
After the chart data has been set you can still modify its attributes but right after that you should call
set*ChartData() method again to let chart recalculate and redraw data. There is also an option to use copy constructor for deep copy of
chart data. You can safely modify copy in other threads and pass it to set*ChartData() method later.
##Contributing
Yes:) If you found a bug, have an idea how to improve library or have a question, please create new issue or comment existing one. If you would like to contribute code fork the repository and send a pull request.
#License
HelloCharts
Copyright 2014 Leszek Wach

Licensed under the Apache License, Version 2.0 (the "License");
you may not use this file except in compliance with the License.
You may obtain a copy of the License at

   http://www.apache.org/licenses/LICENSE-2.0

Unless required by applicable law or agreed to in writing, software
distributed under the License is distributed on an "AS IS" BASIS,
WITHOUT WARRANTIES OR CONDITIONS OF ANY KIND, either express or implied.
See the License for the specific language governing permissions and
limitations under the License.
 HelloCharts library uses code from InteractiveChart sample available
 on Android Developers page:

   http://developer.android.com/training/gestures/scale.html


