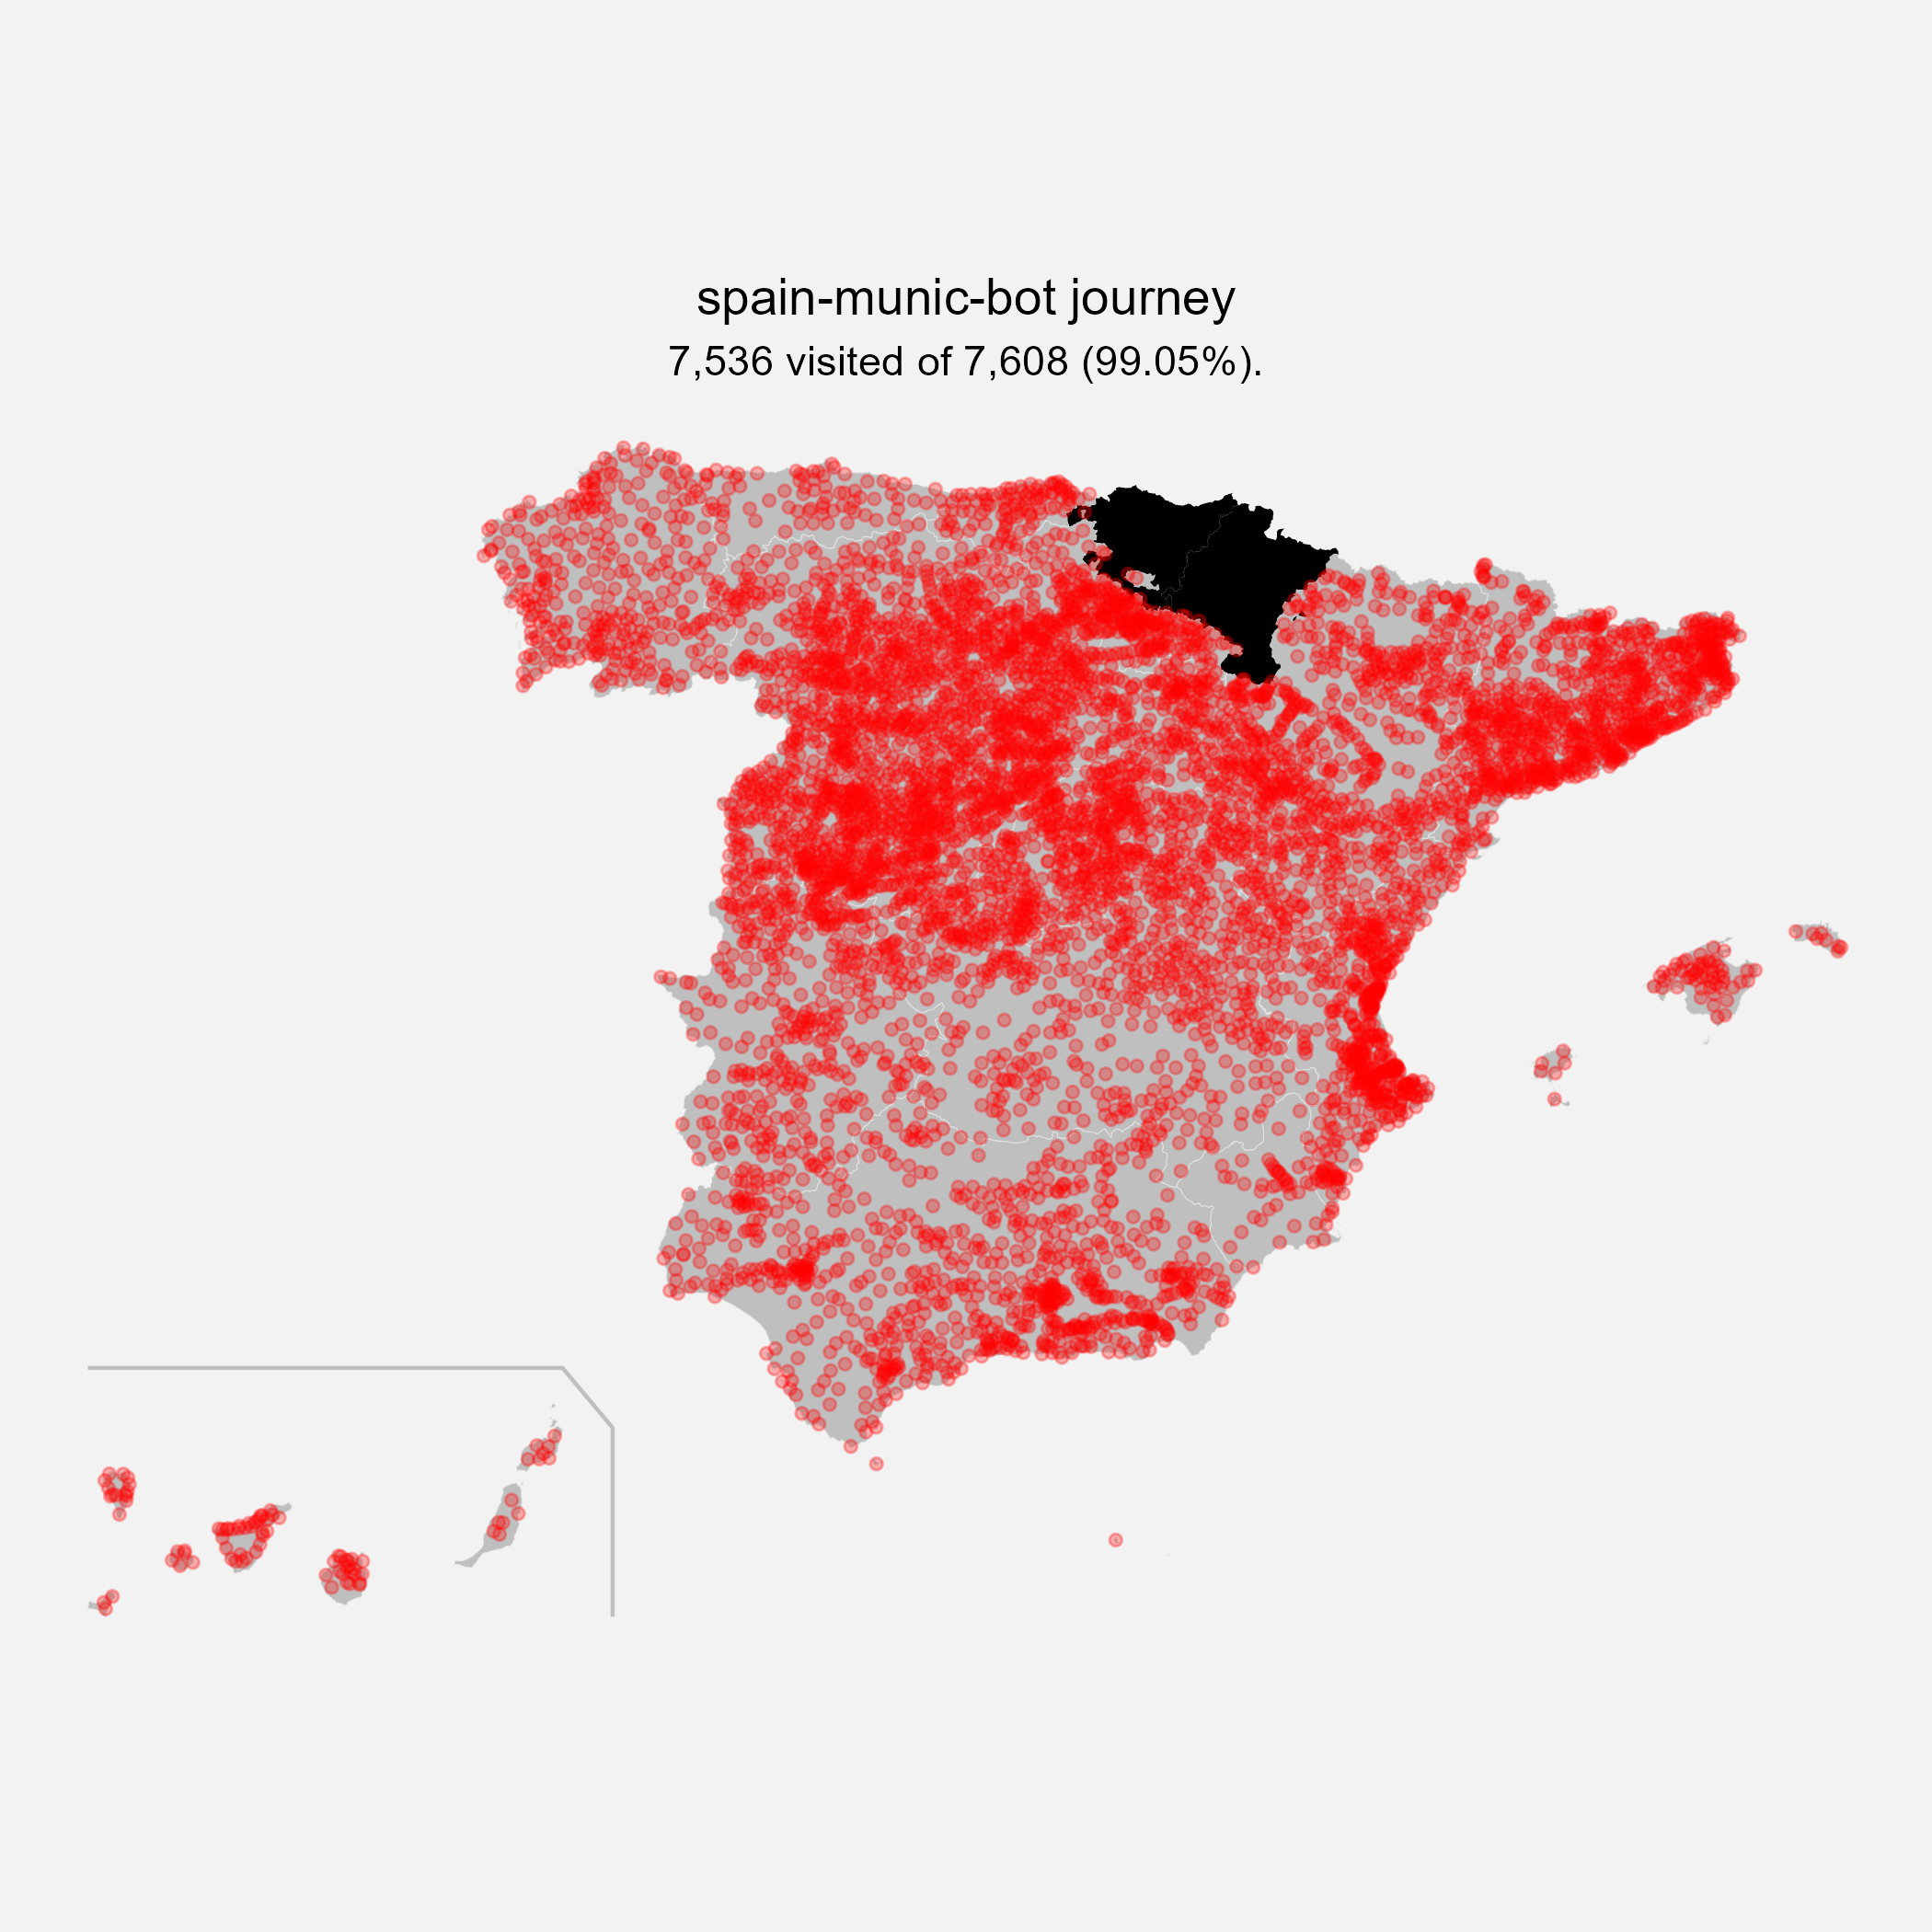
I tweet a random map of a Spanish town together with its name, province, and autonomous community (and a inset map of Spain showing the region and the community). The bot is set to run every 20 minutes.
I create a map of the Urban Growth of Spanish cities, based on the works of Dominic Royé: Visualize urban growth
Find here all the maps generated by the bot.
Core packages used in the project are:
- {CatastRo} for the buildings.
- {mapSpain} for the location of the municipalities.
- {ggplot2} for plotting,
- {rtweet} for posting,
Other packages used are {sf}, {dplyr} and another common supporting packages.
This project uses {renv} for ensuring fully reproducibility across platforms.
-
Based on
- italiancomuni, by @espinielli.
-
Automation:
- GitHub Actions as per @espinielli's GitHub Repo.
-
sources:
From the command line it is enough to run the following command:
$ Rscript R/trigger.R
This will trigger R/01_create_map.R and compose the tweet.


