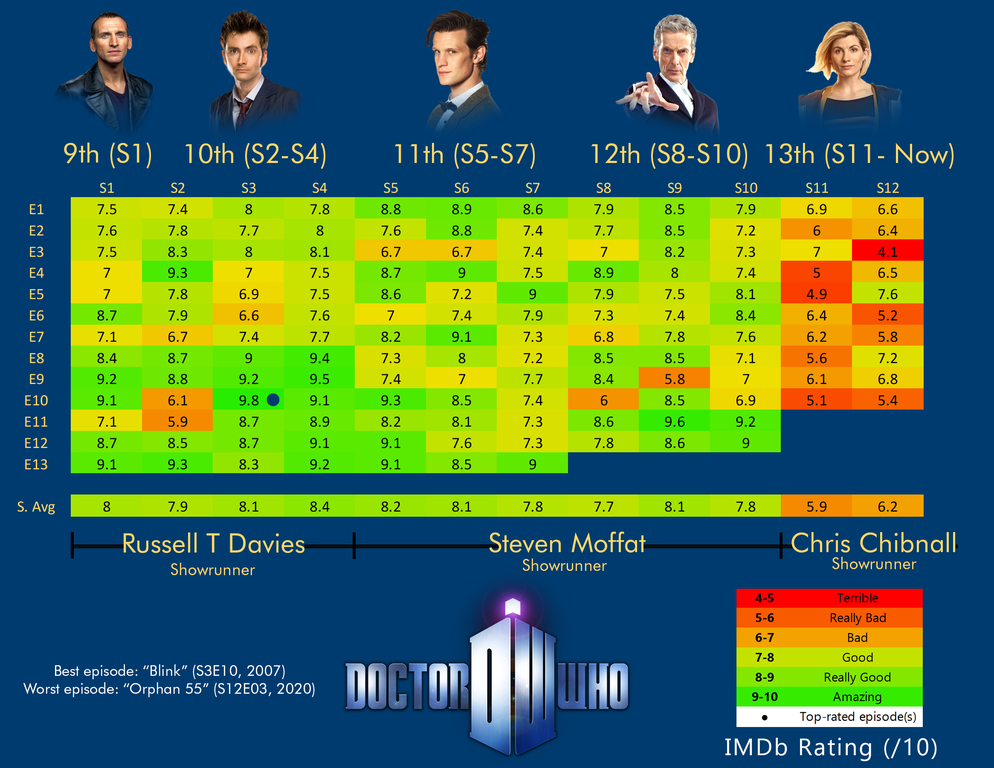
Weekend hackathon will be an exercise to any beginners wanting to test their skills on an interesting visualization project. Open for all members of the Data Science Nuggets & Data Science Chats community in telegram. https://t.me/kdnuggets https://t.me/datasciencechats
Source Image credit: reditt by xxLusseyArmetxX
Objectives: You will need to demonstrate both ETL and EDA skills ETL - Extraction, Transformation & Load EDA - Exploratory Data Analysis
- Data Collection: Pick your favorite TV series ratings link or use the below link and write a script (python or R etc) to extract the ratings data of all the seasons from imdb url in the given tabular format shown in the image. https://www.imdb.com/title/tt0436992/episodes?ref_=tt_eps_sn_mr If you are beginner with no programming knowledge to do scraping you can do the process manually as well. Idea is to learn the process of data collection and not all times everything can be automated. So you can still participate.
- Data Exploration: Once you have extracted the data of a given series do some EDA via program of your choice on the data you just collected. Ex:Your results could possibly give great insights on the series or answers to simple questions like highest rated episode or lowest rated episode. Highest rated season etc. These are just examples and this excercise is open for everyones thoughts. Be creative.
- Data Visualization:Finally represent the data in a visualization either similar to the picture or a visualization of your own. You can use any tool of your choice. (python,r,powerbi, tableau etc.)
Dont worry if you dont know about working on few of the areas above. Or you are only specialized in just one skill. For the rest you can do manually. Example: If you are just a powerbi expert and no idea on python or r you can collect data manually and complete the rest of the steps of eda and visualization.
ETL - Extraction, Transformation & Load EDA - Exploratory Data Analysis 1)How to do data collection either manual or automation extraction 2)Transform data as per requirements 3)Then load the data and perform visualization or draw some insights from data.
What is most important for any project is timelines. We all know everything is possible but in realtime environment you only get a limited time to complete an action. We are proposing a timeline of 1-2 days. (by July 5th 2020) So submit your solutions along with all artifacts (notebooks or source & data files) via our github https://github.com/datasciencenuggets/imdb-seasons or email to datascience.nuggets@gmail.com Top 3 solutions will be reviewed and selected and published as winners in our main channel.
Pass it on to as many learners as possible. Remember "Knowledge Shared Is Knowledge Gained"
