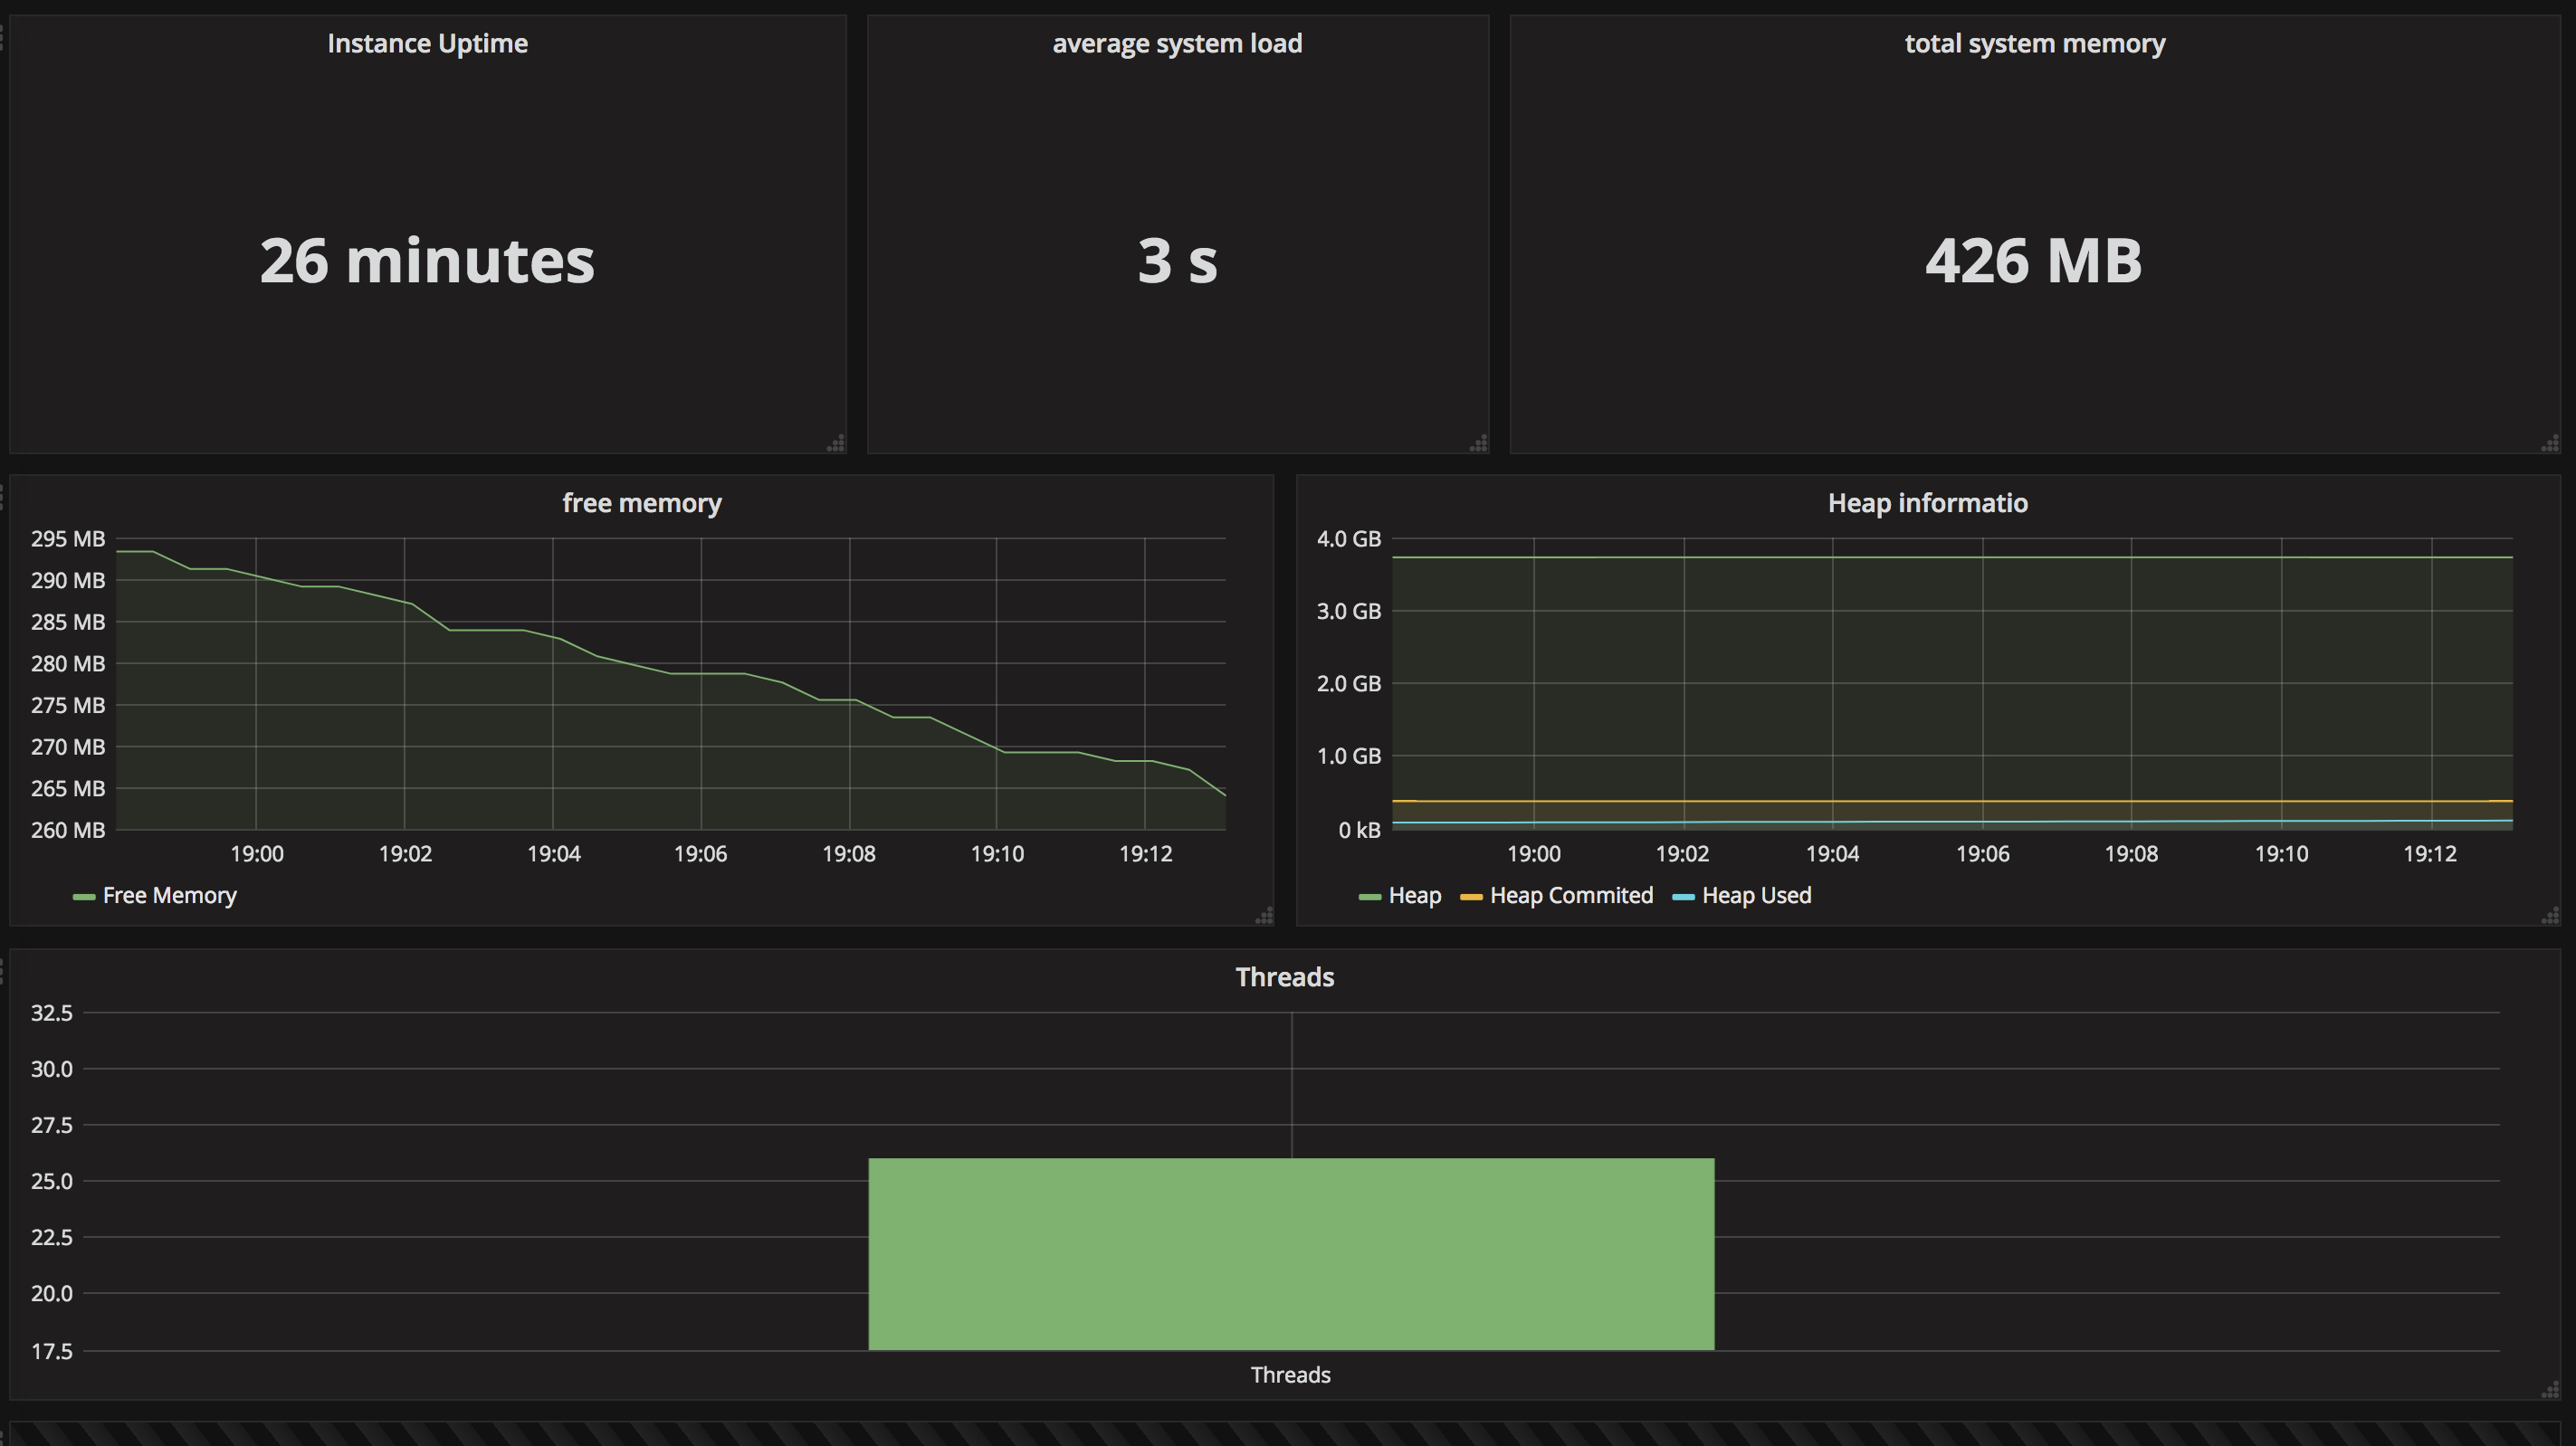
a very minimalist example, that show how to configure Grapahana to scrap Spring Boot app metrics and shows them in grafana dashboards. for more details, check out: https://aboullaite.me/spring-boot-monitoring-prometheus-grafana/
to run the examole use docker compose up -d --build, this will start 2 containers: Prometheus and Grafana. Next on, run Spring boot app!