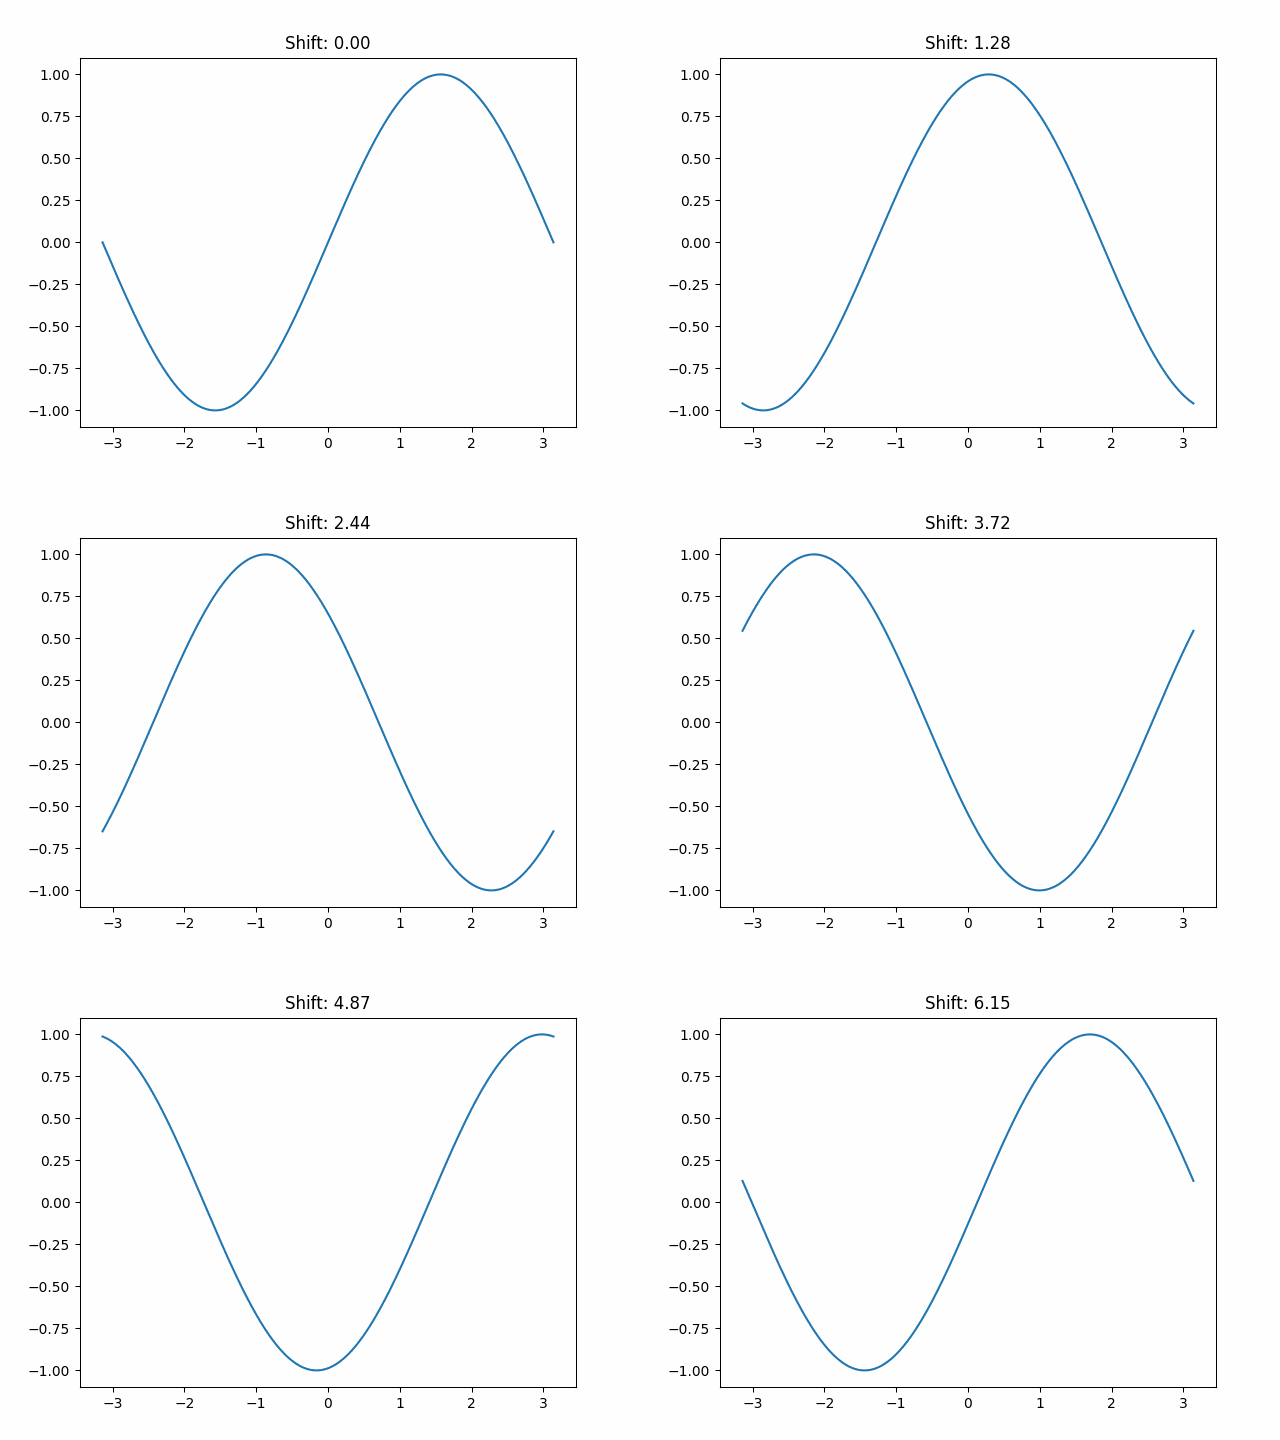
Make a gif out of a loop of matplotlib plots.
pip install gifify
import numpy as np
import matplotlib.pyplot as plt
from gifify import gifify

x = np.linspace(-np.pi, np.pi, 1000)
shift = np.linspace(0, 2*np.pi, 50)[:-1]

for s in gifify(shift, filename="sin.gif"):
    plt.title(f"Shift: {s:.2f}")
    plt.plot(x, np.sin(x + s))
The above code creates the following gif:
The created gif is displayed in the notebook if the code is run in a Jupyter notebook.
This can be turned off by setting display=False in the gifify function.
- Add ability to pass artists and other options to the
plt.savefigcall - Fix issue where the gif doesnt loop when displayed in the notebook
- Add controls to the gif in the notebook
- Add support for other formats beyond gifs
- Add option to save only every n-th frame, or total number of frames
- Add
__len__so that tqdm can be chained in either order

