🚀 10x easier, 🚀 140x lower storage cost, 🚀 high performance, 🚀 petabyte scale - Elasticsearch/Splunk/Datadog alternative for 🚀 (logs, metrics, traces).
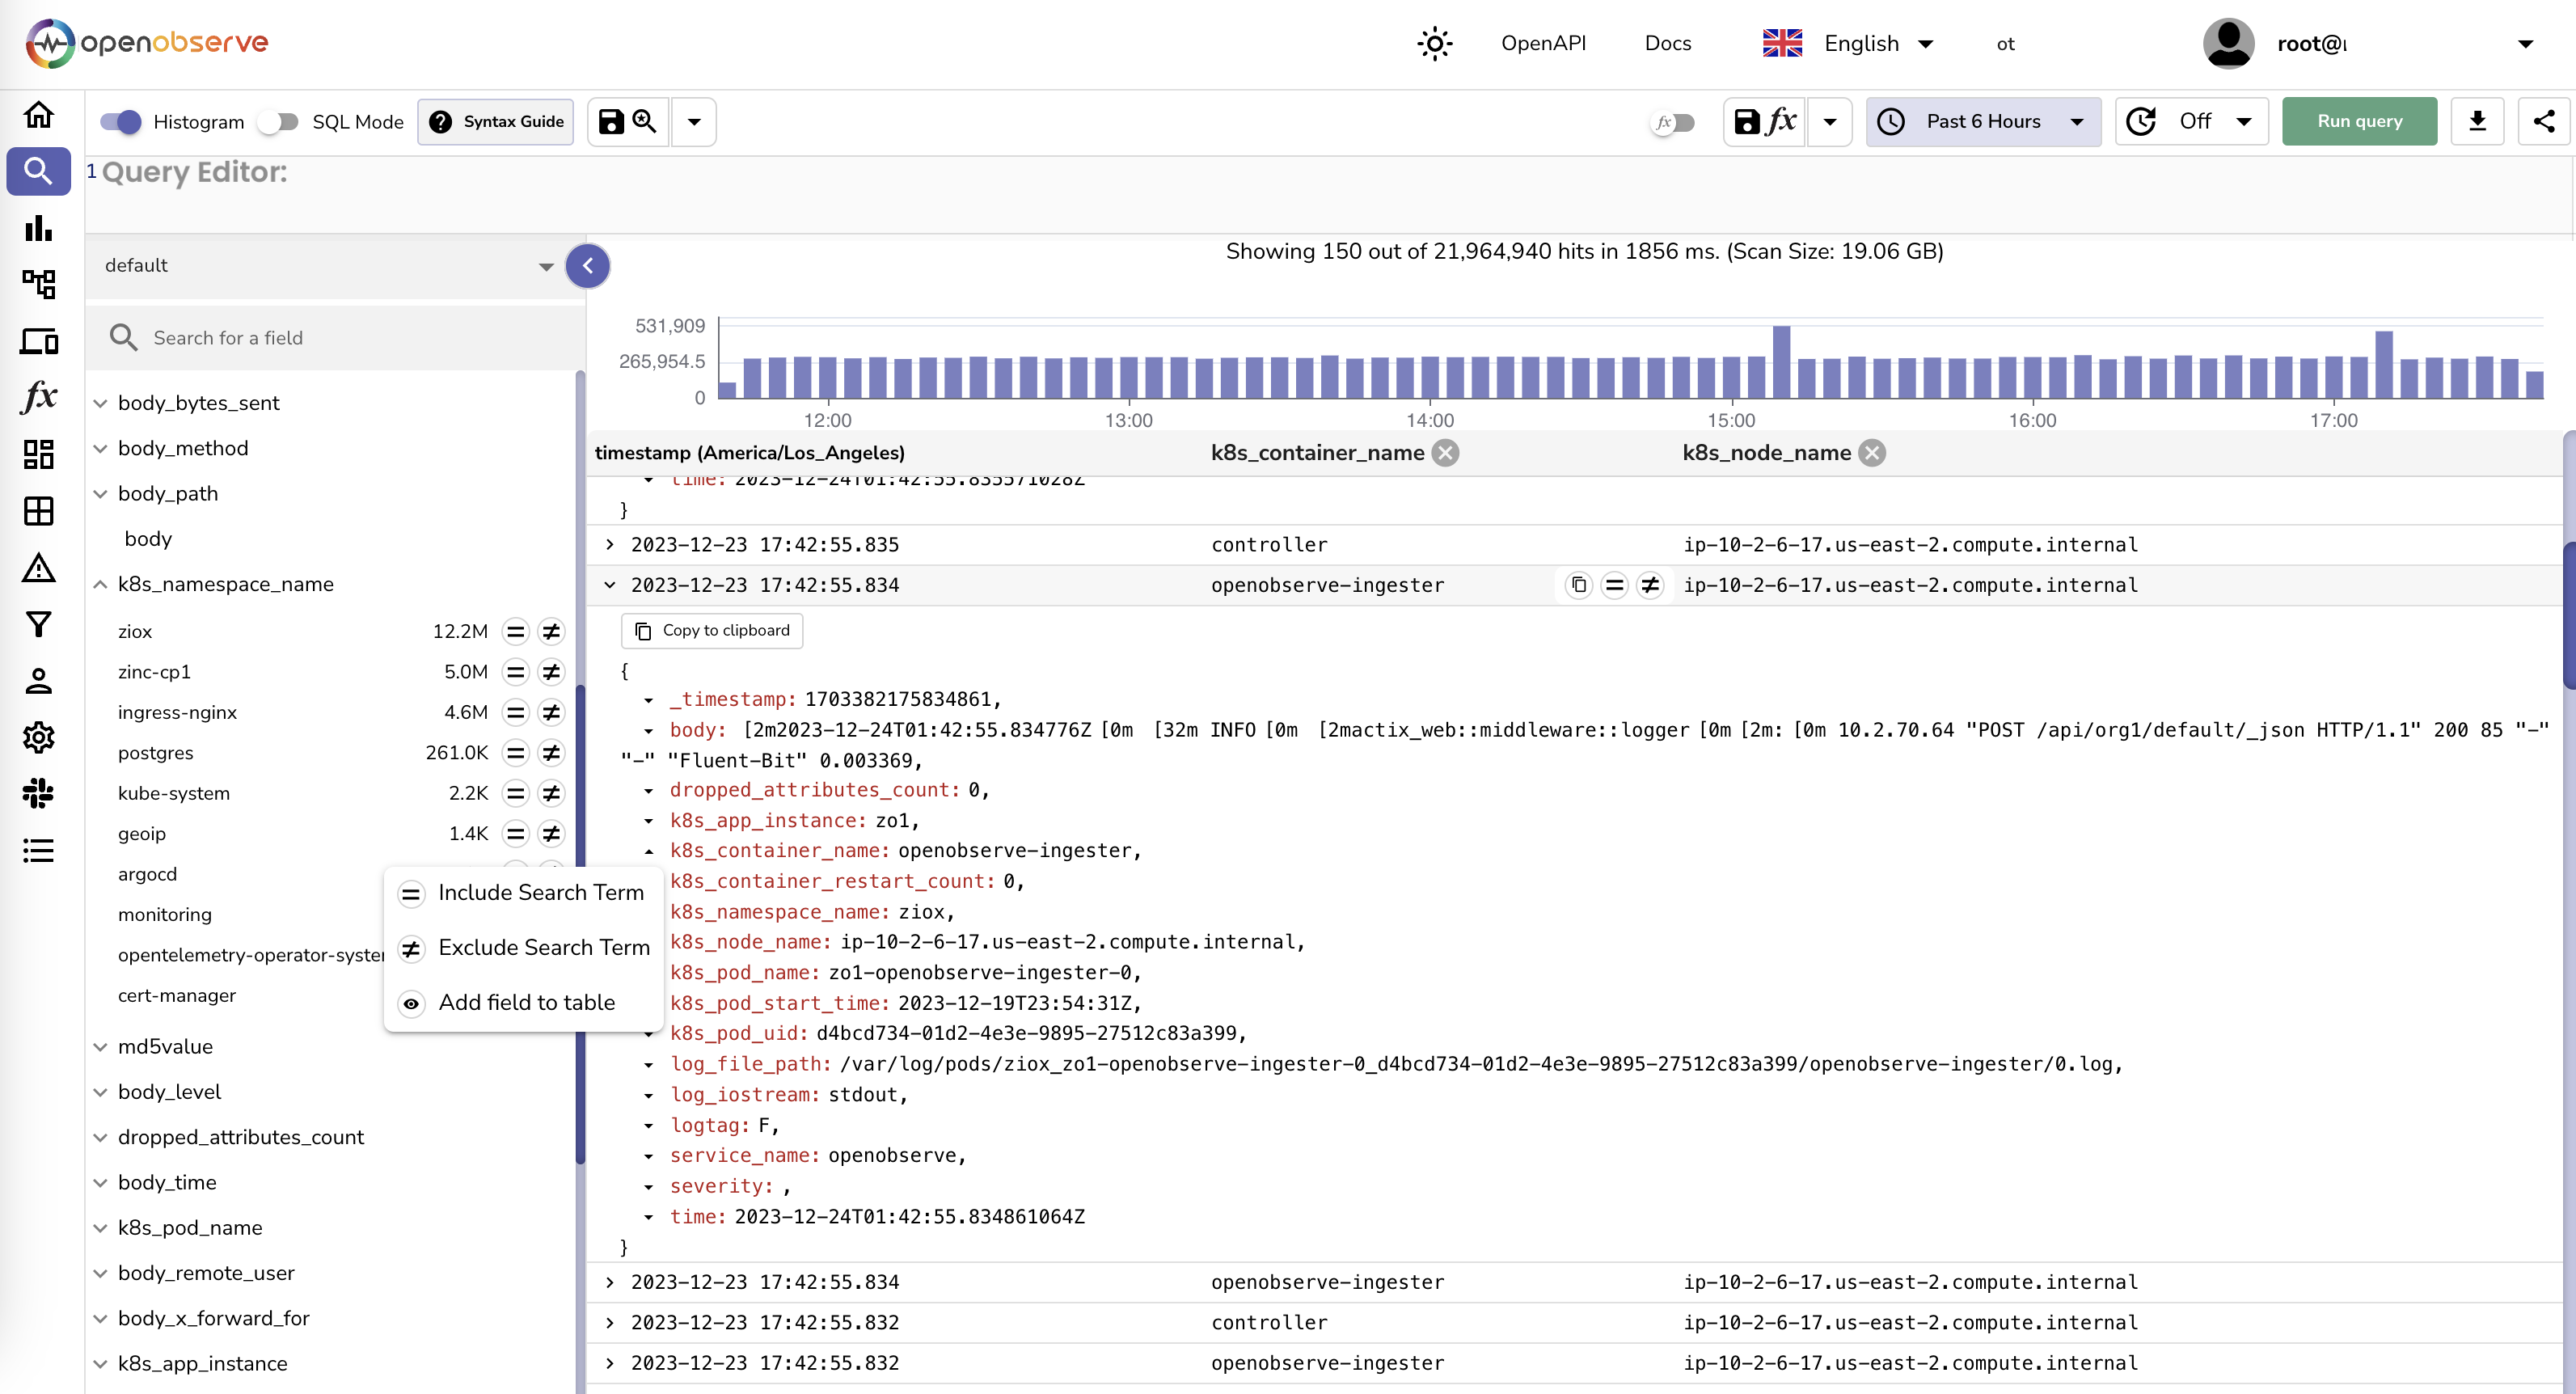
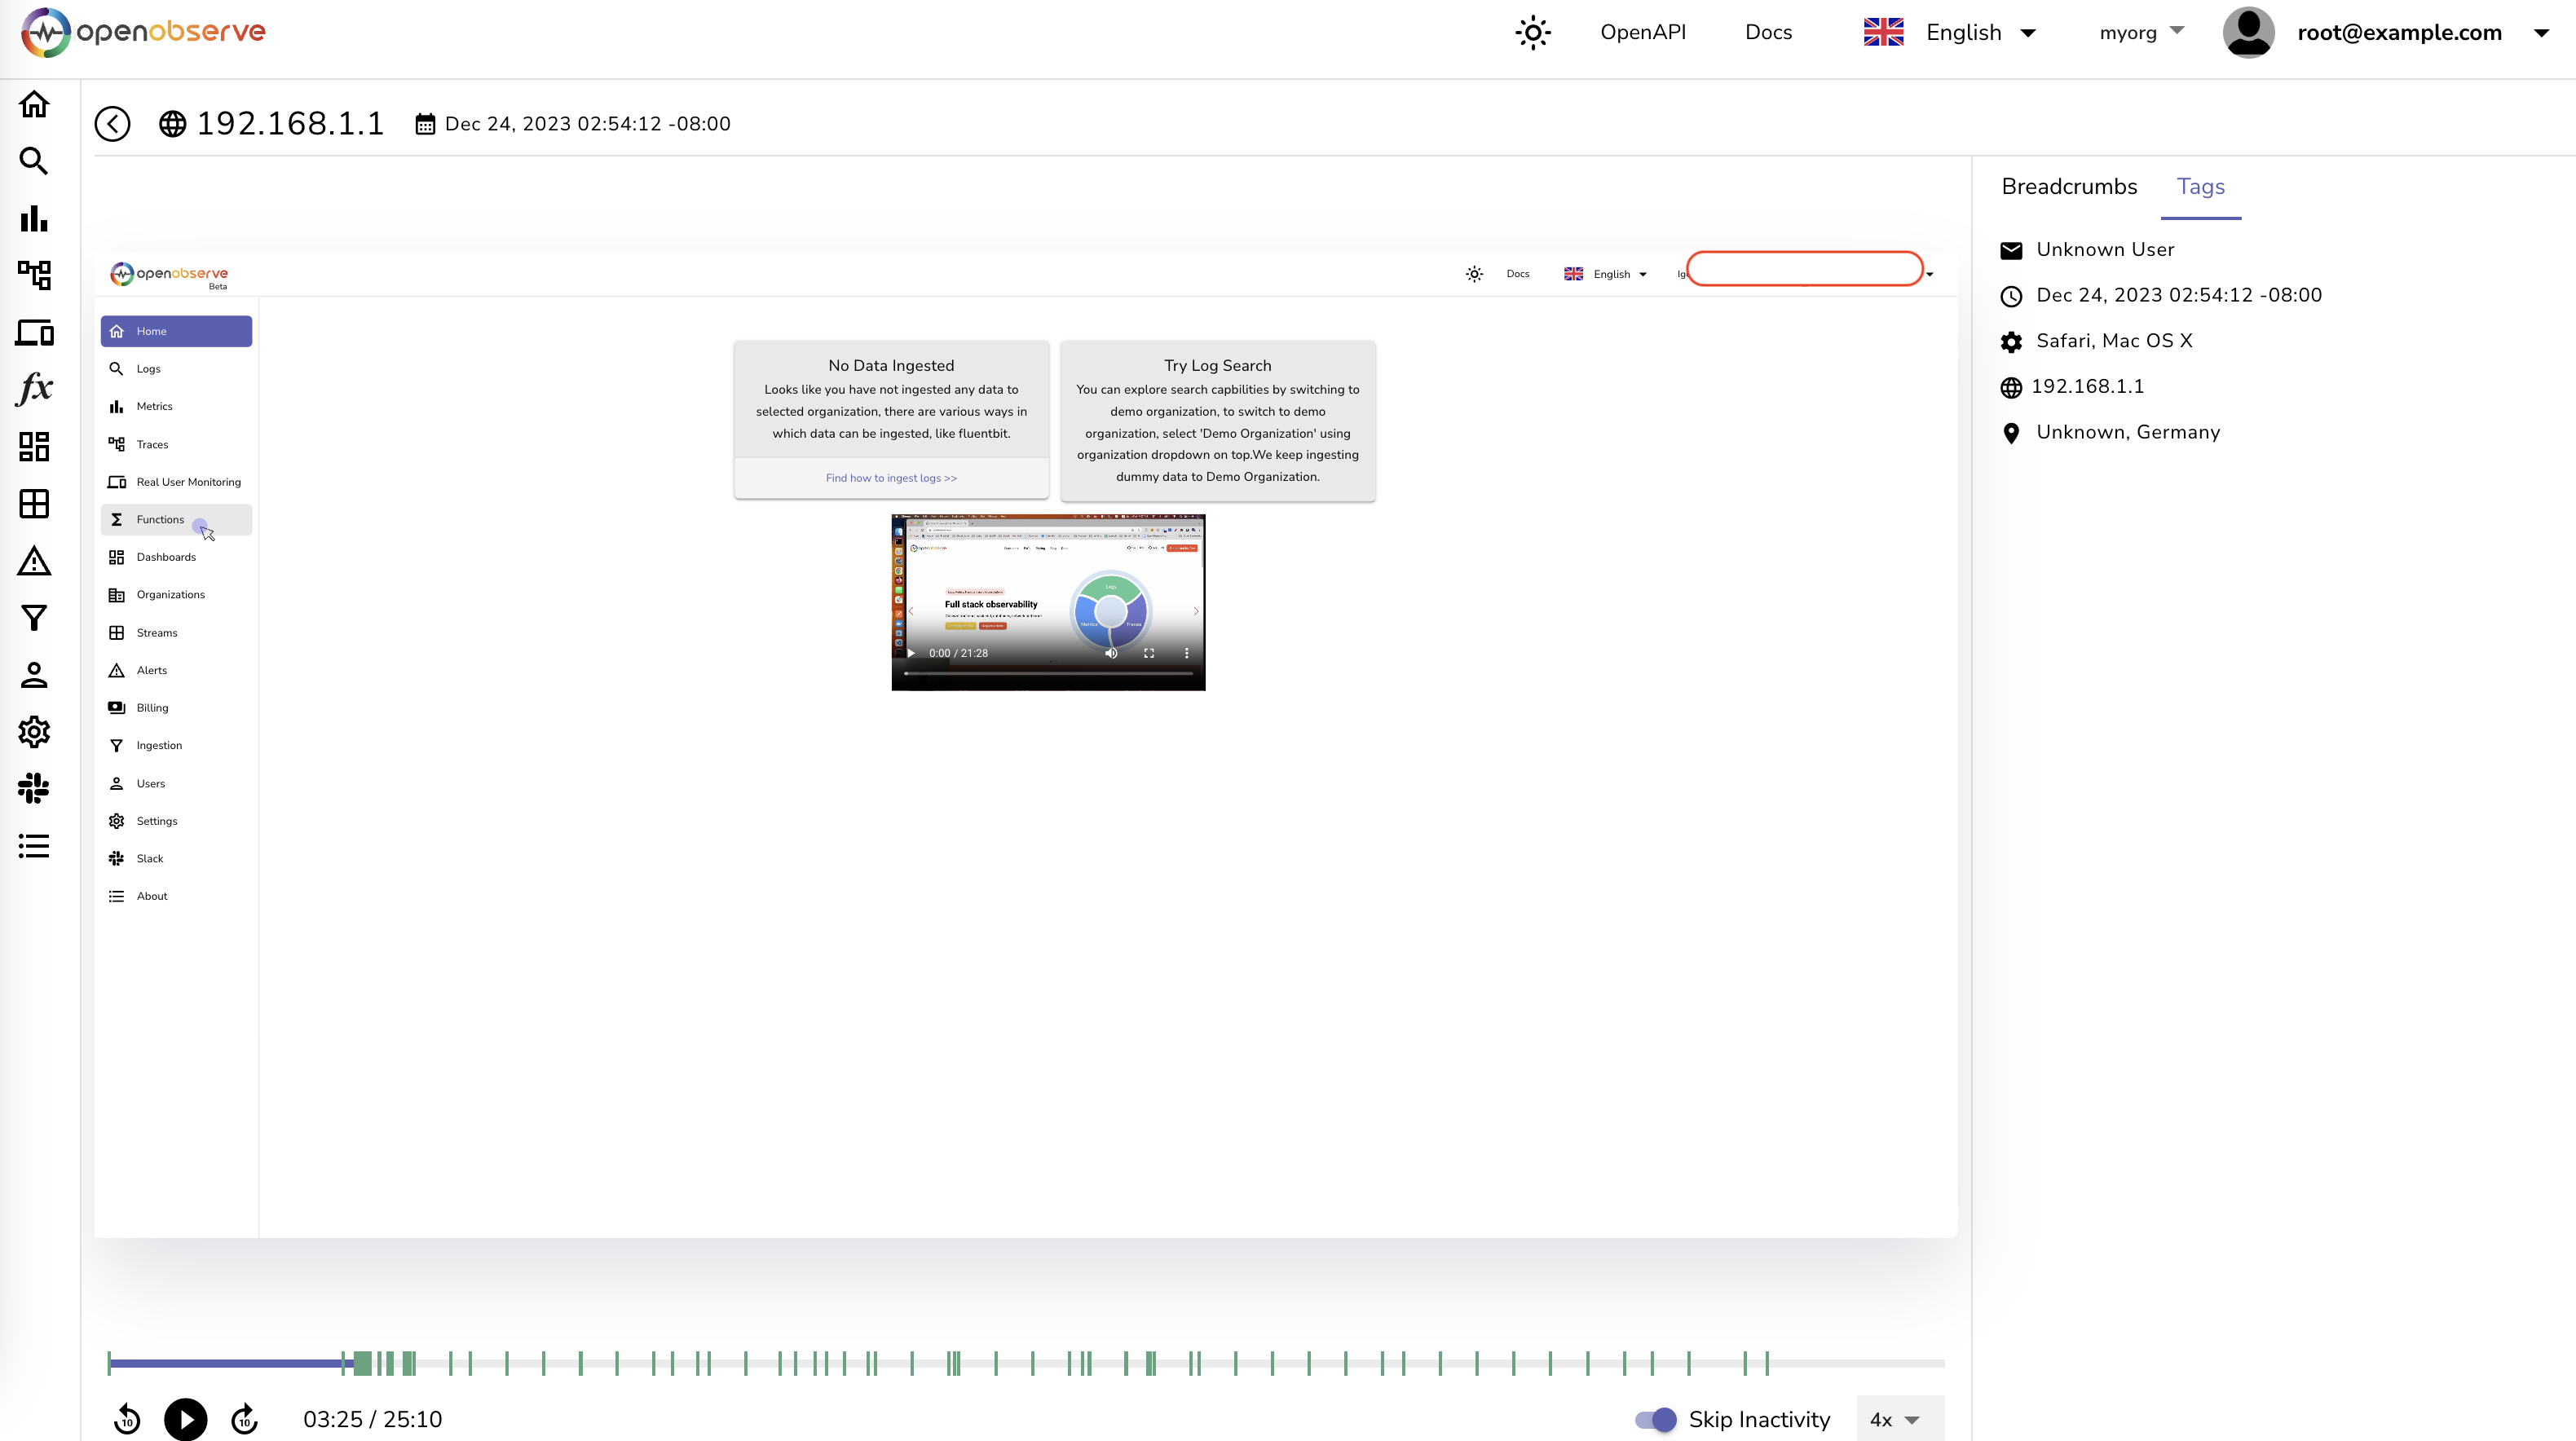
OpenObserve (O2 for short) is a cloud-native observability platform built specifically for logs, metrics, traces, analytics, RUM (Real User Monitoring - Performance, Errors, Session Replay) designed to work at petabyte scale.
It is straightforward and easy to operate, in contrast to Elasticsearch, which requires understanding and tuning numerous settings. Get OpenObserve up and running in under 2 minutes.
OpenObserve serves as a seamless replacement for Elasticsearch for users who ingest data using APIs and perform searches. OpenObserve comes with its own user interface, eliminating the need for separate installation.
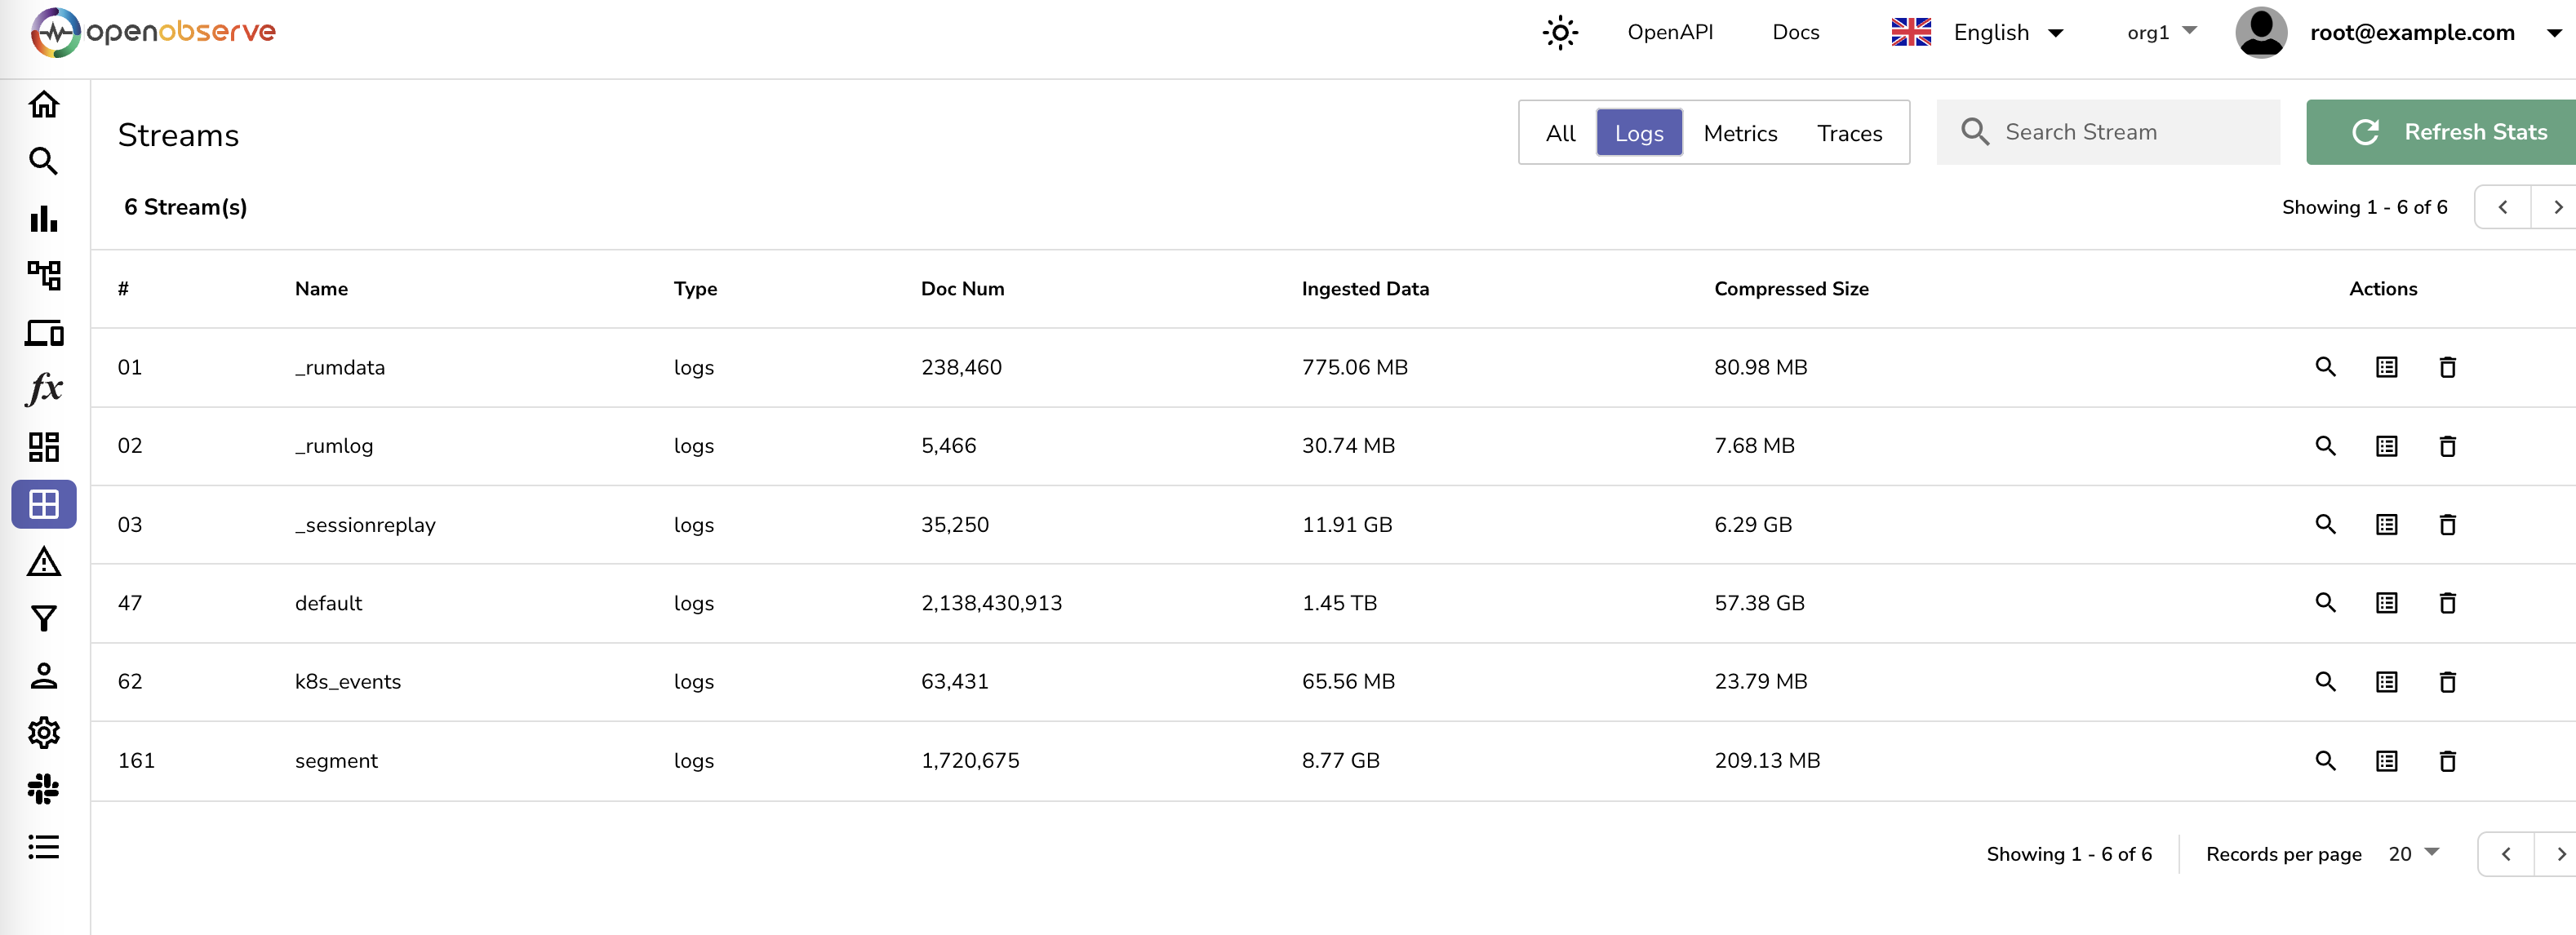
You can reduce your log storage costs by ~140x compared to Elasticsearch by using OpenObserve. Below, we present the results from pushing logs from our production Kubernetes cluster to both Elasticsearch and OpenObserve using Fluent Bit.
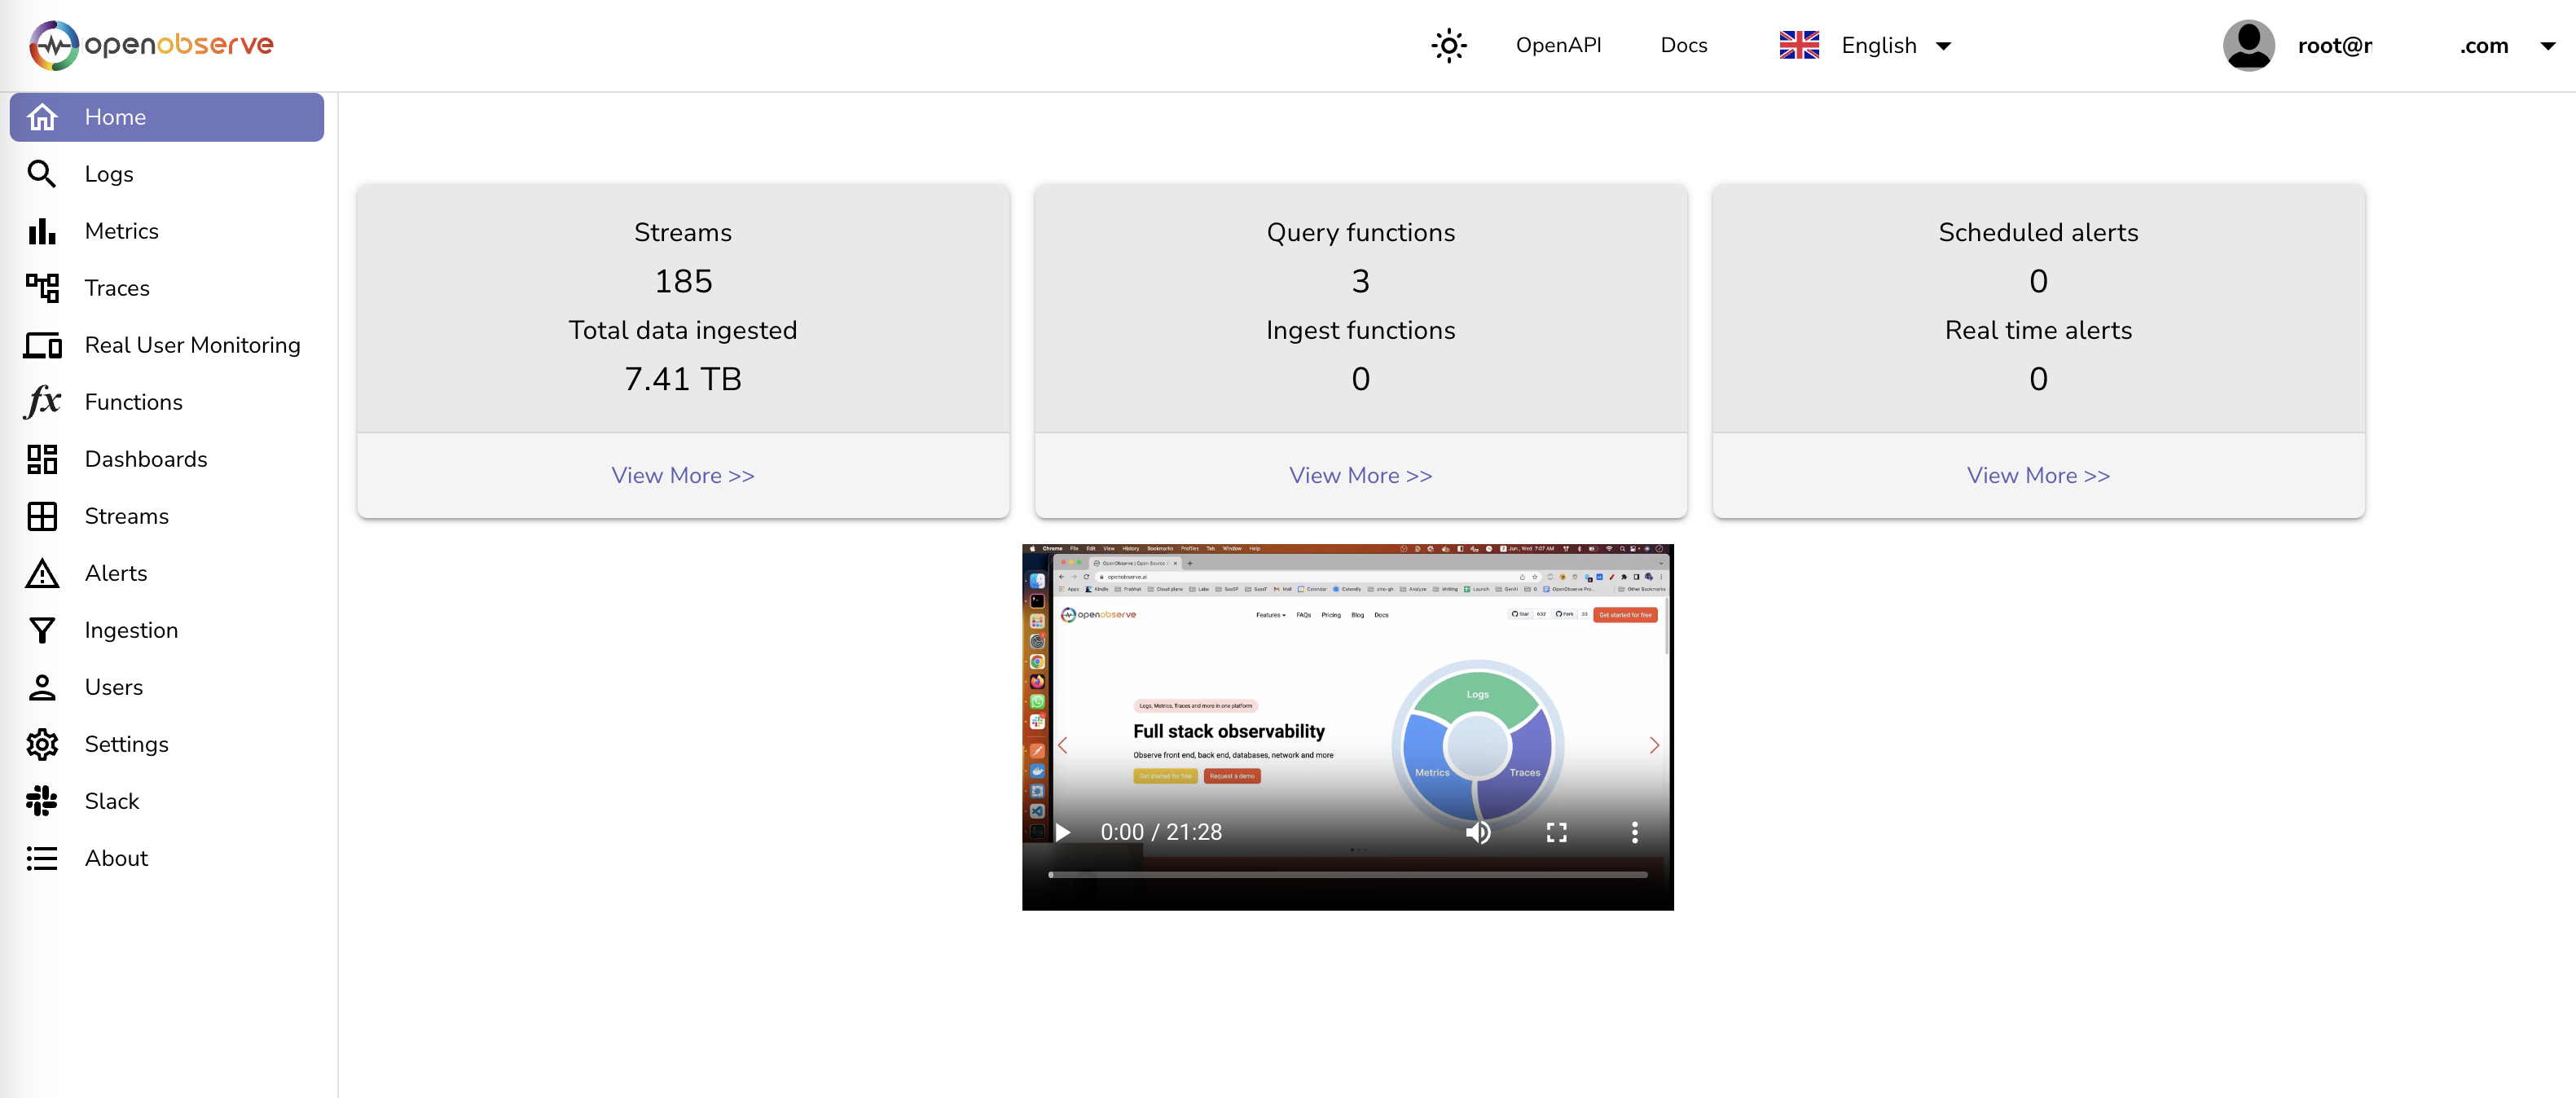
OpenObserve_Introduction.mp4
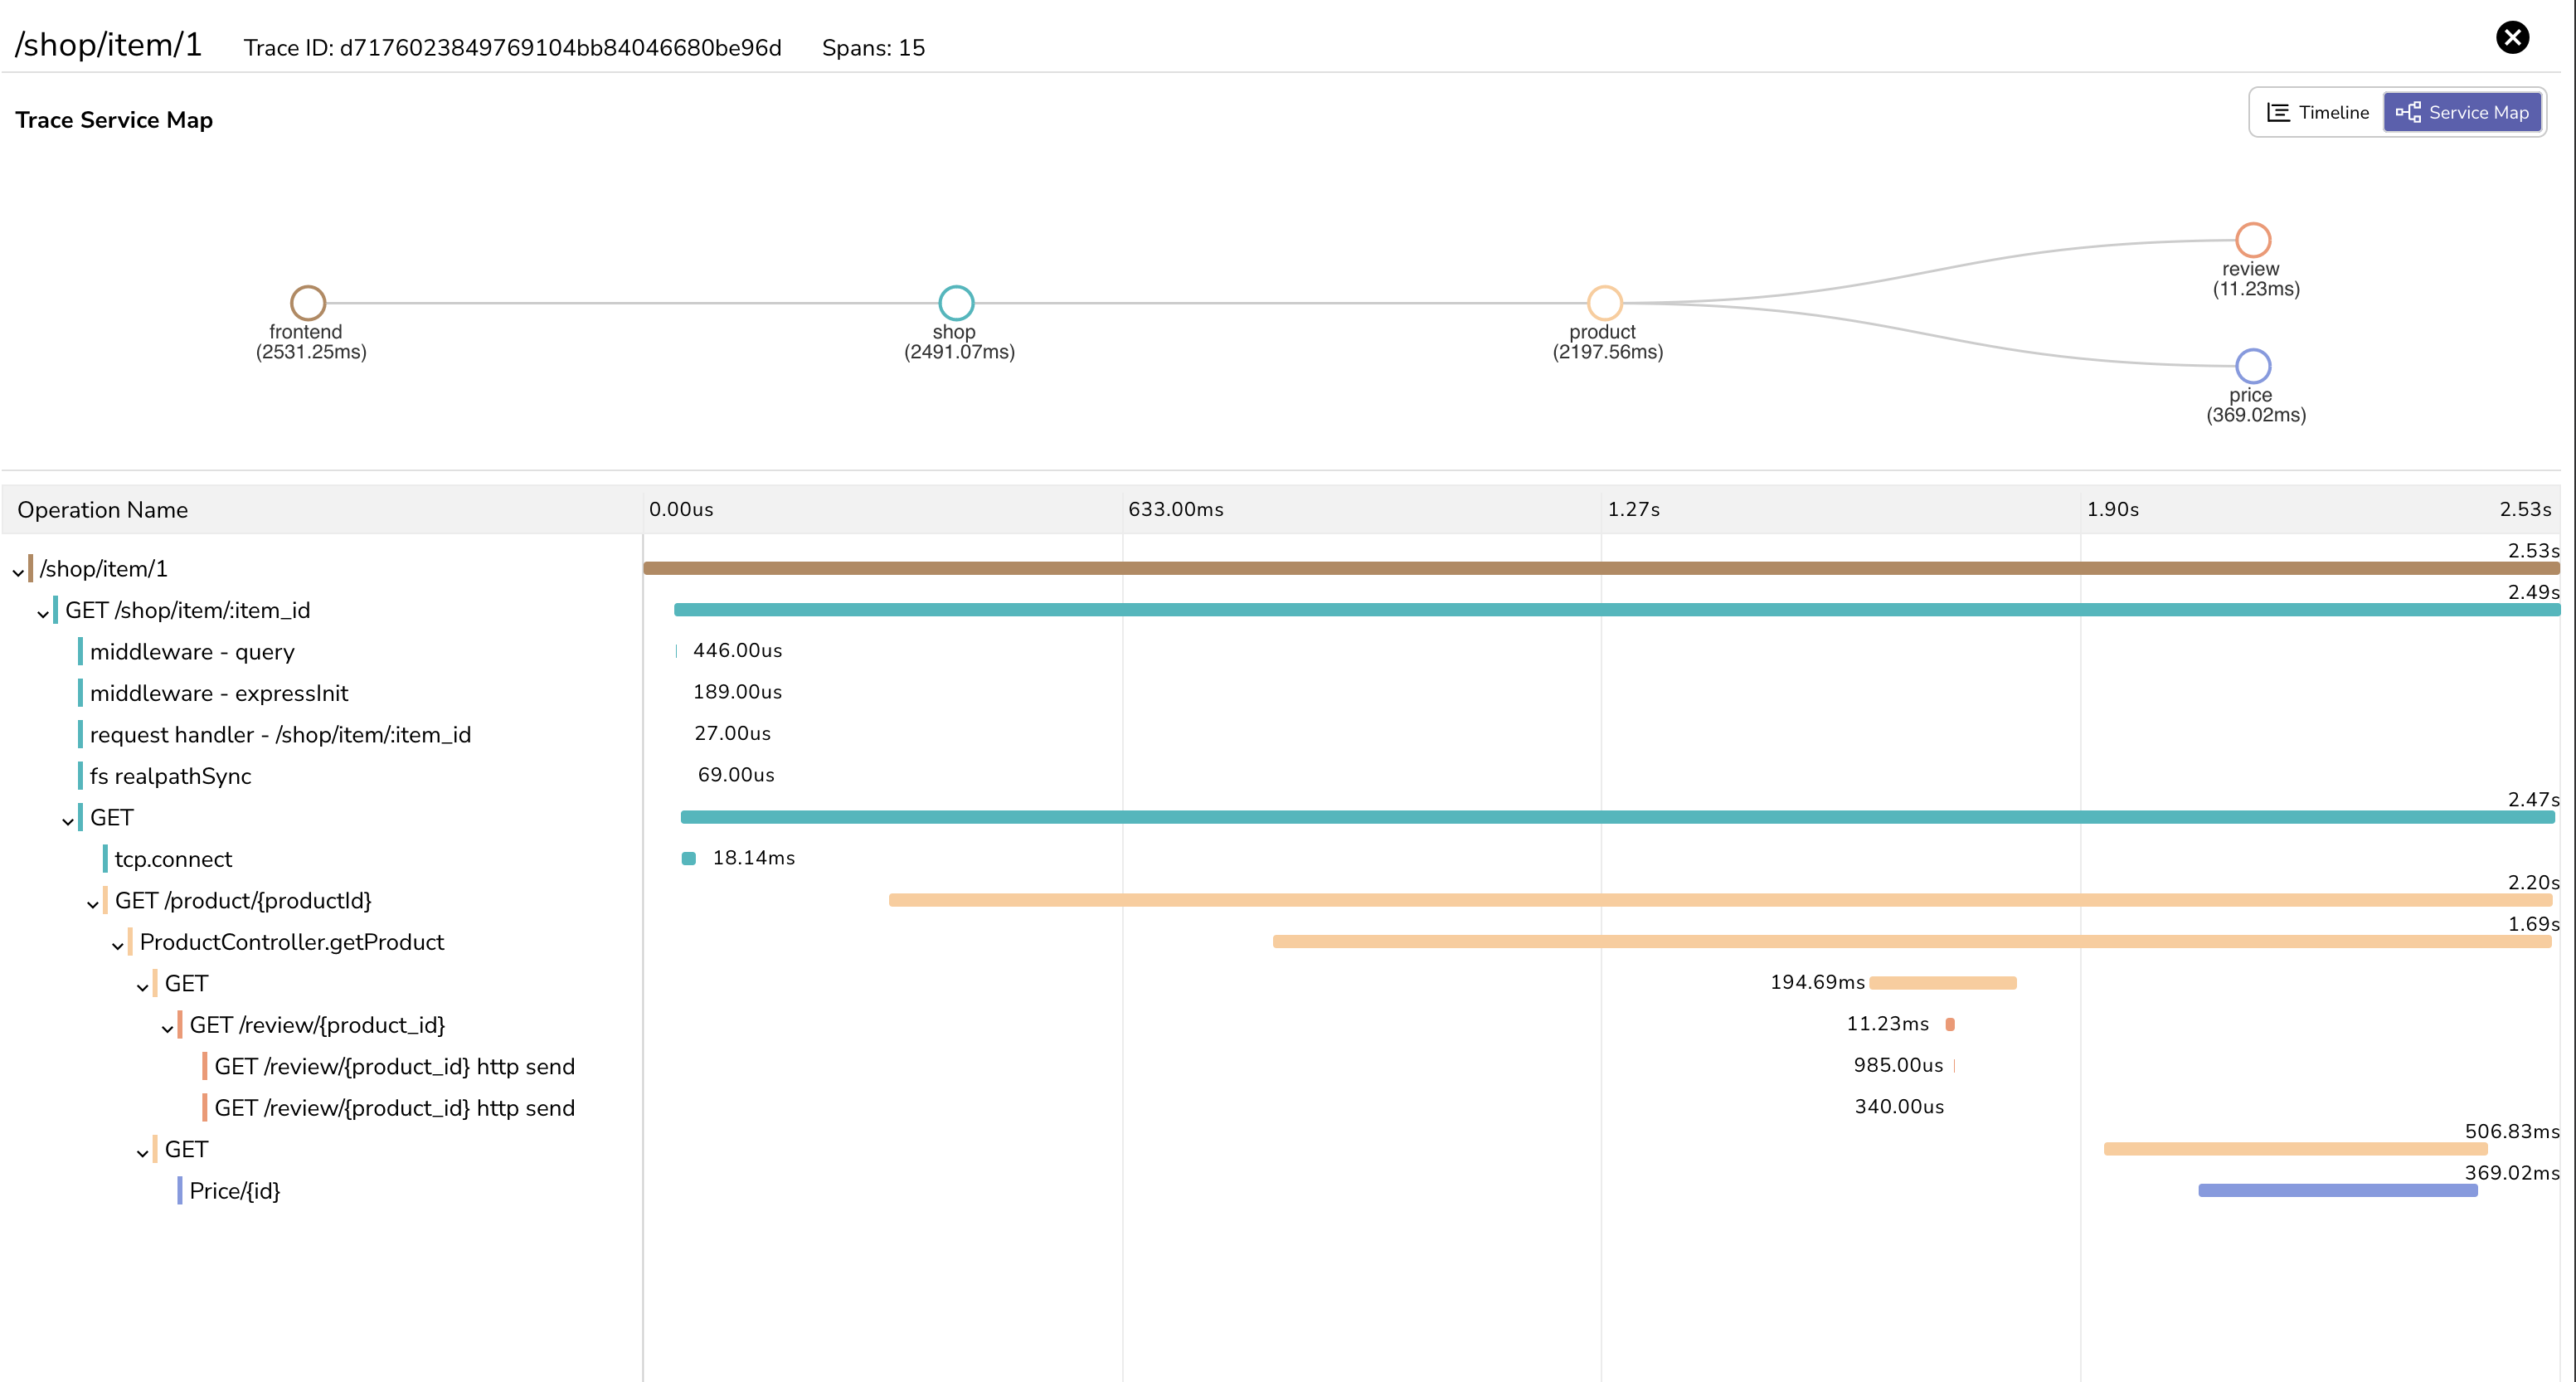
- Logs, Metrics, Traces: Comprehensive support for various data types.
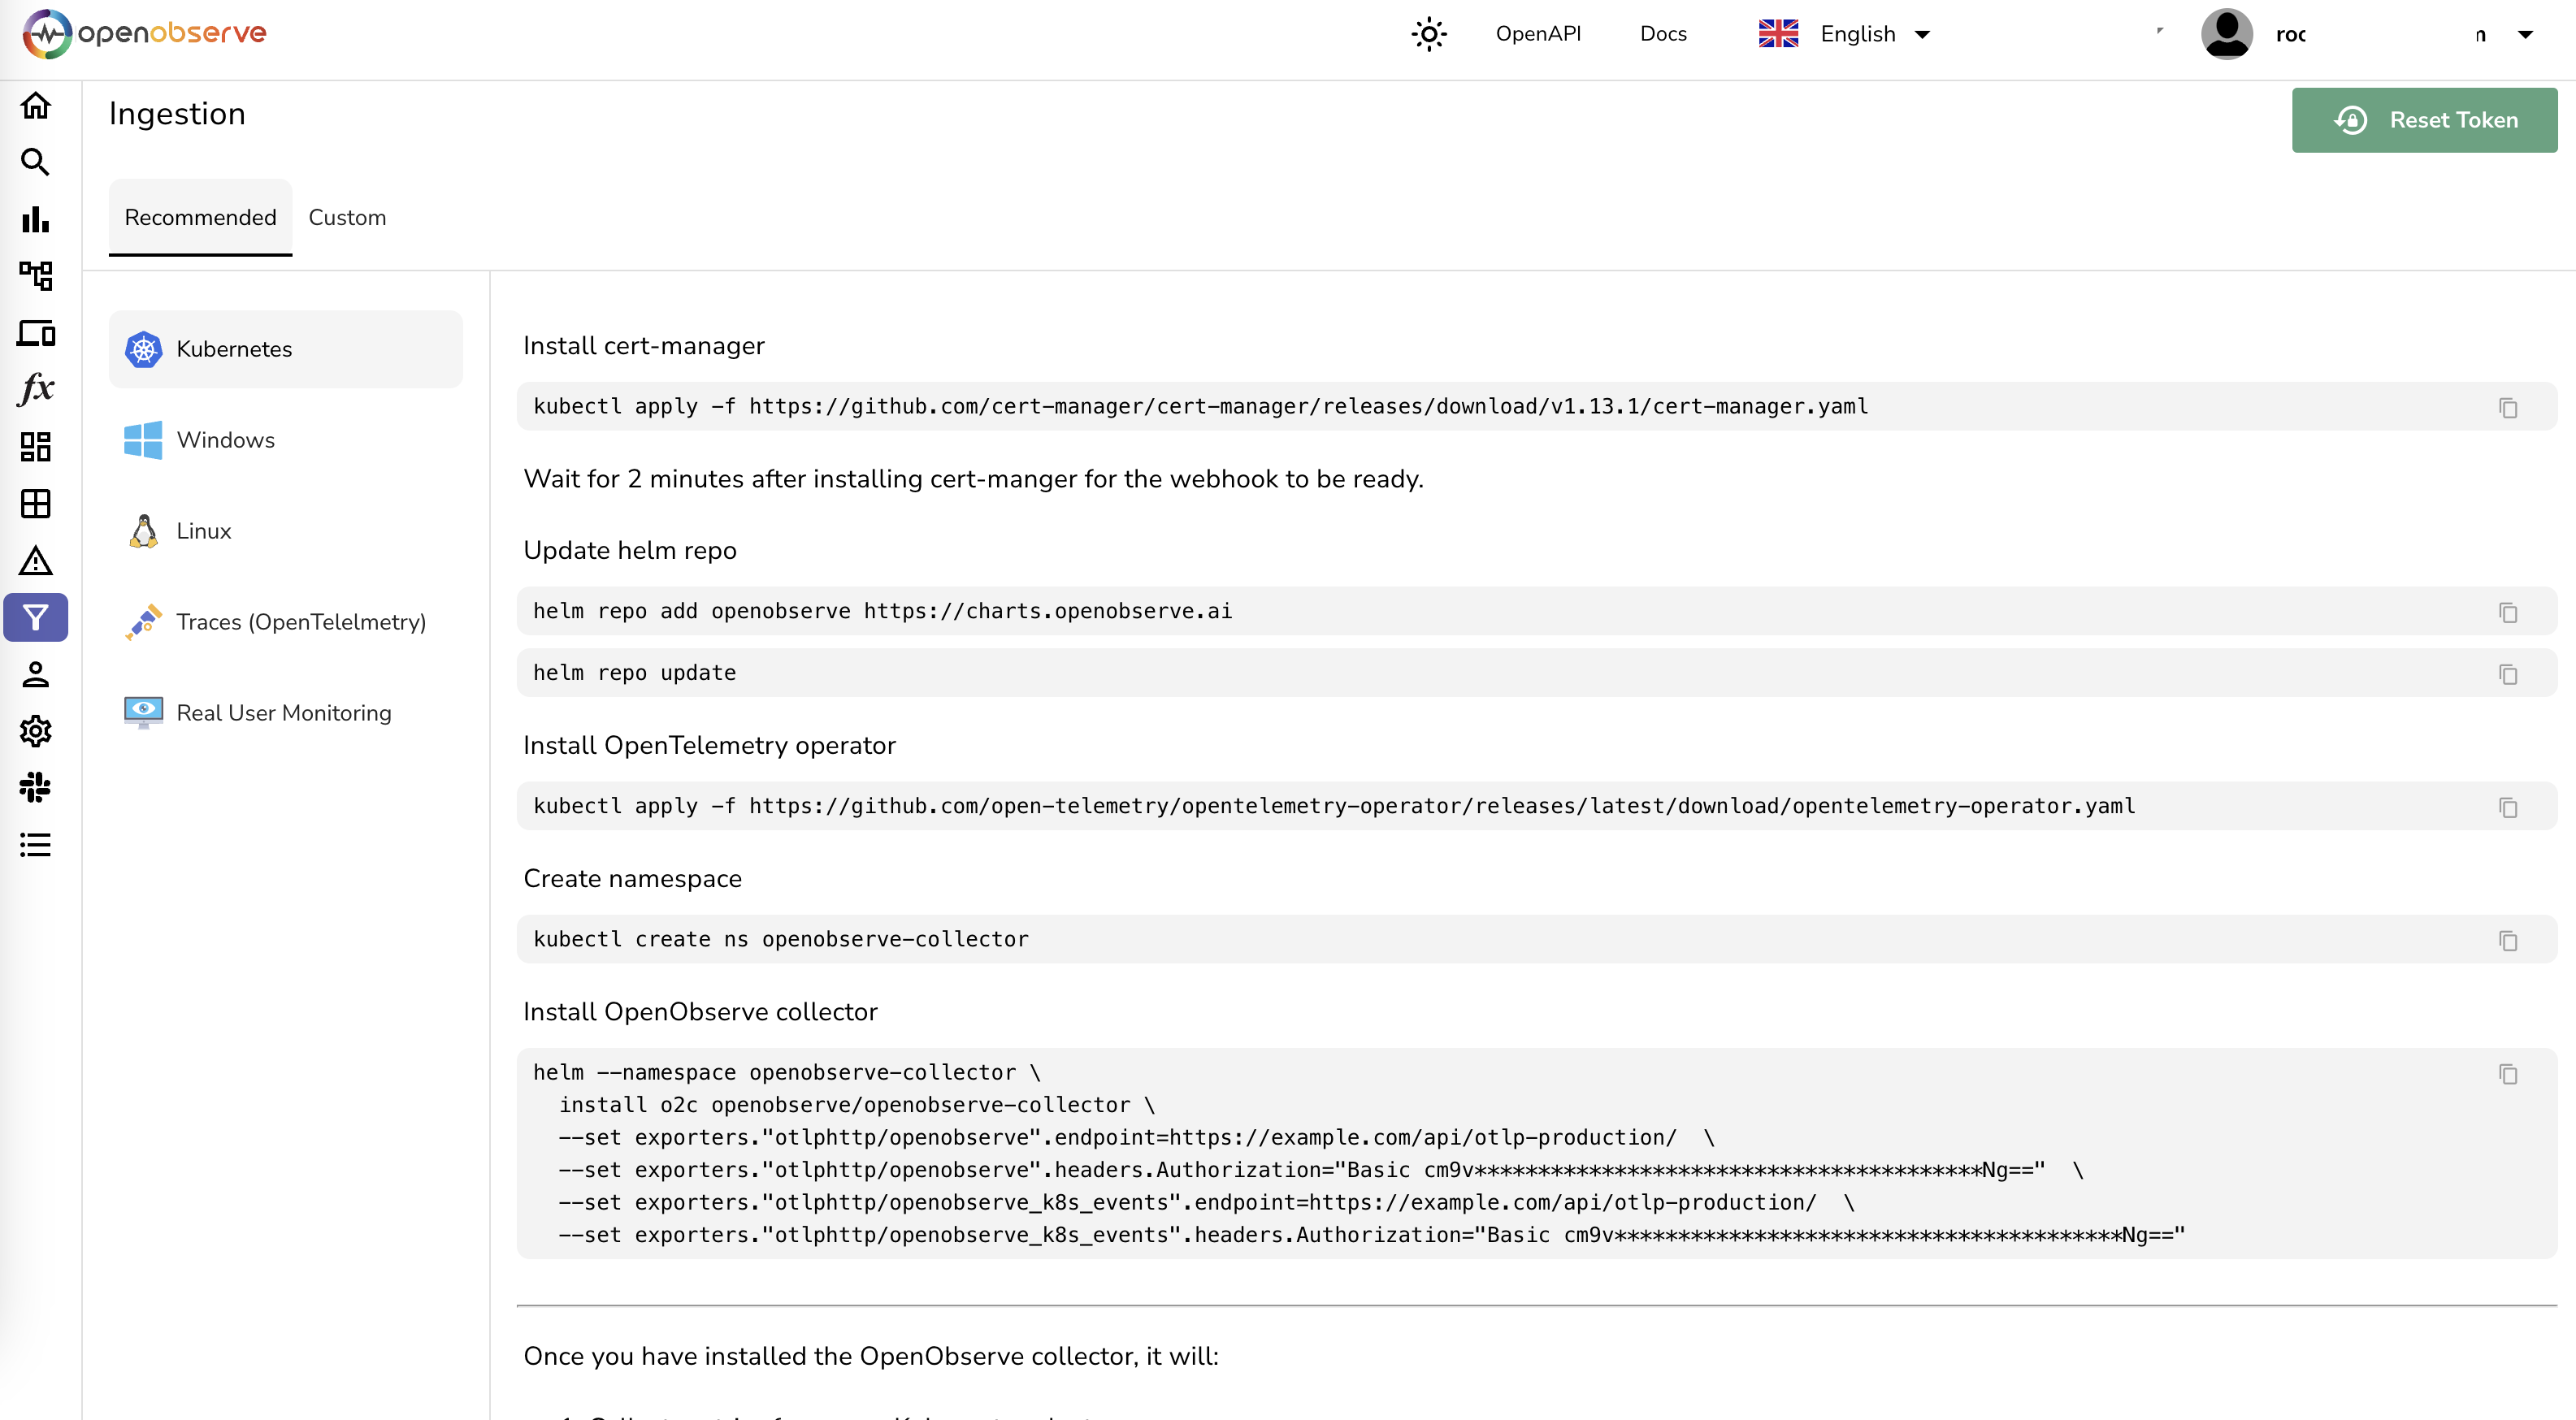
- OpenTelemetry Support: Full compatibility with OTLP for logs, metrics, and traces.
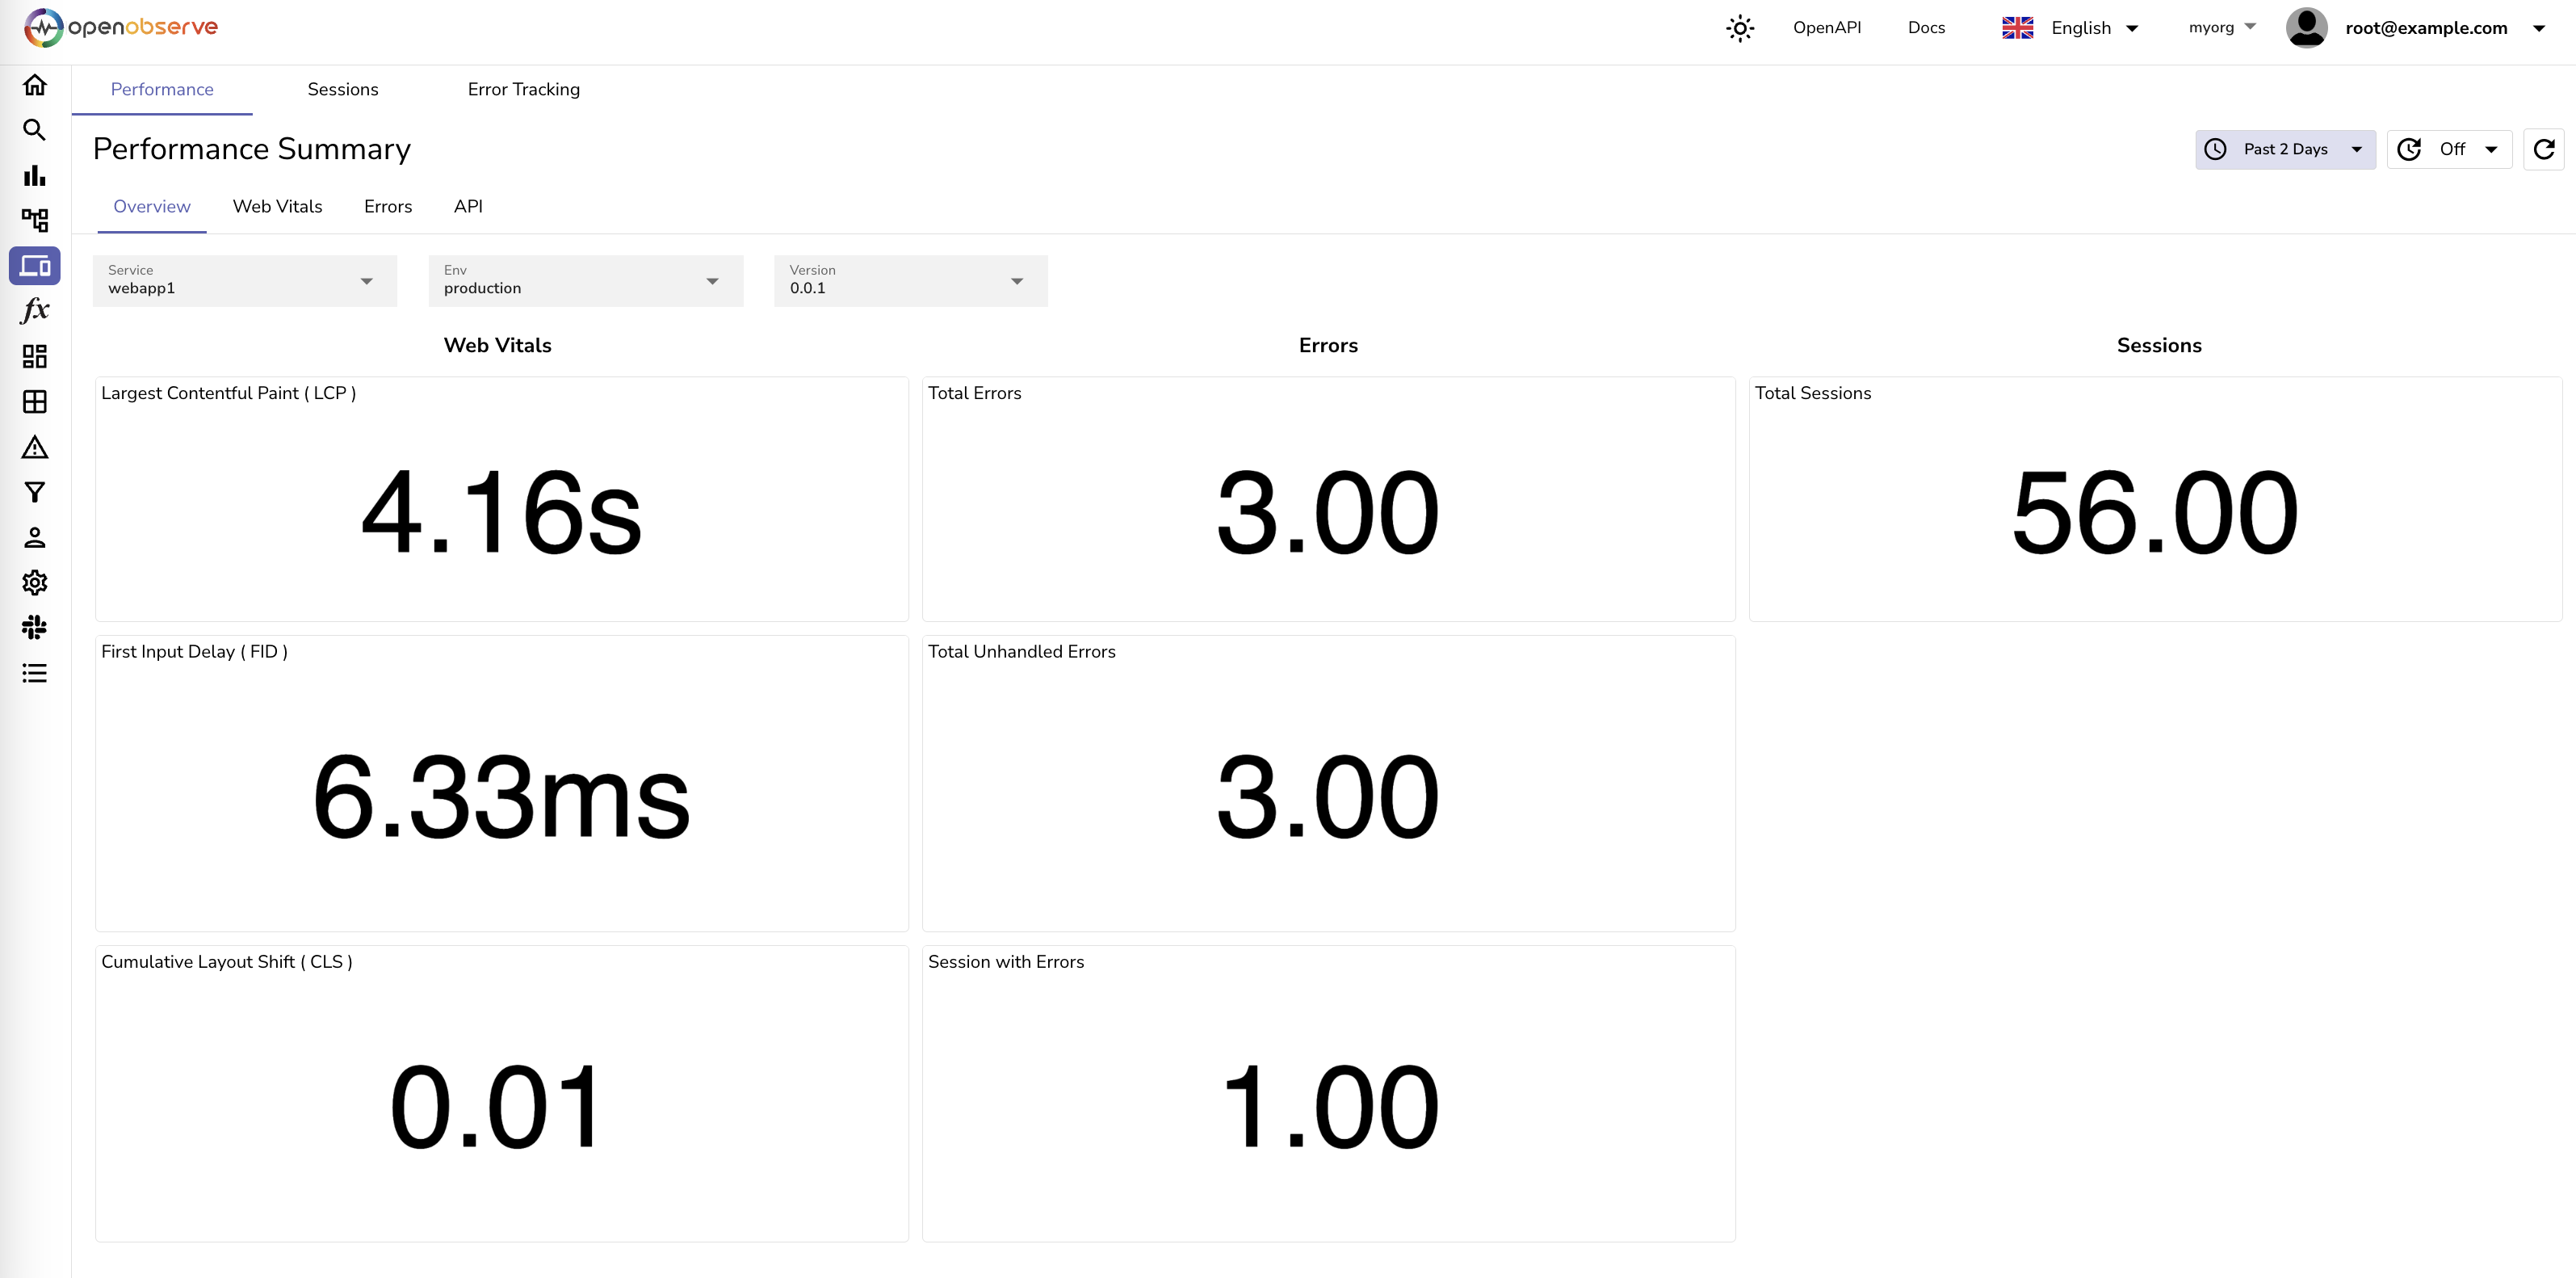
- Real User Monitoring (RUM): Includes performance tracking, error logging, and session replay.
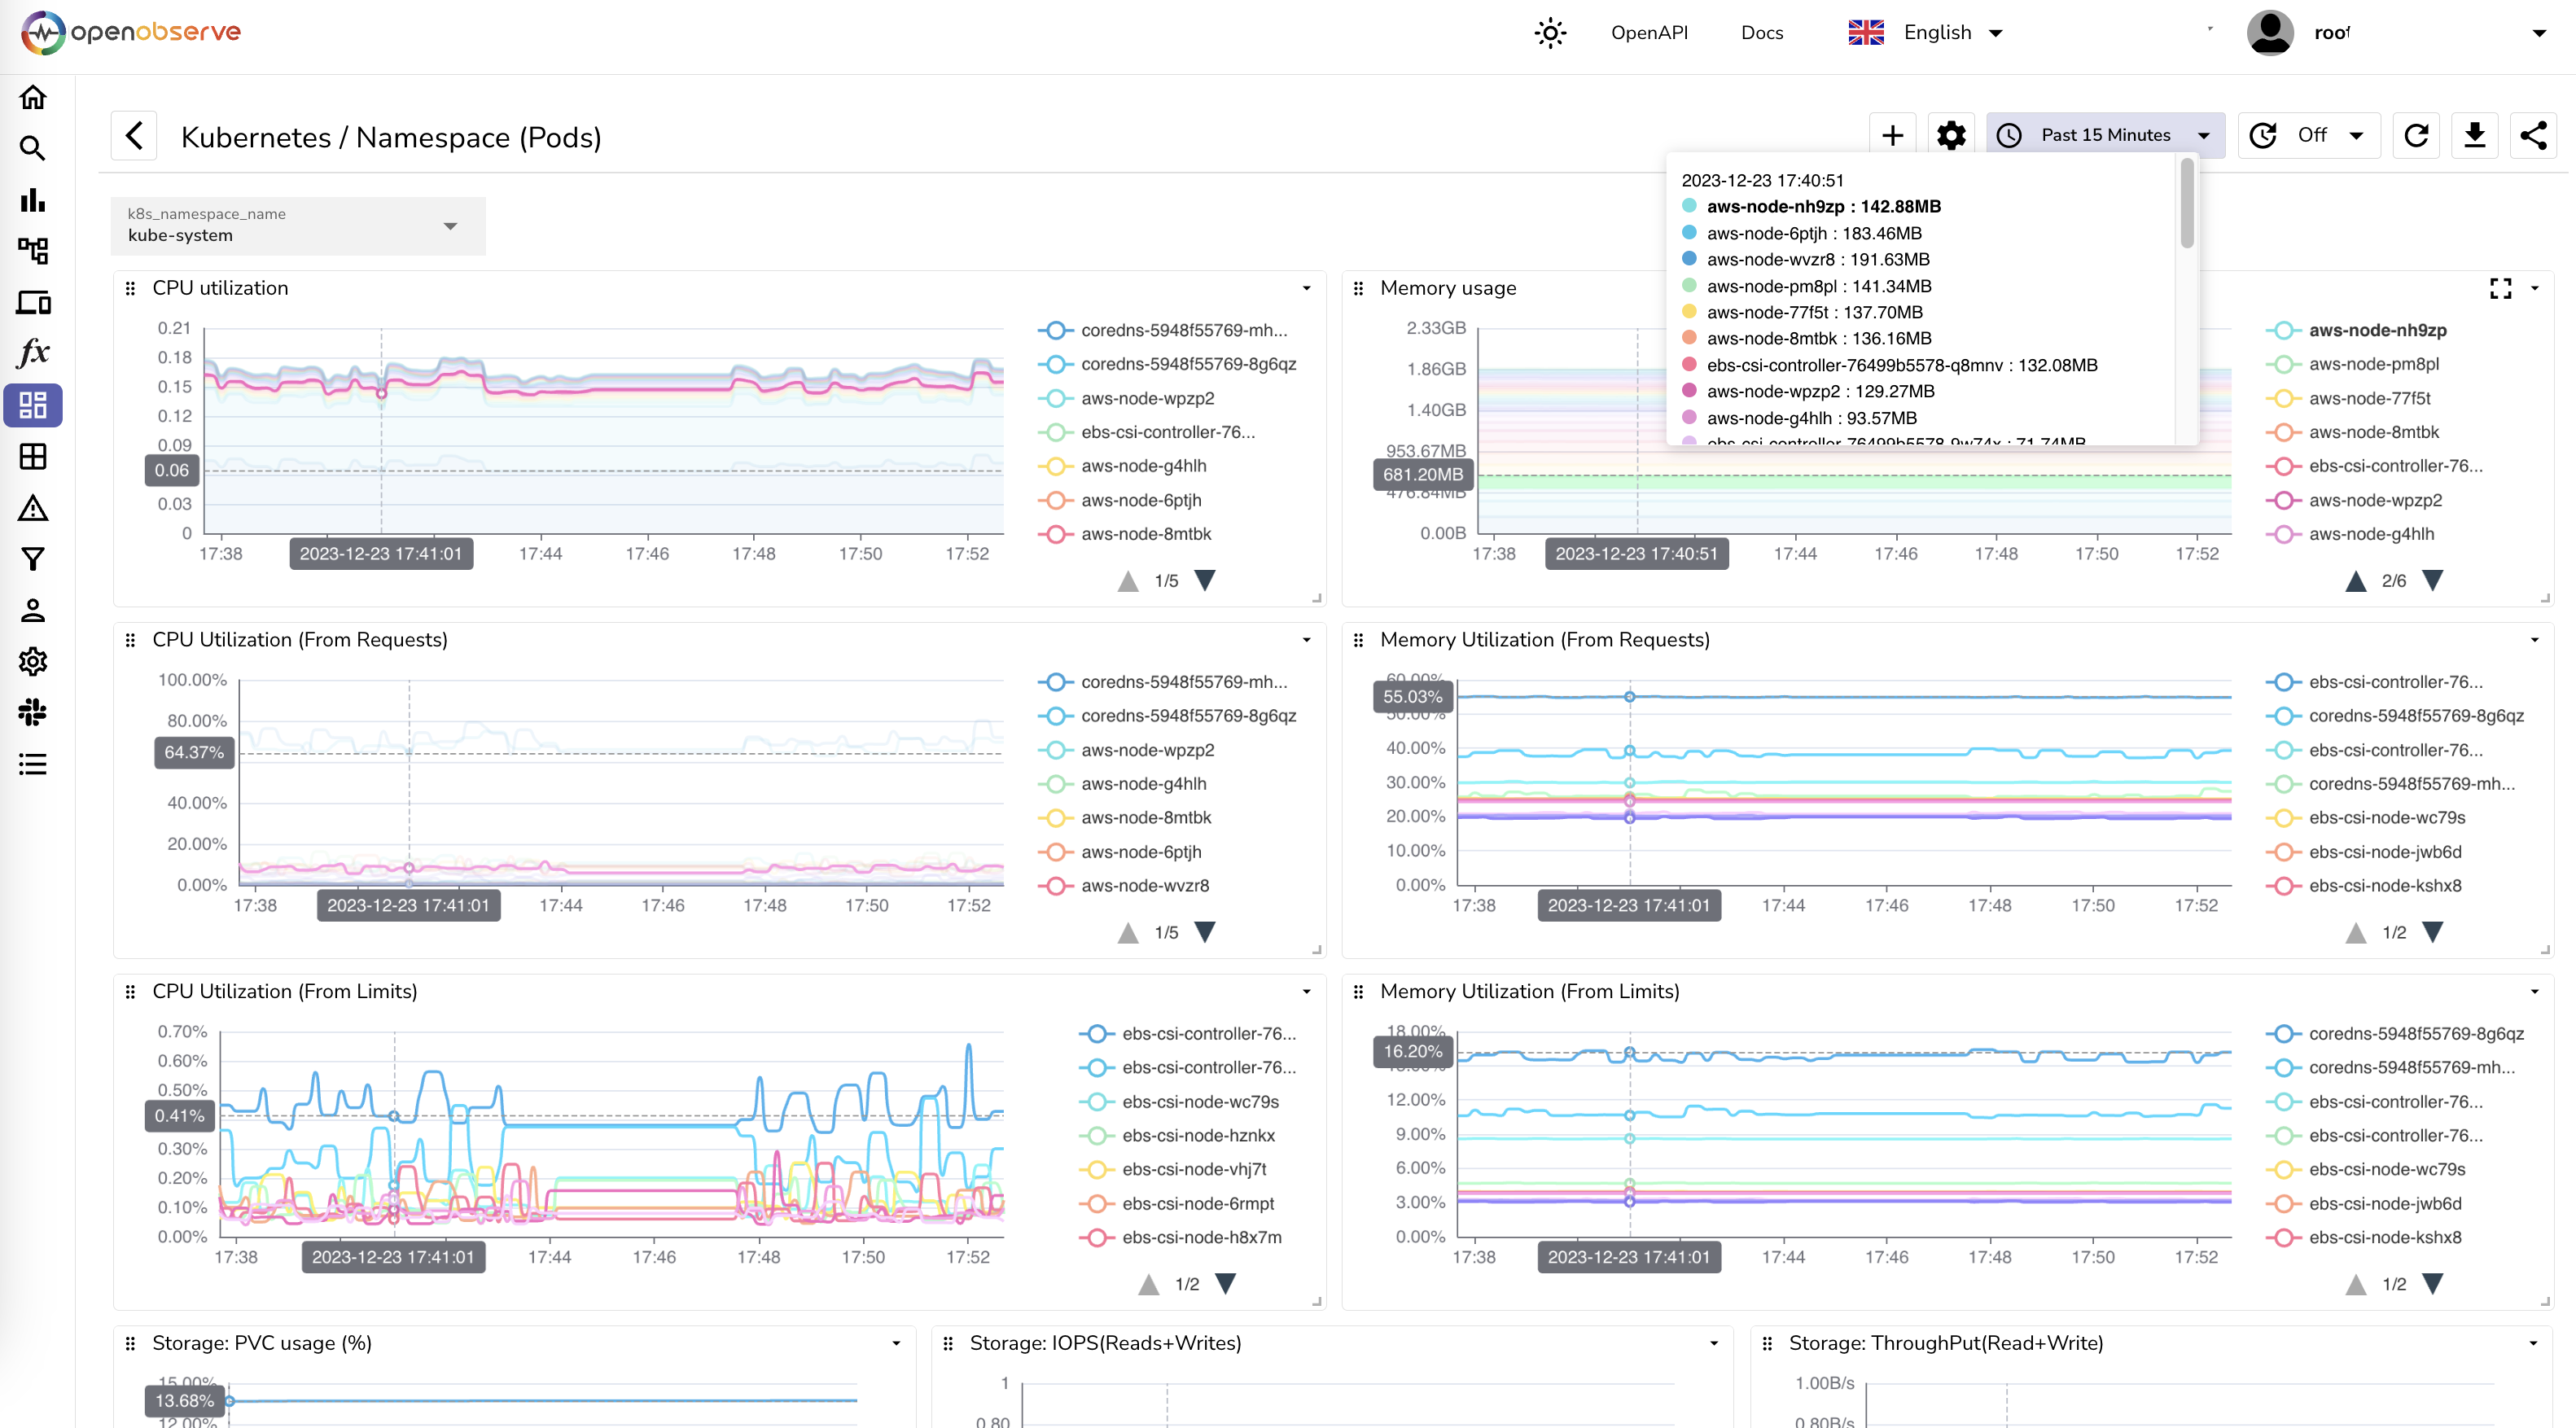
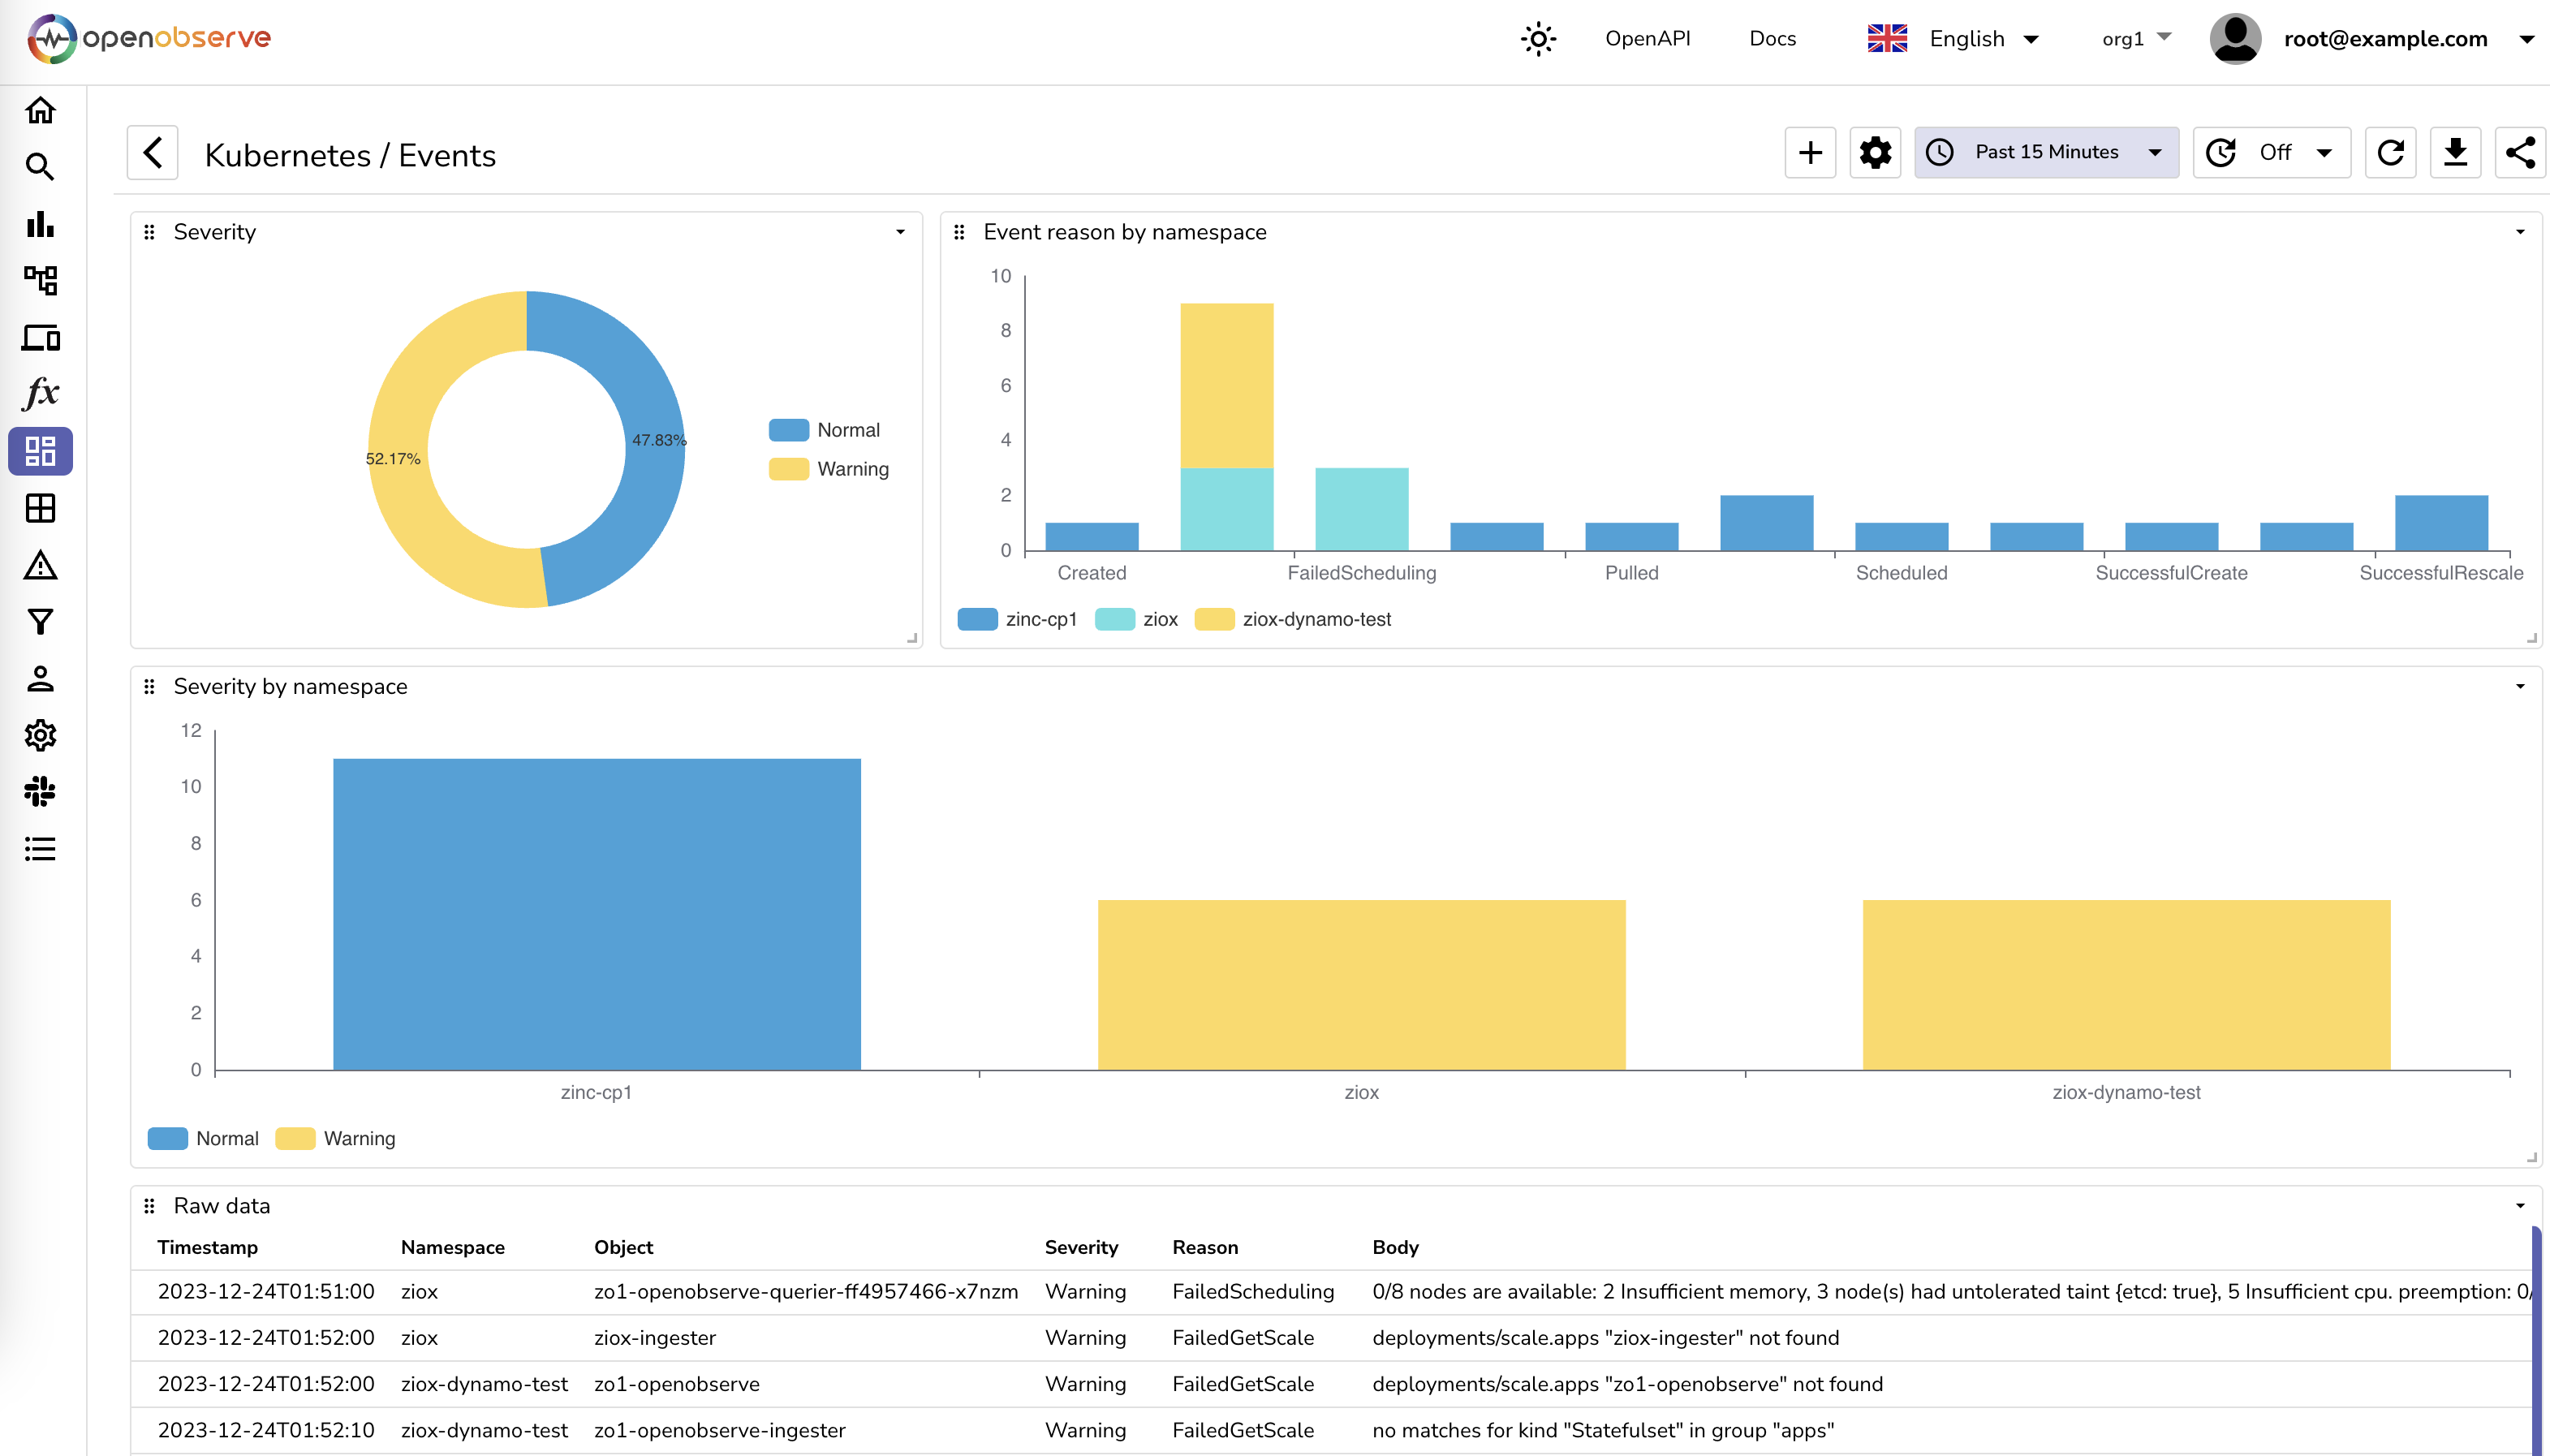
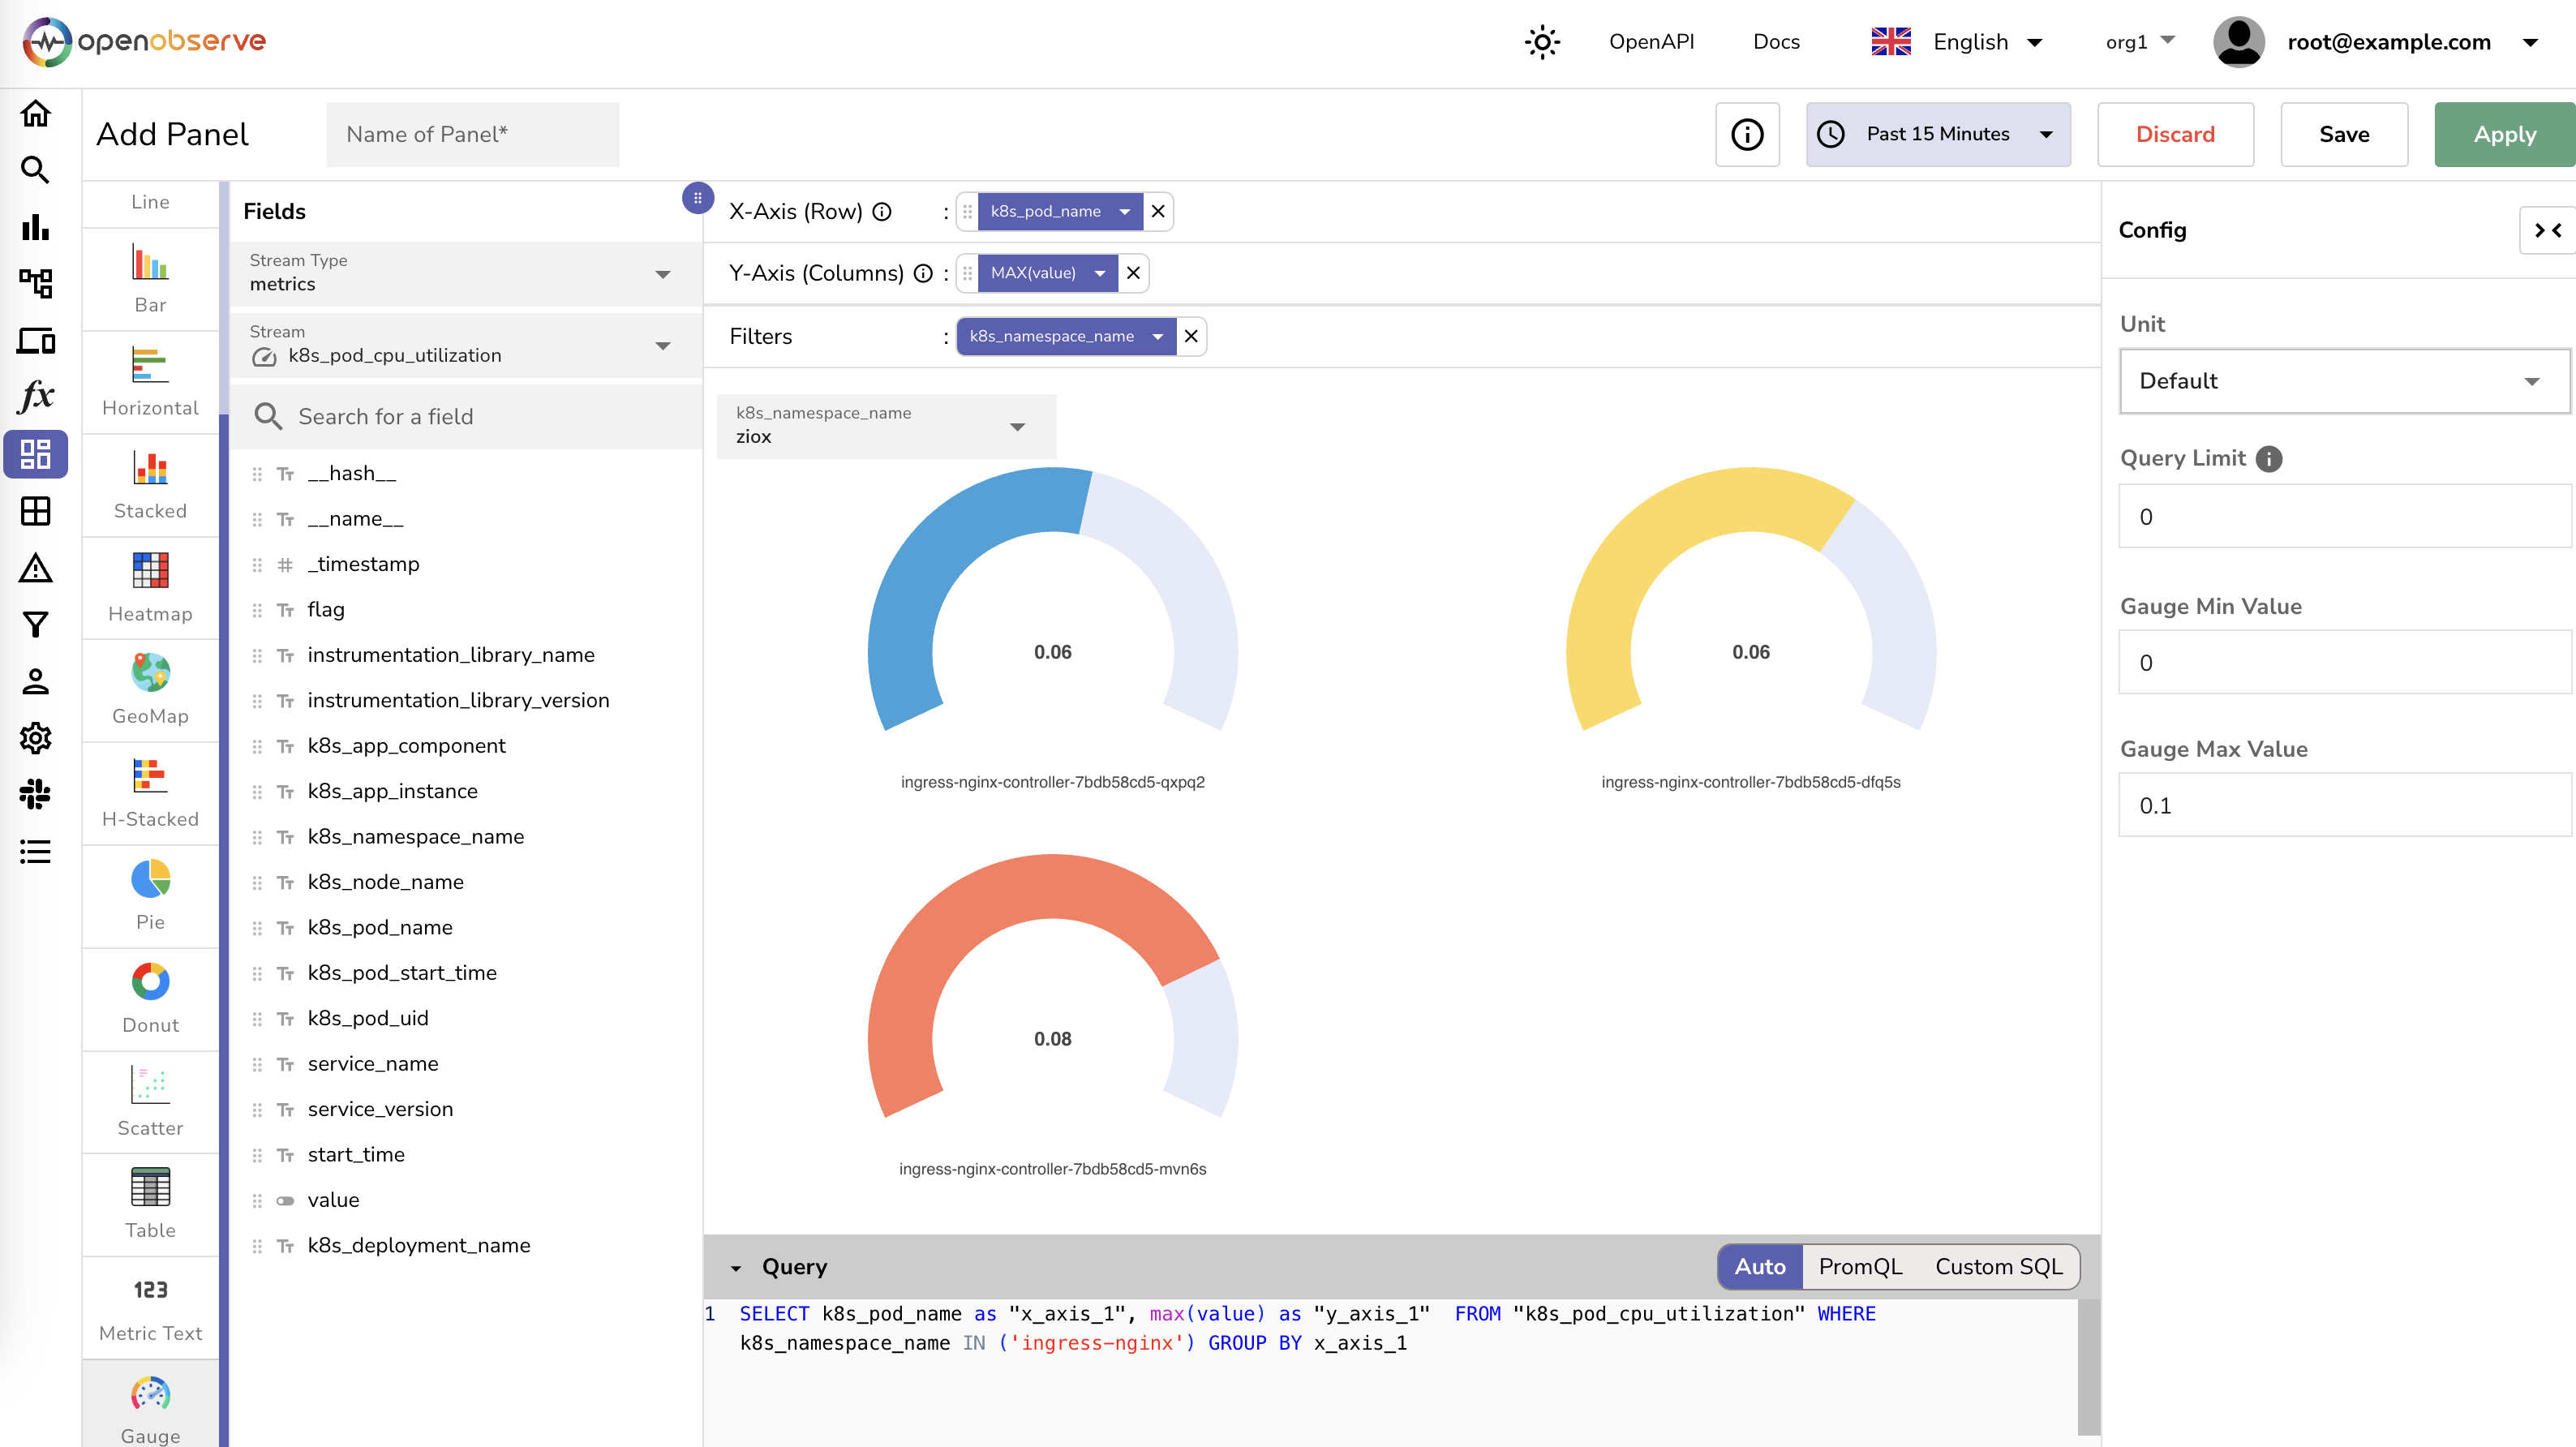
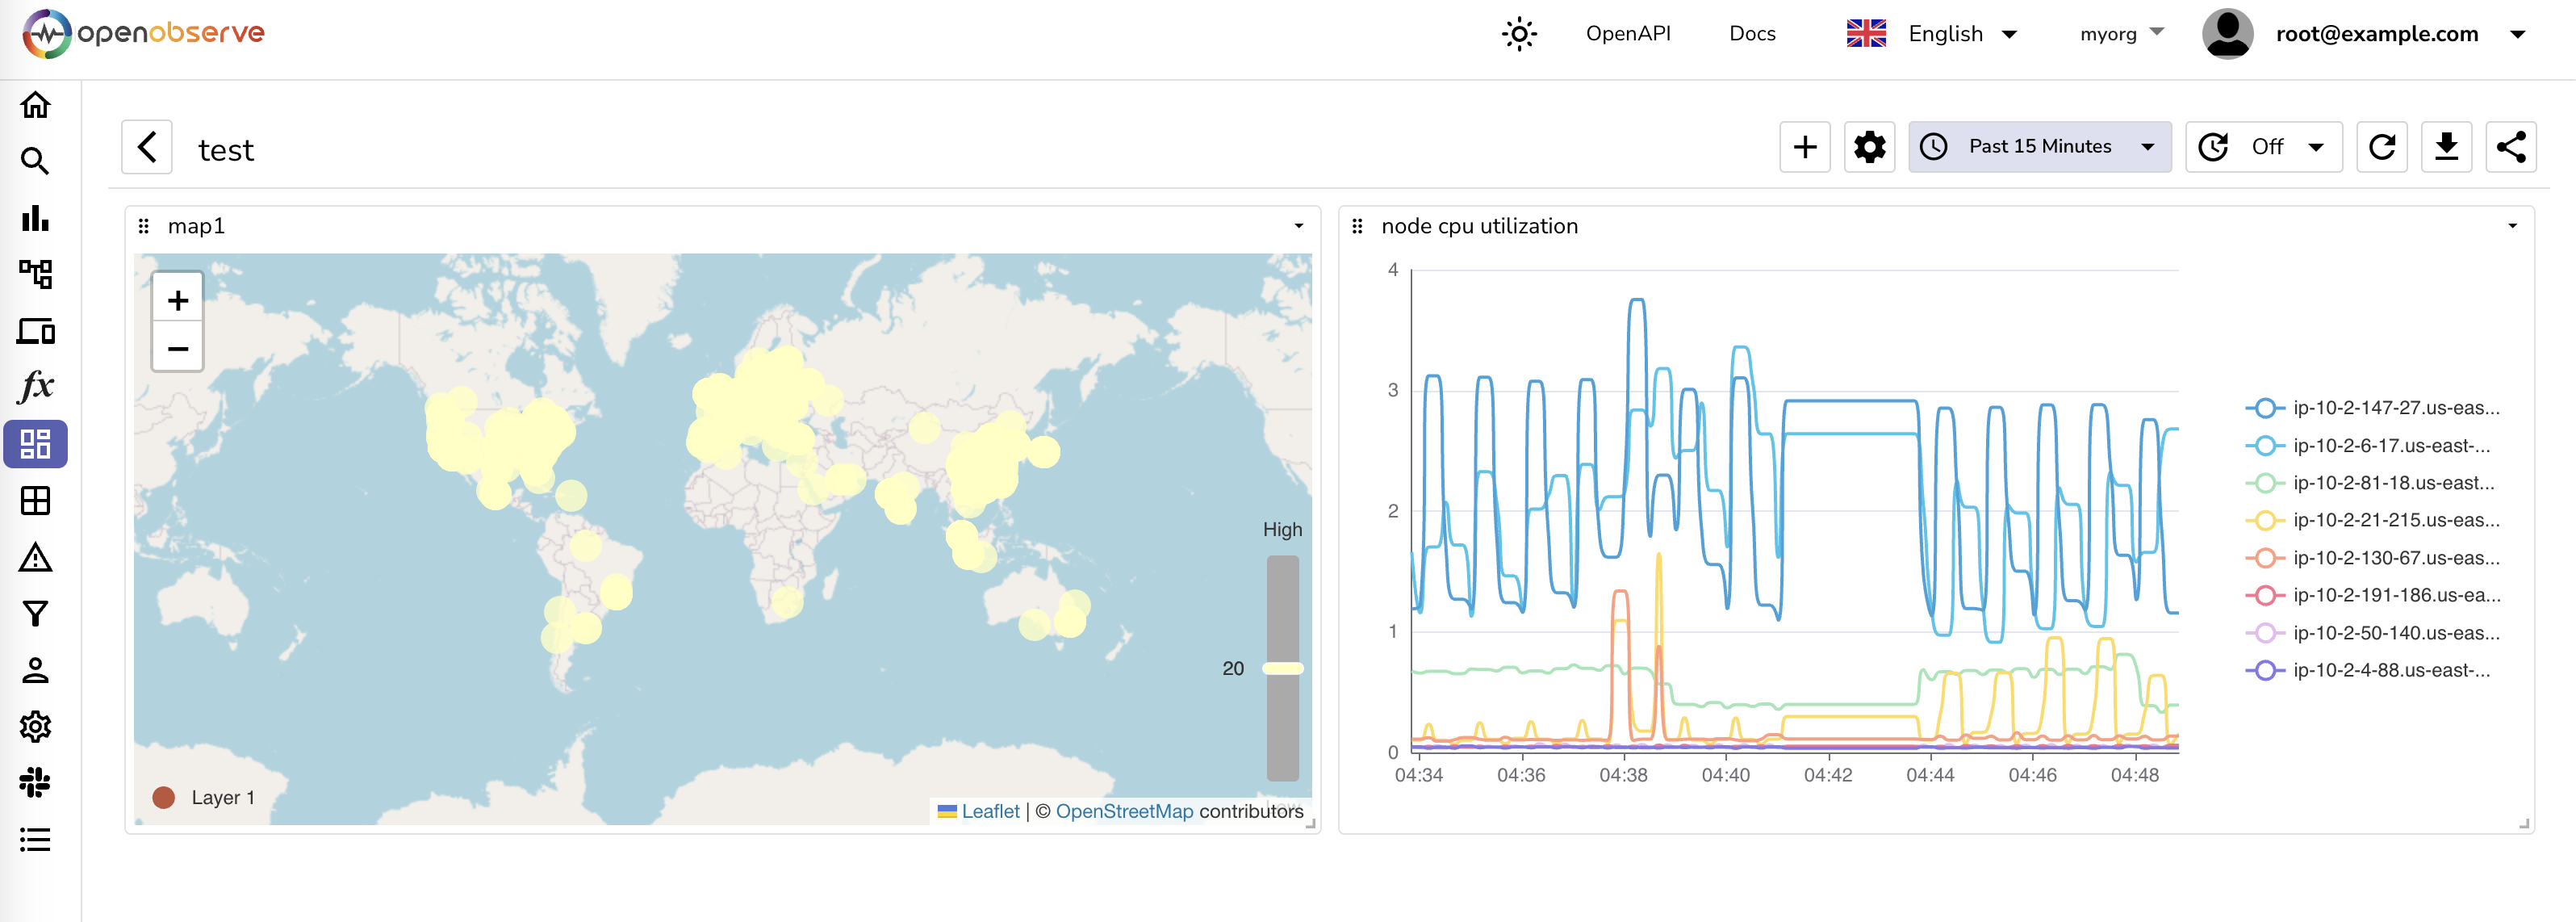
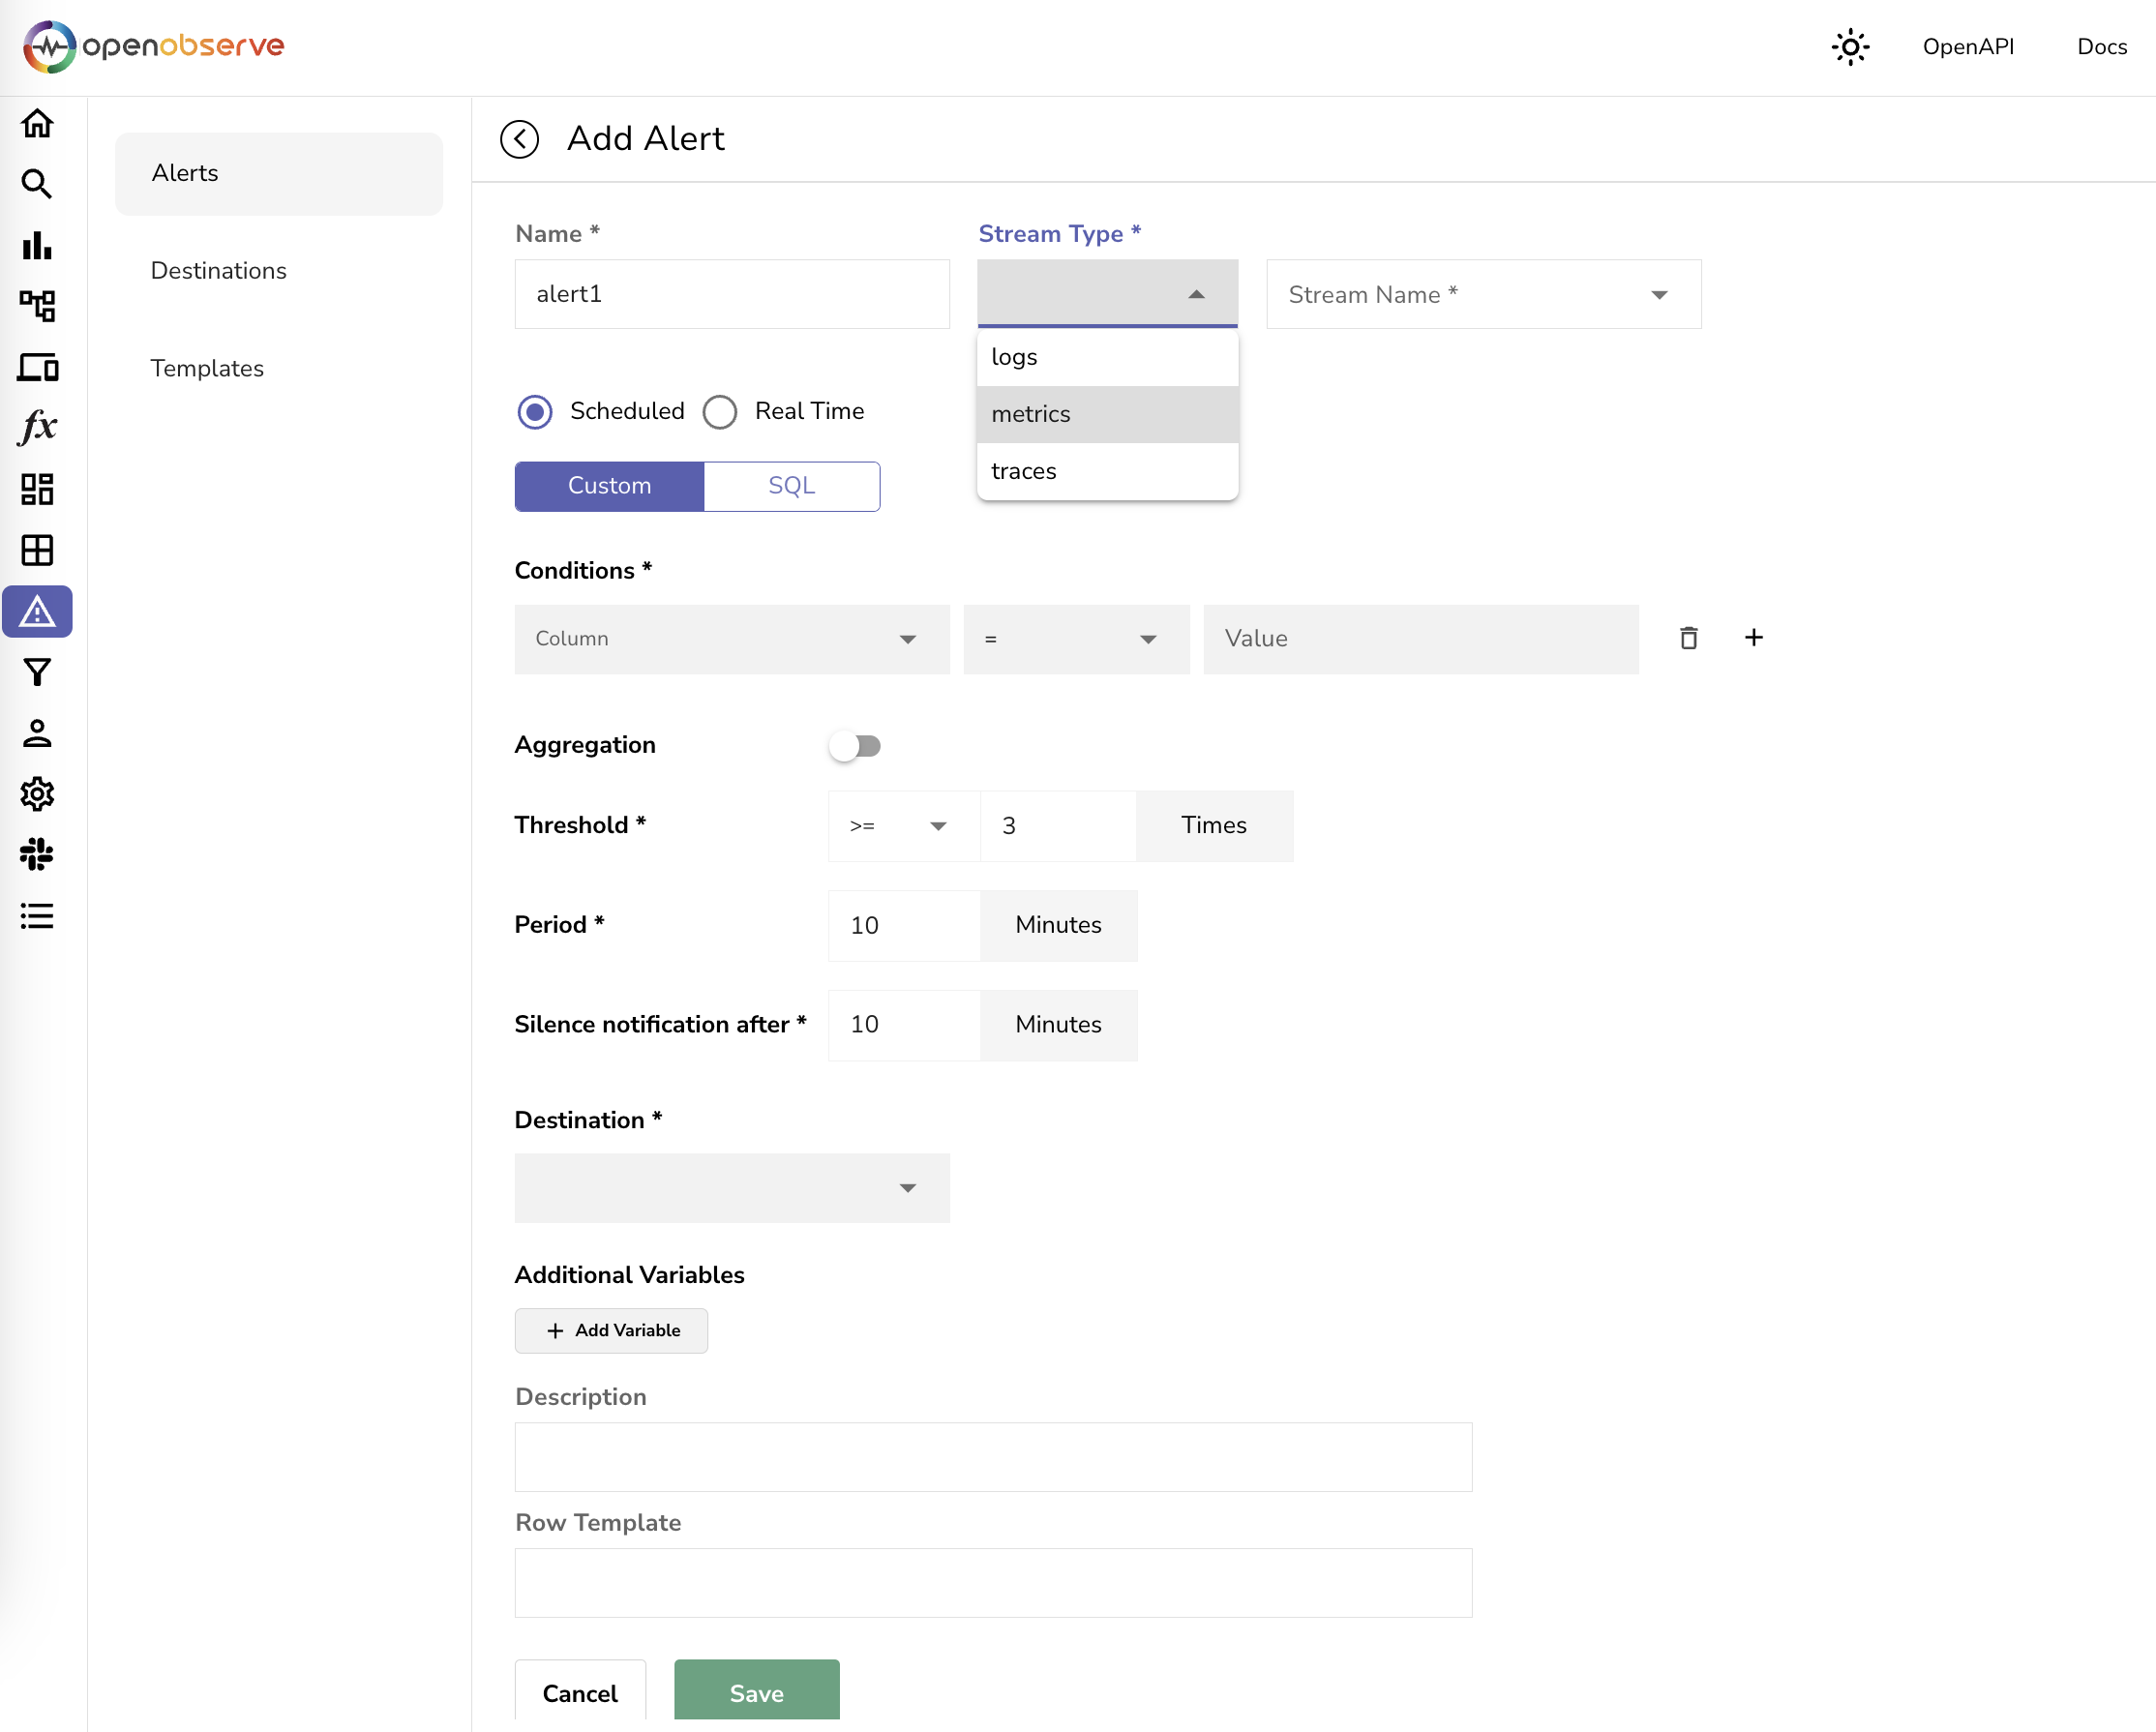
- Alerts & Dashboards: Features over 14 different chart types for comprehensive data visualization.
- Advanced Ingest and Query Functions: Aid in enrichment, redaction, log reduction, and compliance, like redacting sensitive data from logs.
- Advanced Embedded GUI: Intuitive and user-friendly interface.
- SQL and PromQL Support: Query logs and traces with SQL, and metrics with SQL and PromQL.
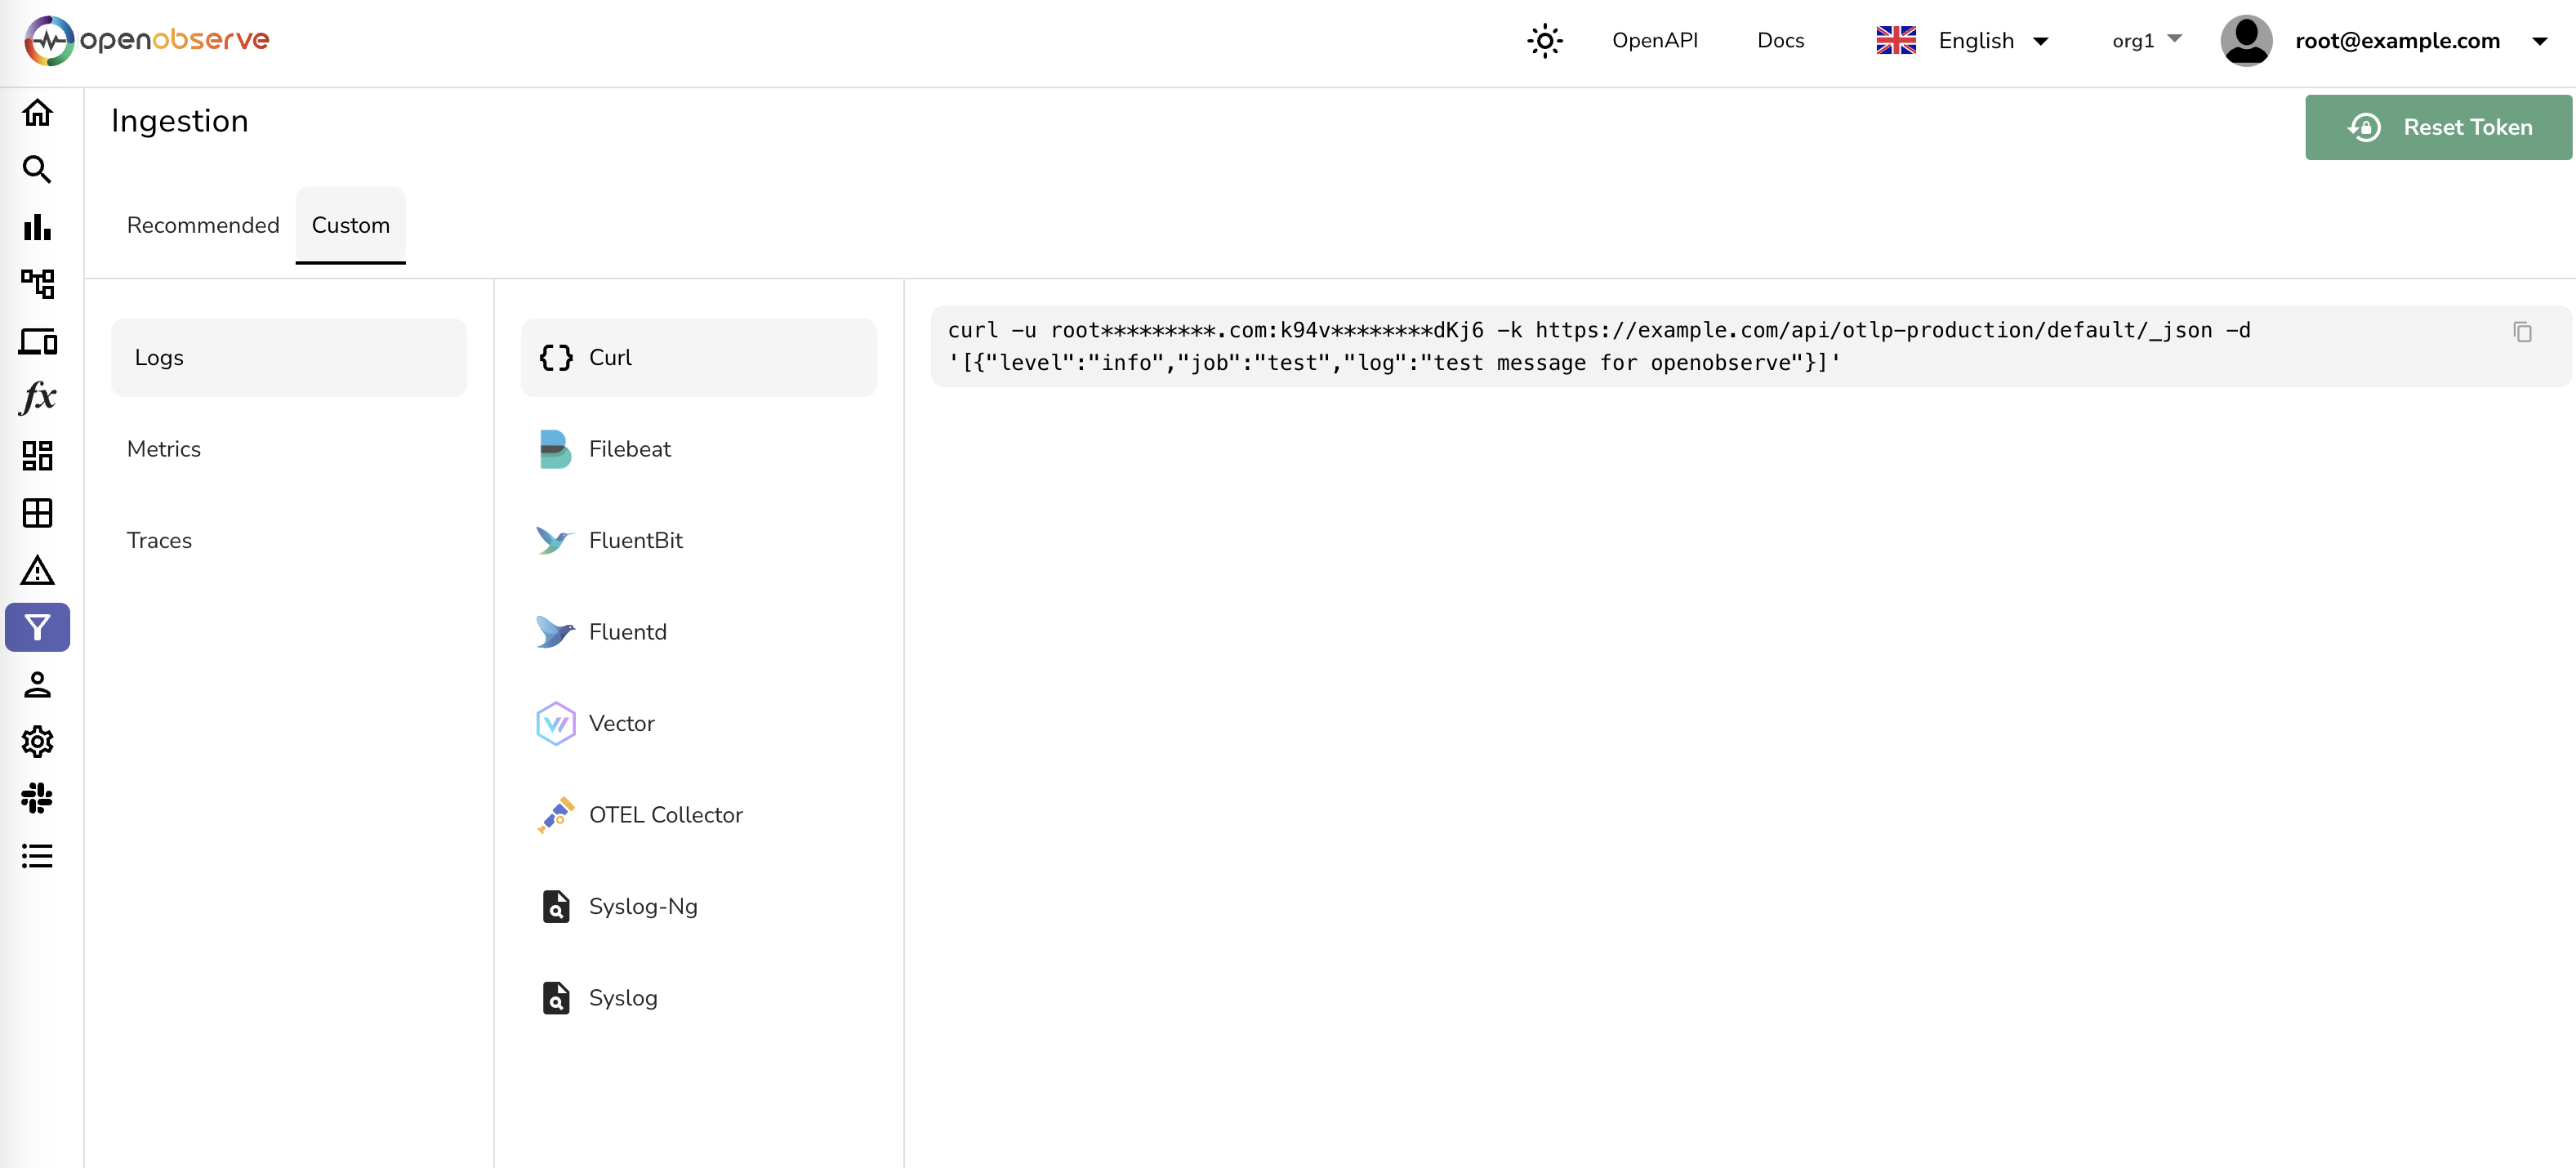
- Single Binary Installation: Easy installation and running, with binaries available for multiple platforms under releases.
- Versatile Storage Options: Supports local disk, S3, MinIO, GCS, Azure Blob Storage.
- High Availability and Clustering: Ensures reliable and scalable performance.
- Dynamic Schema: Adapts to your data structure seamlessly.
- Built-in Authentication: Secure and ready to use.
- Ease of Operation: Designed for simplicity and efficiency.
- Seamless Upgrades: Hassle-free updates.
- Multilingual UI: Supports 11 languages, including English, Spanish, German, French, Chinese, and more.
For a full list of features, check the documentation.
docker run -d \
      --name openobserve \
      -v $PWD/data:/data \
      -p 5080:5080 \
      -e ZO_ROOT_USER_EMAIL="root@example.com" \
      -e ZO_ROOT_USER_PASSWORD="Complexpass#123" \
public.ecr.aws/zinclabs/openobserve:latestservices:
openobserve:
image: public.ecr.aws/zinclabs/openobserve:latest
restart: unless-stopped
environment:
ZO_ROOT_USER_EMAIL: "root@example.com"
ZO_ROOT_USER_PASSWORD: "Complexpass#123"
ports:
- "5080:5080"
volumes:
- data:/data
volumes:
data:For other ways to quickly install OpenObserve or use OpenObserve cloud, check quickstart documentation.
For installing OpenObserve in HA mode, check HA deployment documentation.
OpenObserve is available in three different editions:
| Feature | Open Source (Self hosted) | Enterprise (Self hosted) | Cloud |
|---|---|---|---|
| Logs | ✅ | ✅ | ✅ |
| Metrics | ✅ | ✅ | ✅ |
| Traces | ✅ | ✅ | ✅ |
| RUM | ✅ | ✅ | ✅ |
| Alerts | ✅ | ✅ | ✅ |
| Dashboards | ✅ | ✅ | ✅ |
| Reports | ✅ | ✅ | ✅ |
| VRL functions | ✅ | ✅ | ✅ |
| Pipelines | ✅ | ✅ | ✅ |
| High Availability | ✅ | ✅ | ✅ |
| Multitenancy (Organizations) | ✅ | ✅ | ✅ |
| Dynamic schema and schema evolution | ✅ | ✅ | ✅ |
| Advanced multilingual GUI | ✅ | ✅ | ✅ |
| Single Sign On | ❌ | ✅ | ✅ |
| Role Based Access Control (RBAC) | ❌ | ✅ | ✅ |
| Federated search / Super cluster | ❌ | ✅ | ❌ |
| Query management | ❌ | ✅ | ❌ |
| Workload management (QoS) | ❌ | ✅ | ❌ |
| Audit trail | ❌ | ✅ | ❌ |
| Ability to influence roadmap | ❌ | ✅ | ✅ on enterprise plan |
| License | AGPL | Enterprise | Cloud |
| Support | Community | Enterprise | Cloud |
| Cost | Free | If self hosted, free for up to 200 GB/Day data ingested Paid thereafter |
Free 200 GB/Month data ingested Paid thereafter |
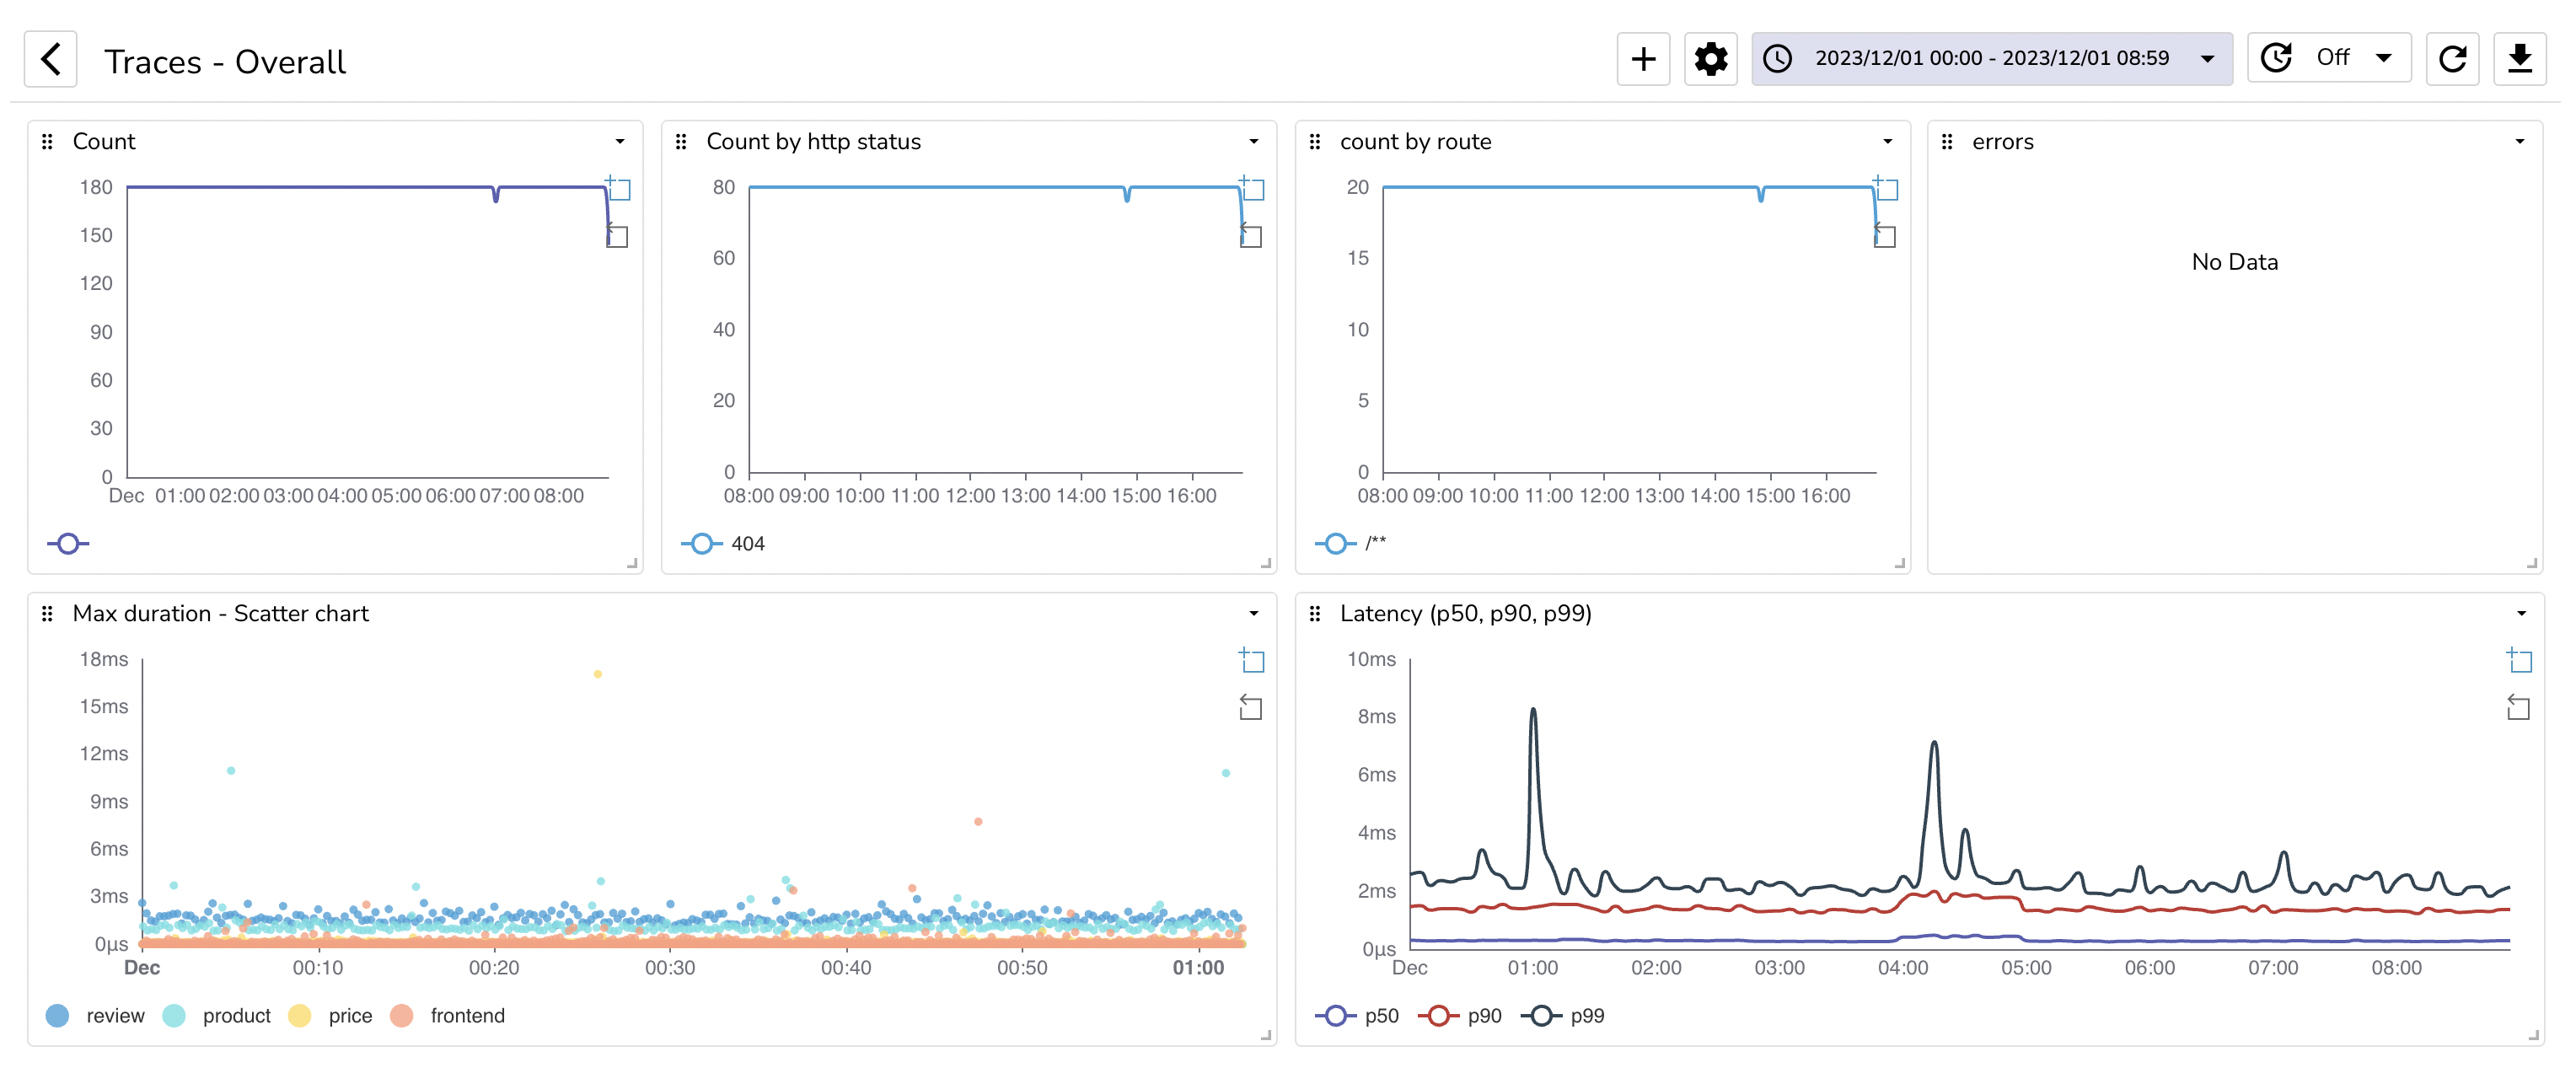
Golden metrics based on traces
Software Bill of Materials for OpenObserve
SBOM can be found here. You can analyze it using dependency track.
In order to generate the SBOM, you can use the following commands:
Install cargo-cyclonedx:
cargo install cargo-cyclonedxGenerate the SBOM:
cargo-cyclonedx cyclonedxSBOM can be found here. You can analyze it using dependency track.
In order to generate the SBOM, you can use the following commands:
Install cyclonedx-npm:
npm install --global @cyclonedx/cyclonedx-npmGenerate the SBOM:
cd web
cyclonedx-npm > sbom.json OpenObserve is licensed under the AGPL-3.0 license. For more details, see the LICENSE.
Easiest way to get support is to join the Slack channel.


