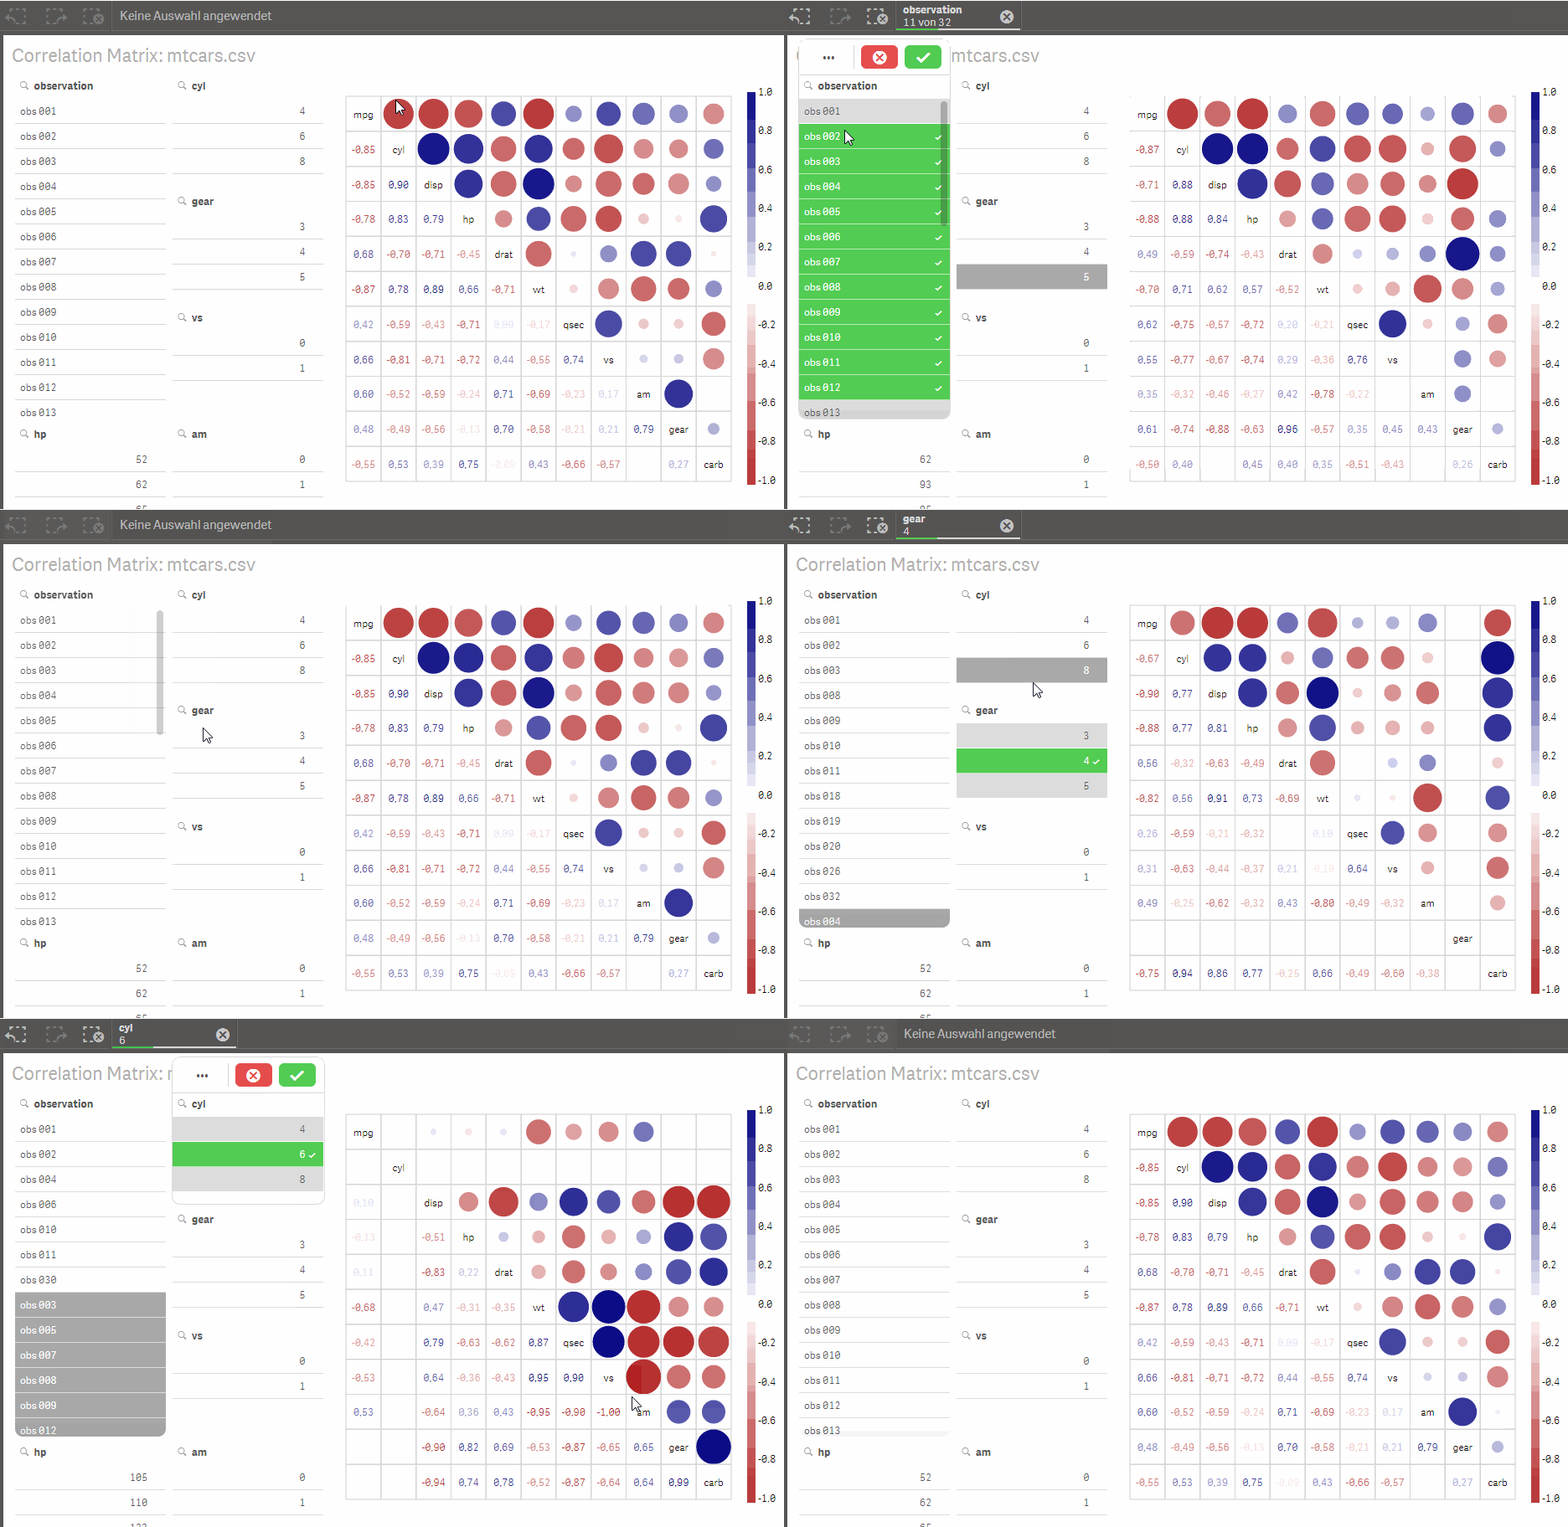
This extension visualizes correlation between all dimensions like in R using a dynamical created hypercube with n-measures for Qlik Sense function Correl() on all field combinations (amount: n*(n-1)/2). First dimension is always a grouping dimension and not a value. At least two value dimensions needs to be used for one correlation.
Built with d3.js, published with the MIT open-source license.
The example app uses the R built-in data set mtcars. This example creates 55 measures in the hypercube.
Ralf Becher
Copyright © 2017 Ralf Becher
Released under the MIT license.
