This open source Qlik Sense extension is discontinued since it became a commercial product of TIQ Solutions.
You can find the supported version with more features on the Vizlib Marketplace.
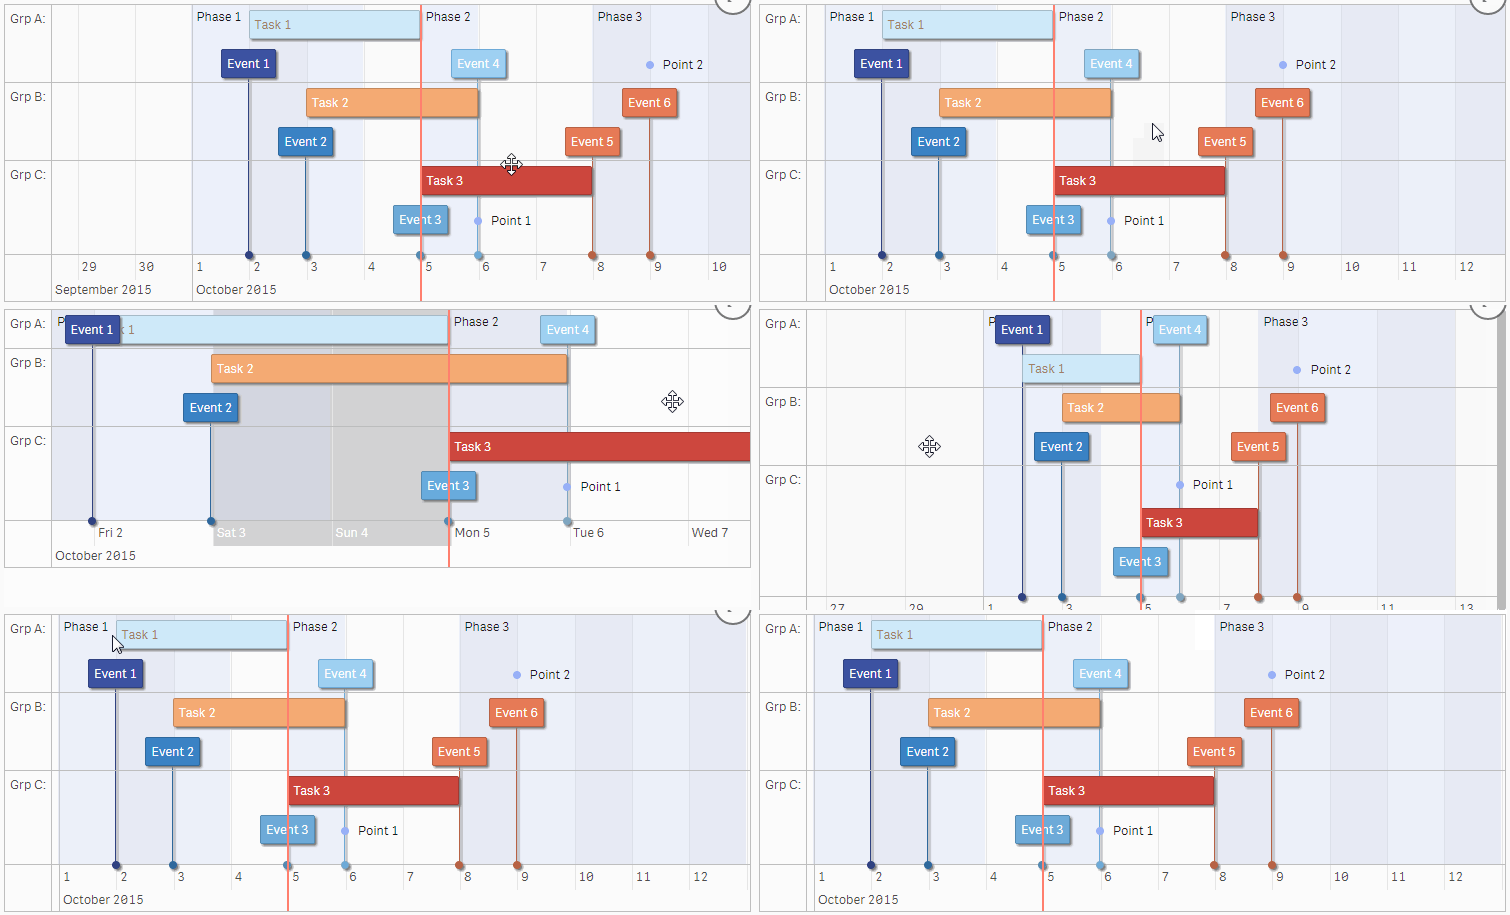
This extension implements vis.js timeline http://visjs.org/docs/timeline/. It is an interactive chart to visualize data items in time. The items can take place on a single date, or have a start and end date (a range). You can freely move and zoom in/out the timeline by dragging and scrolling.
Now with proper localization and adjustable weekend:
- Dimension: Reference ID, numeric (Event ID or else) or String
- Dimension: Item Content, text
- Dimension: Start Date
- Dimension: End Date (optional, null if omitted)
- Dimension: Item Type (box (default), point, range, background)
- Measure: title text for hover popup (optional), default title is start date, use
<br>for line breaks - Measure: CSS class name for styling or number 1 to 10 for CSS class color-a to color-j which are configured for Qlik Sense diverging colors (blue-to-red, optional)
- Measure: group name to group items in "swim lanes" (optional)
- Axis Orientation: top, bottom (default), both, none
- Item orientation: top, bottom (default)
- Stack Items : stack items on top of each other such that they do not overlap (default: true)
- Group Sorting : Ascending, Descending
- Localization : choose local for localized date and timestamp formatting (default: en-gb)
- Mark Weekend : apply CSS class for background color of weekend (when zoomed-in), press F5 after change and save (default:true)
- Weekend Days : choose local weekend days (default: Saturday-Sunday), press F5 after change and save
- Reverse Color : reverse Qlik Sense diverging color (red-to-blue)
- Apply CSS for Background : apply CSS class to background items (default: true)
- max. Items to render: maximum items to render (default: 100), a large amount of items (if nothing is selected) needs much time, this limits the amount
- max. Items to render: limit data records to display (default: 100)
- Fit all events in window: zooms out to fit all events into visible window
- Move focus to time: move focus to given time (eg. =now(1), default: 0, no focus)
- Rolling Mode : moves timeline so that current time is always centered (default: false)
- Visible range min.: limit visible date range mininum by numerical Qlik date or expression (default: 0, no min. date)
- Visible range max.: limit visible date range maximum by numerical Qlik date or expression (default: 0, no max. date)
- Zoom min.: minimum zoom resolution in days, 1/24 = 1 hr (default: 0, no minimum)
- Zoom max.: maximum zoom resolution in days, 31 = 1 month (default: 0, no maximum)
Ralf Becher
Copyright © 2015 Ralf Becher
Released under the MIT license.
