- To show the accuracy Cart Trees, Random Forest and Cross Validation.
- To choose the best approach of prediction of students’ performance.
- To make the conclusion.
Summary of the best CART TREE model. The ACCURACY of the model 68%. Noticeably, the variable VisitedResourses is highly significant, however ParentsSatisfaction level is almost insignificant.
Summary of the best CART TREE model, which were improved by CROSS VALIDATION. The ACCURACY of the model 71%. As you can see, the accuracy of the model has been improved. CP = 0.015.
Summary of the best RANDOM FOREST model.�The ACCURACY of the model 76%. Unfortunately, Random forest can not predict as exactly as it did before
| Accuracy | 0.7655 |
|---|---|
| 95% CI | (0.6476392, 0.8115522) |
| No Information Rate | 0.4380165 |
| P-Value [Acc > NIR] | < 2.2e-16 |
| Kappa | 0.6509571 |
Neuralnet:
One of the most important procedures when forming a neural network is data normalization. This involves adjusting the data to a common scale so as to accurately compare predicted and actual values. Failure to normalize the data will typically result in the prediction value remaining the same across all observations, regardless of the input values.
Deciding on the number of hidden layers in a neural network is not an exact science. In fact, there are instances where accuracy will likely be higher without any hidden layers. Therefore, trial and error plays a significant role in this process.
In our example there are 2 hidden layers:
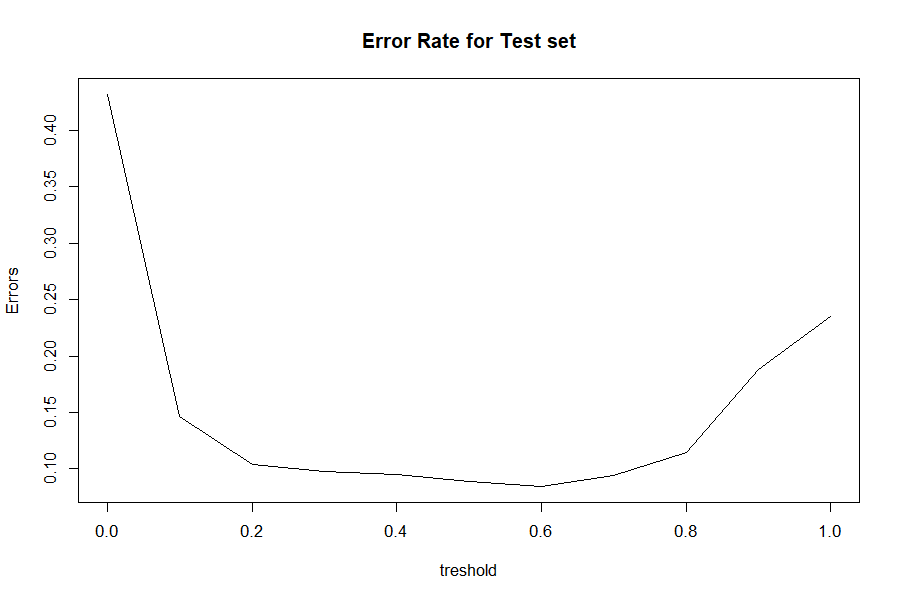
In order to identify ideal threshold fot the neuralnet, it is needed to devided our data to training and test datasets. There are 10 training and 10 test datasets. Best Threshold is 0.4
The key indicators to watch out for are:
- If a student is absent under 7 days, he will get at least medium GPA.
- If a student rises hand more than 54 times and his relation is mother or visits additional recourses more that 88 times, he will achieve high GPA.
- If a student visits less that 28 recourses, he will get low GPA


