Optimization Report
Trial #1 (Minify Javascript Files)
Description: On using Lighthouse tool to audit our application, it showed in the report that minifying javascript files can reduce payload and script parse time.
Steps:
- Set
optimizationflag in ourangular.jsonfile to true. This flag enables optimization of the build output. Including minification of scripts and styles, tree-shaking, dead-code elimination, inlining of critical CSS and fonts inlining.
Results:
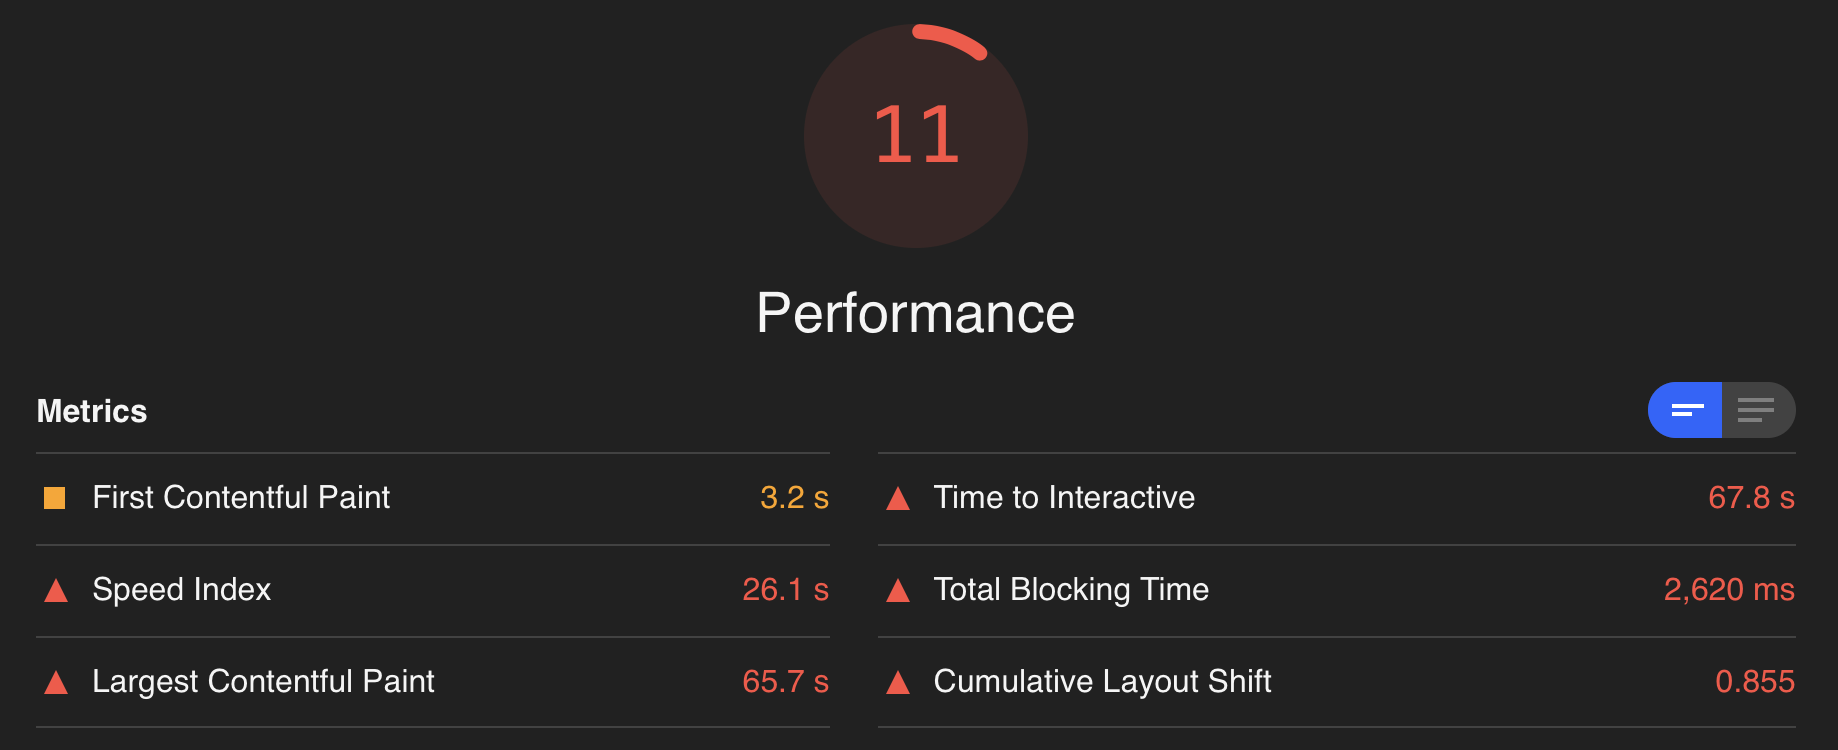
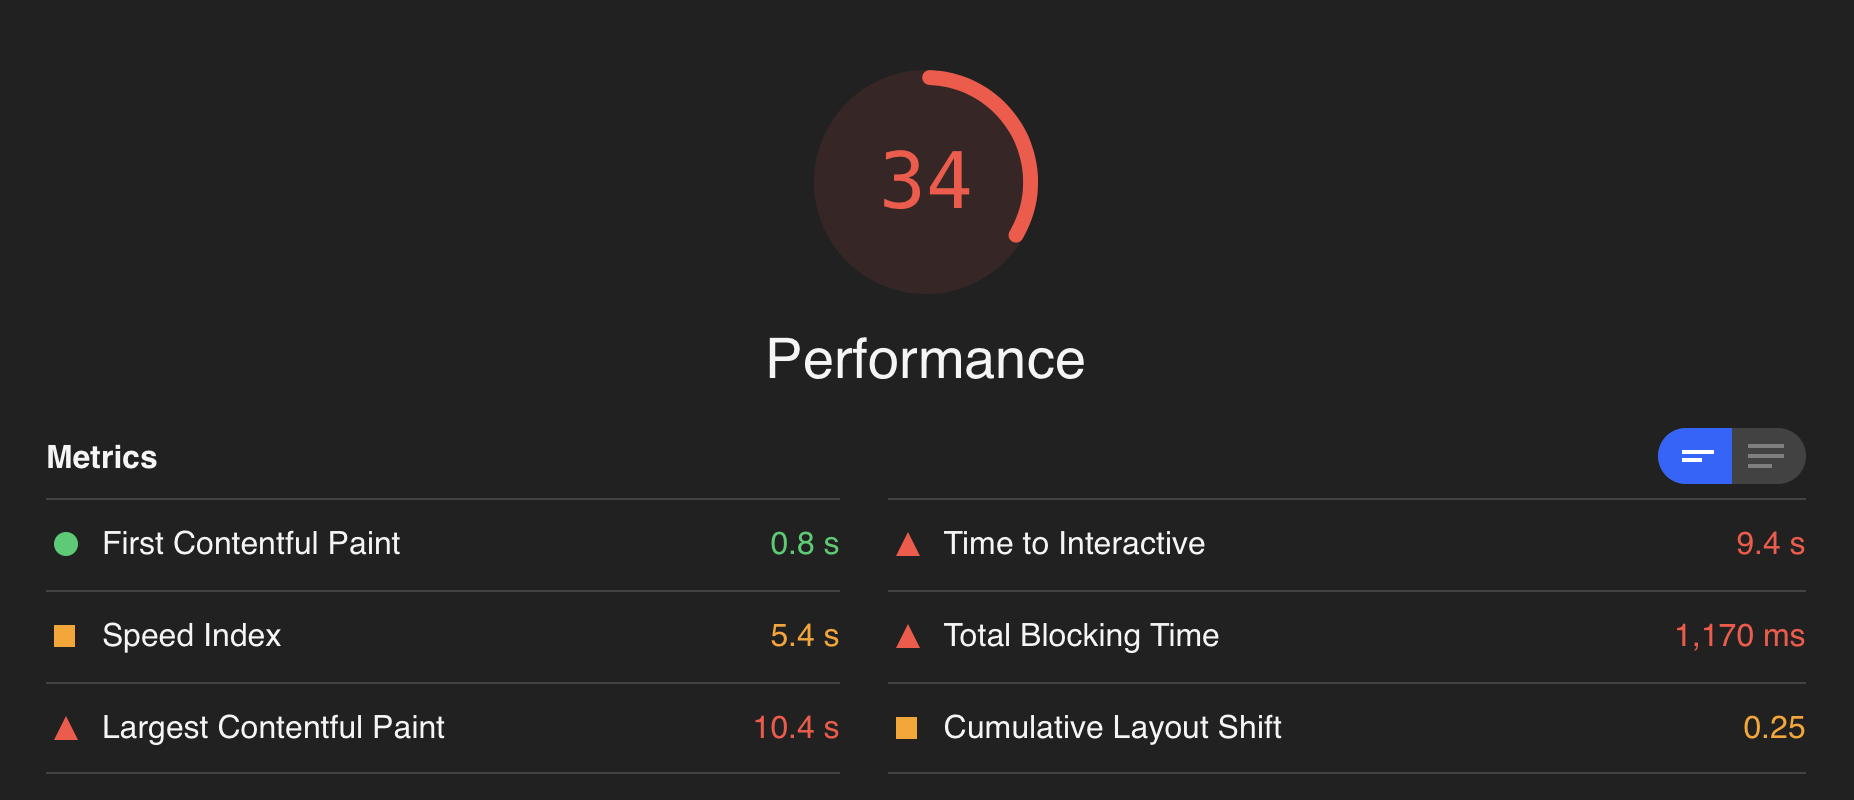
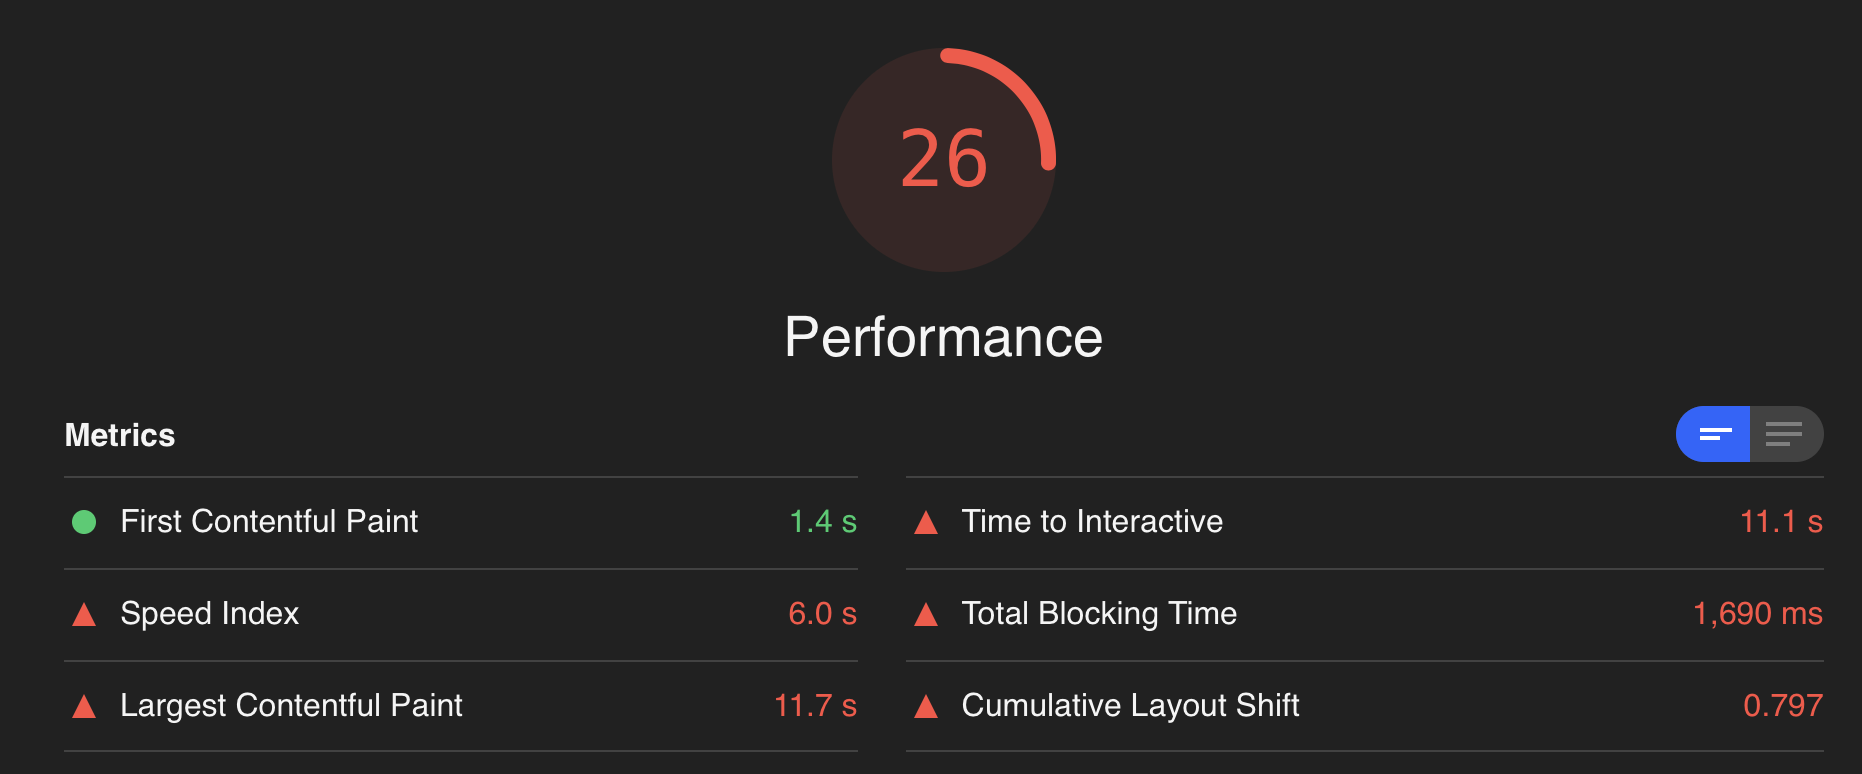
- The Lighthouse audit report showed that the score increased by 15 points.
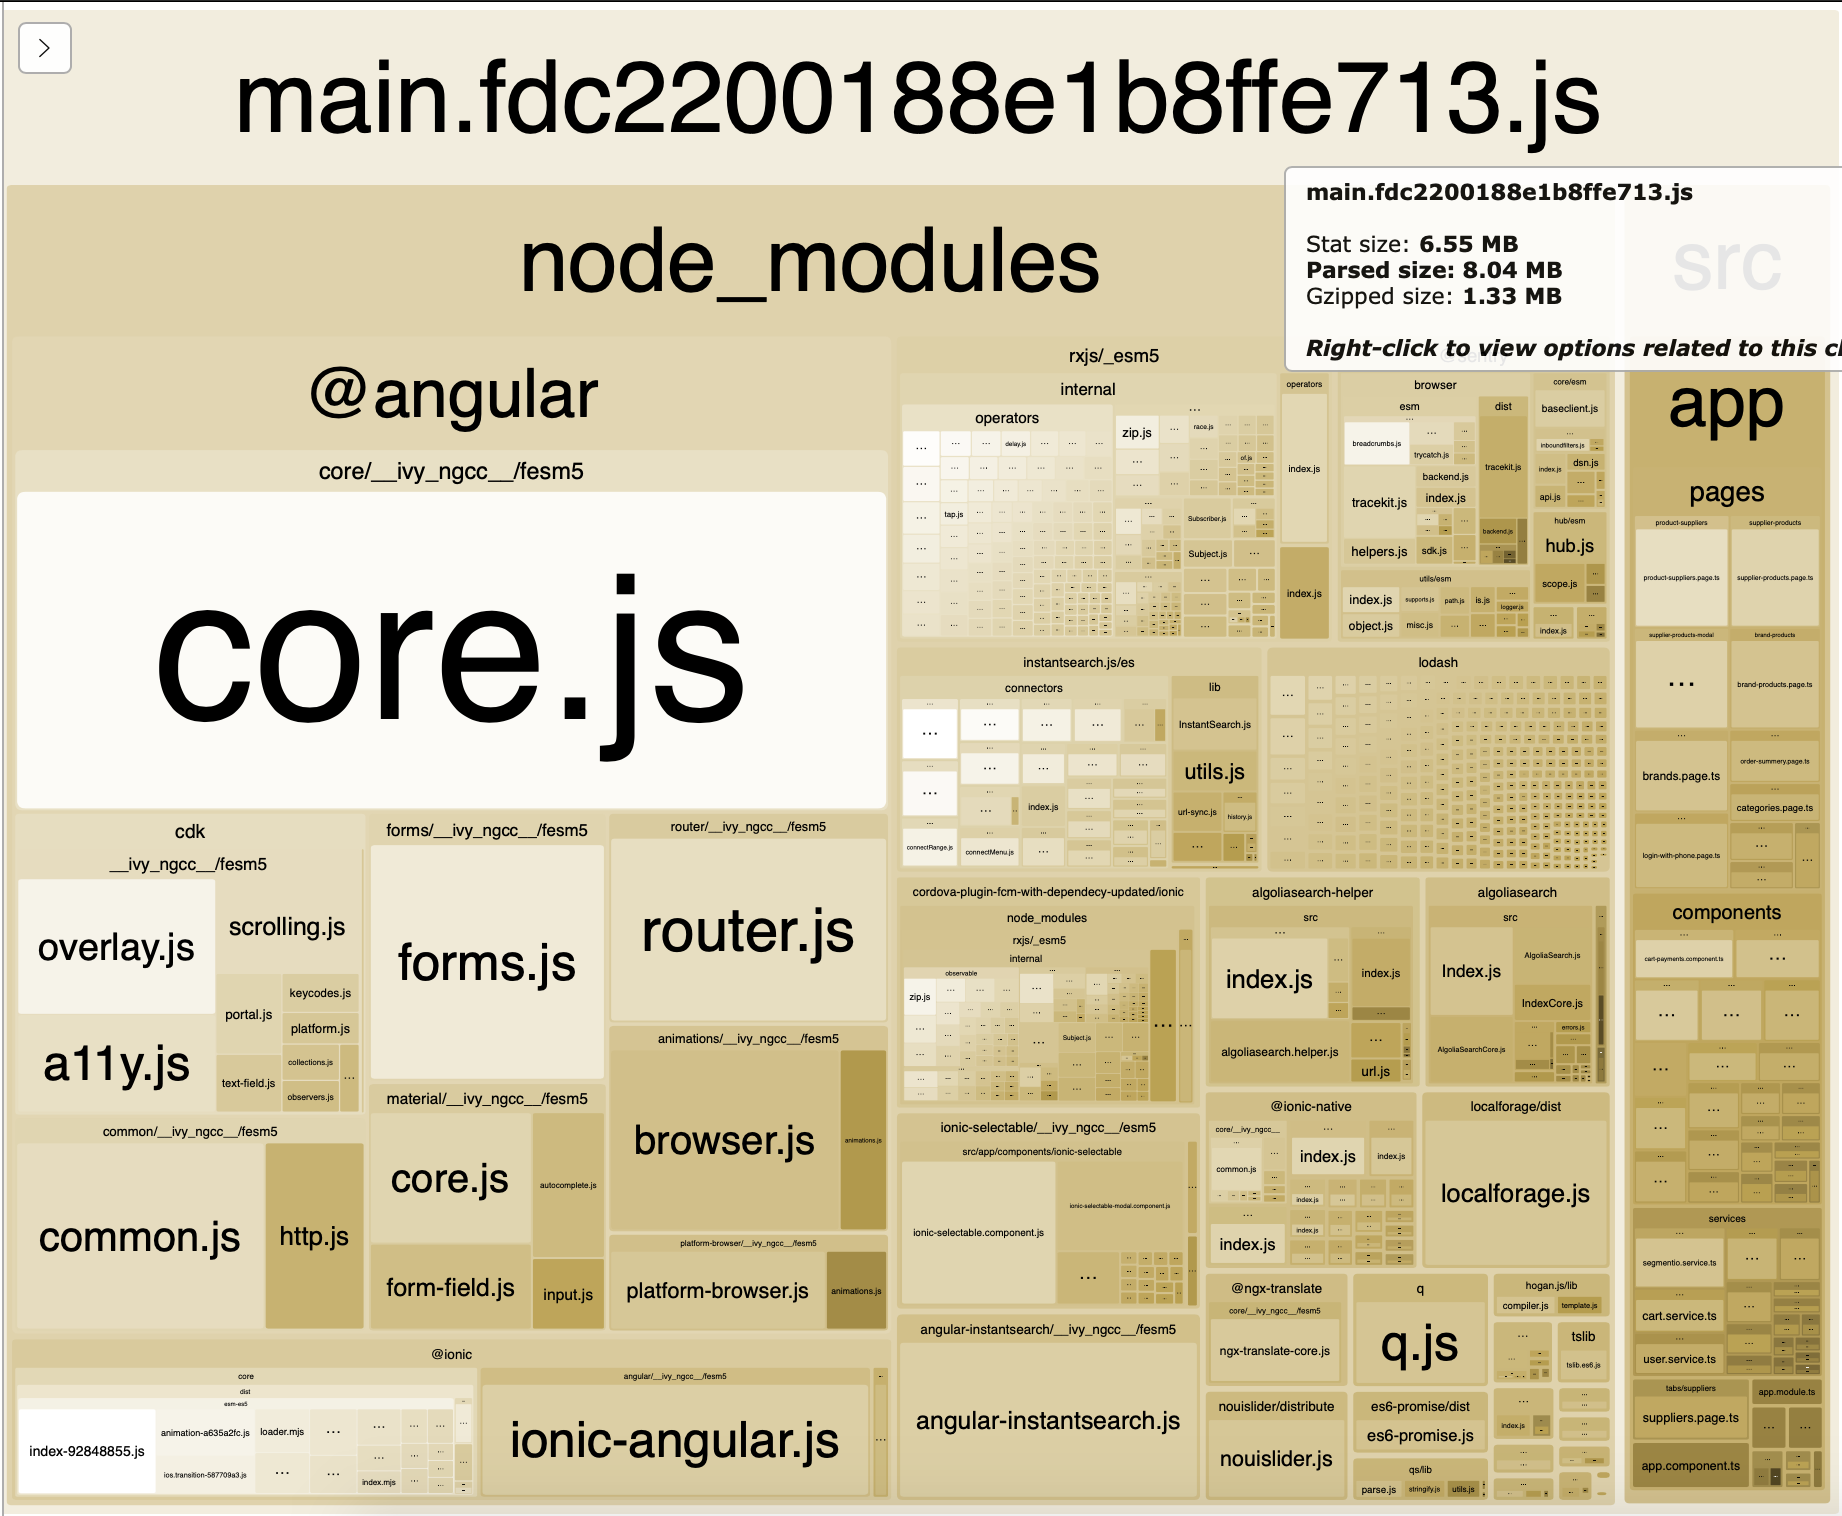
- The compiled code size reduced significantly from 32.5mb to 20.8mb. Using webpack bundle analyzer we saw that the javascript files generated sizes decreased.
| Before Minification | AfterMinification |
|---|---|
 |
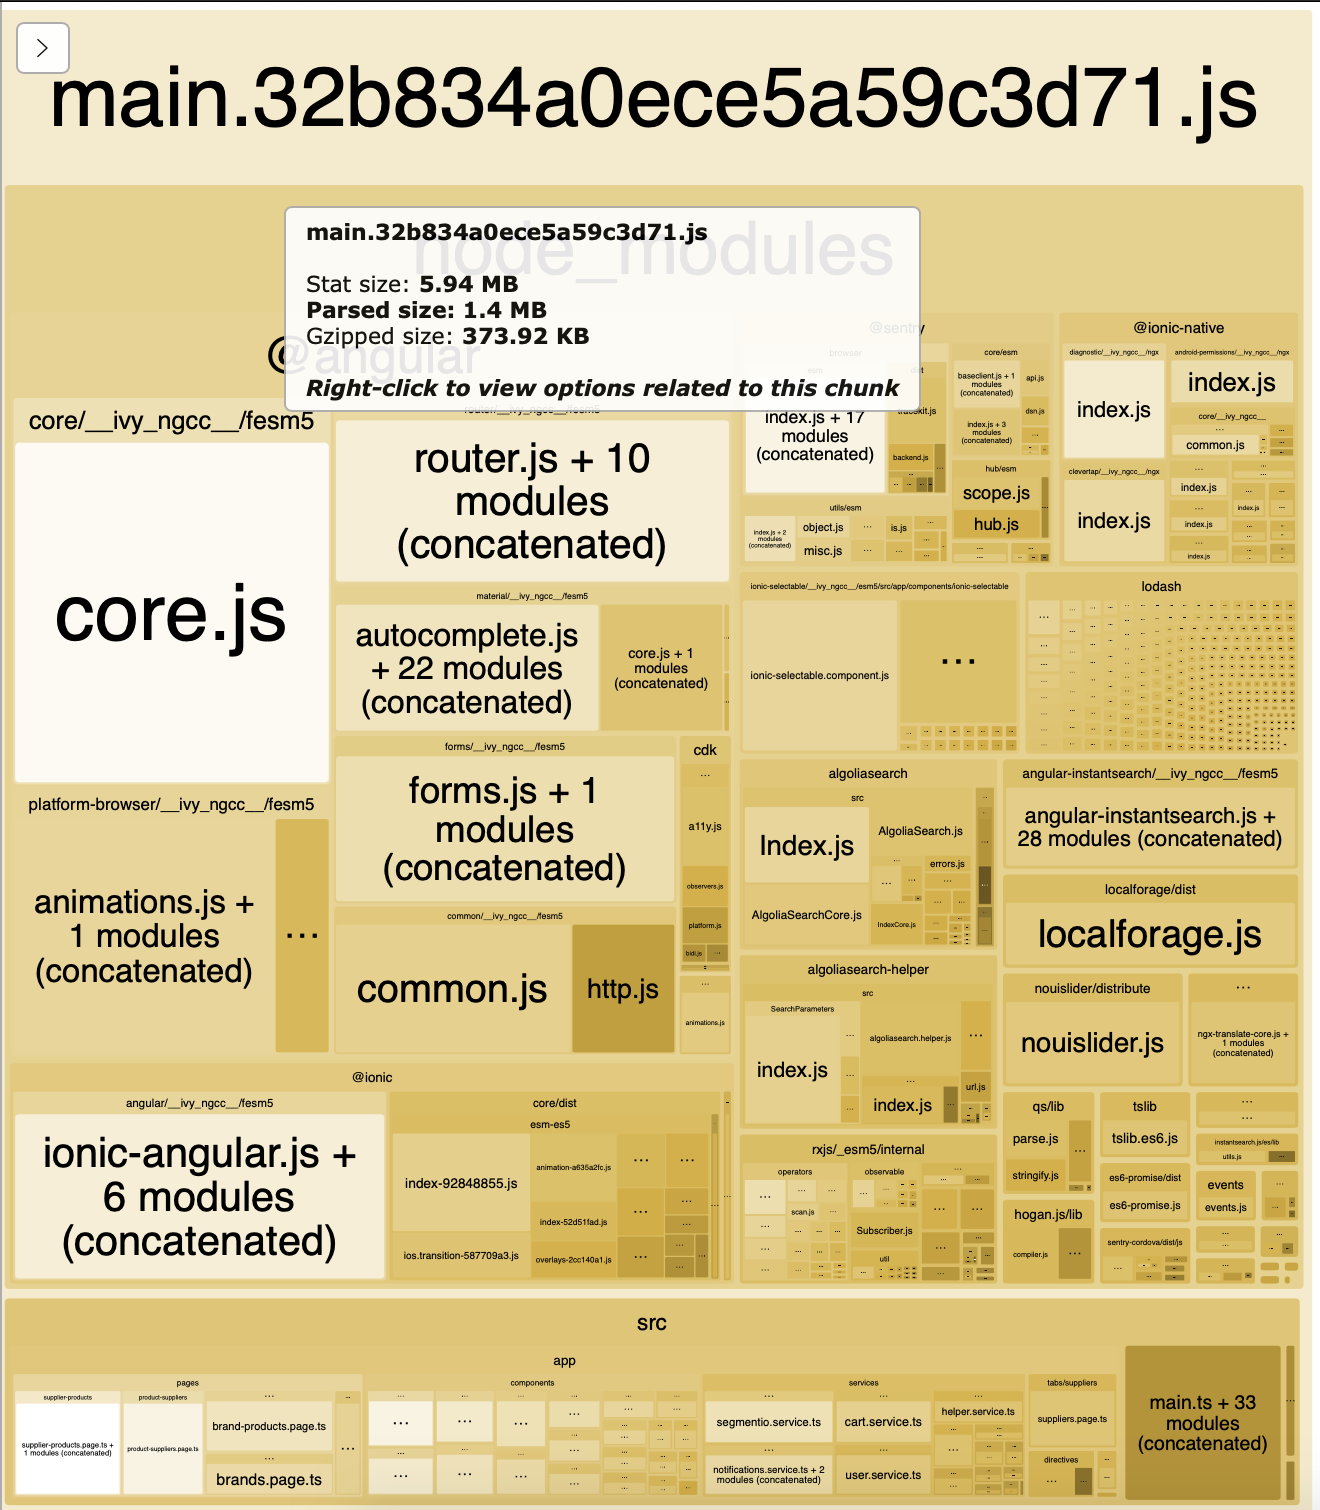 |
Trial #2 (Remove unused CSS)
Description: Lighthouse report suggested that we can remove unused CSS, as it slows down the browser's construction of the render tree.
Steps:
- we checked the coverage tab in Chrome Dev Tools, and we noticed that
angular materialcss was never used in our app, and we didn't need this package at all so we removed it. - used
source-map-explorerto see how much is the size of the package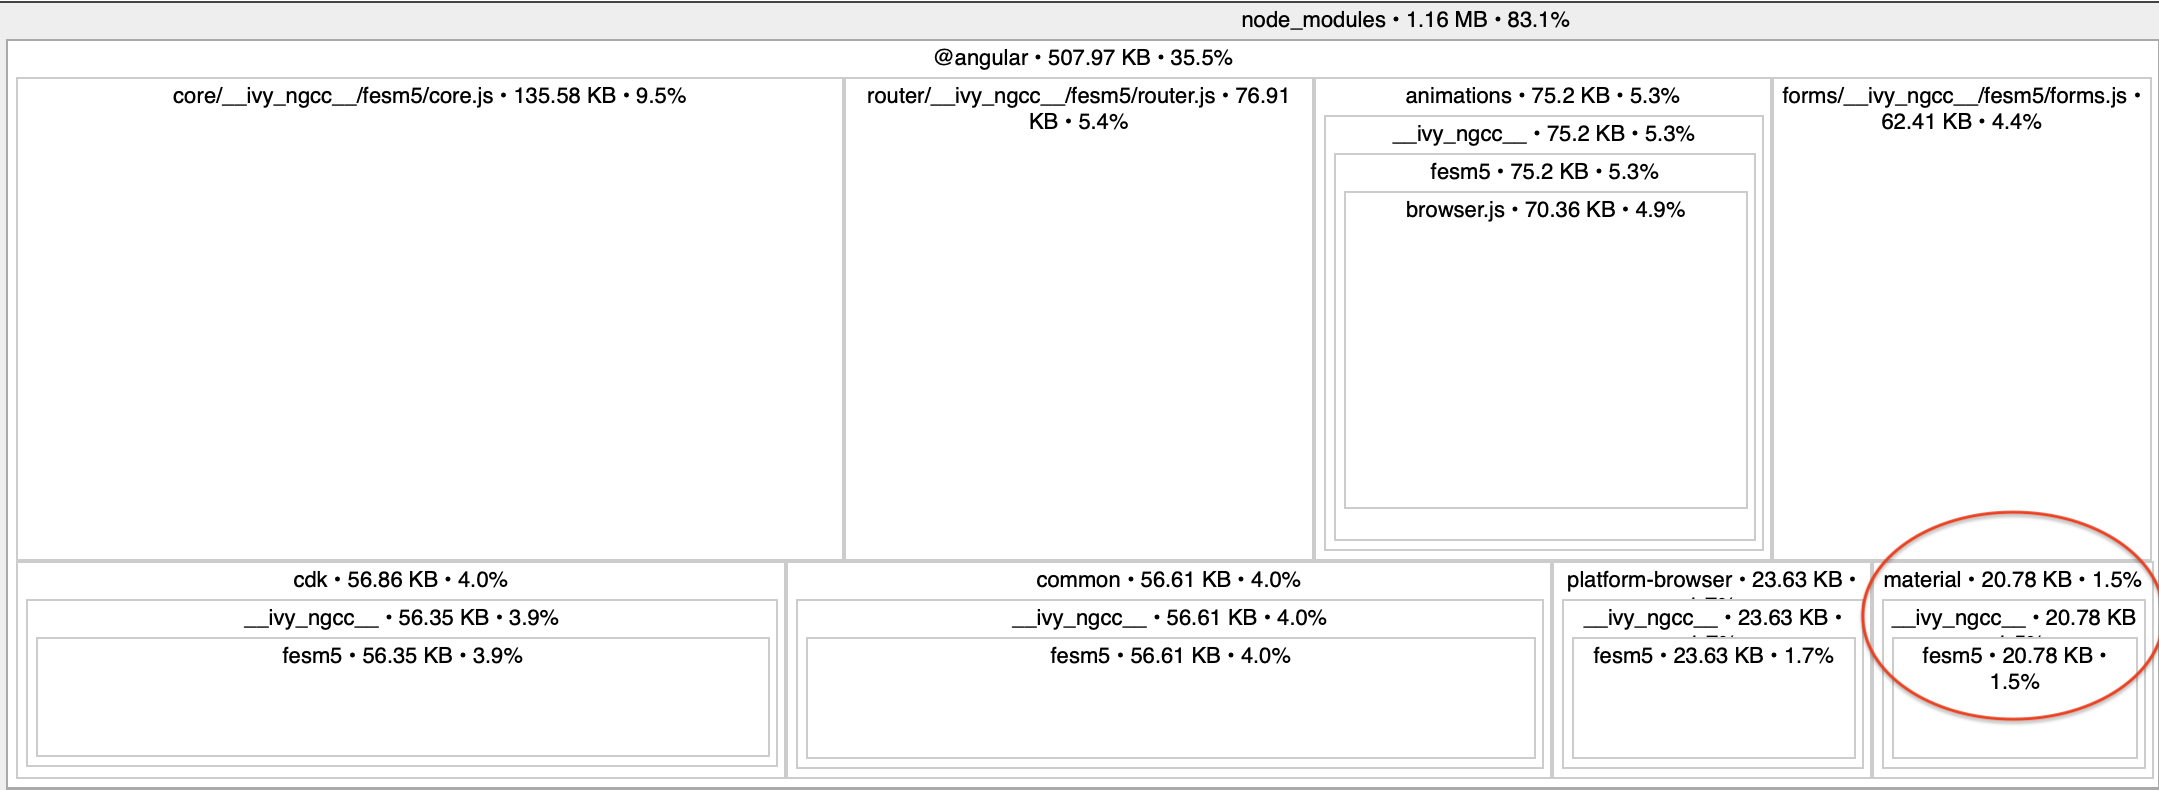
- the
styles.jsfile it's size significantly decreased from 108kb (~4500 lines) to 31kb (~1500 lines).
Results:
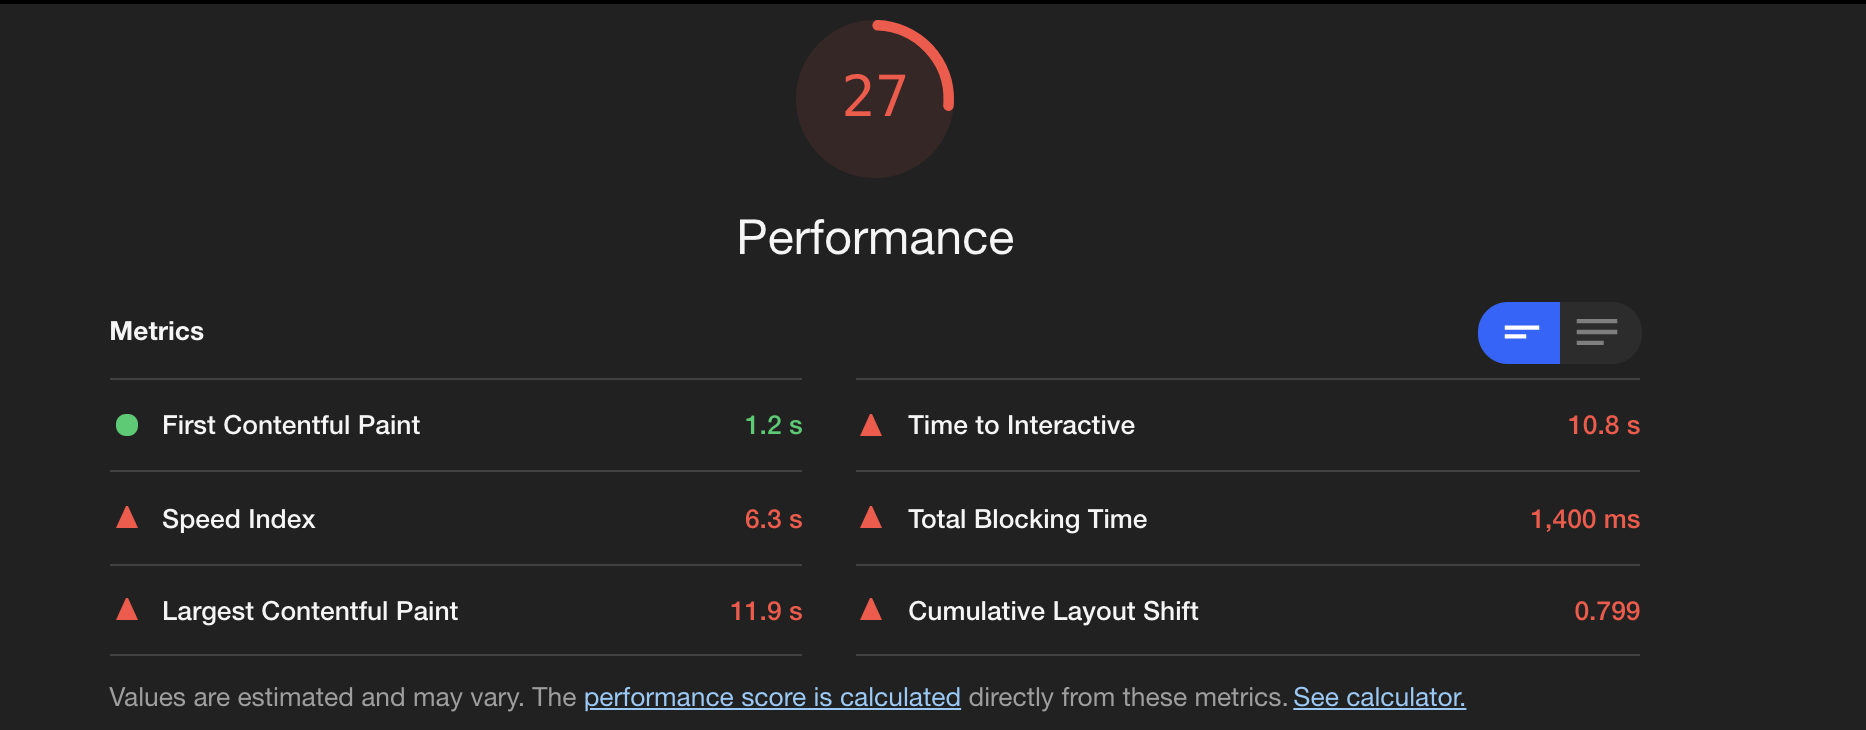
- The Lighthouse audit report didn't show much improvement in performance score, but the total blocking time has decreased by ~300ms and first contentful paint decreased by 200ms
Trial #3 (Use onPush Strategy)
Description:
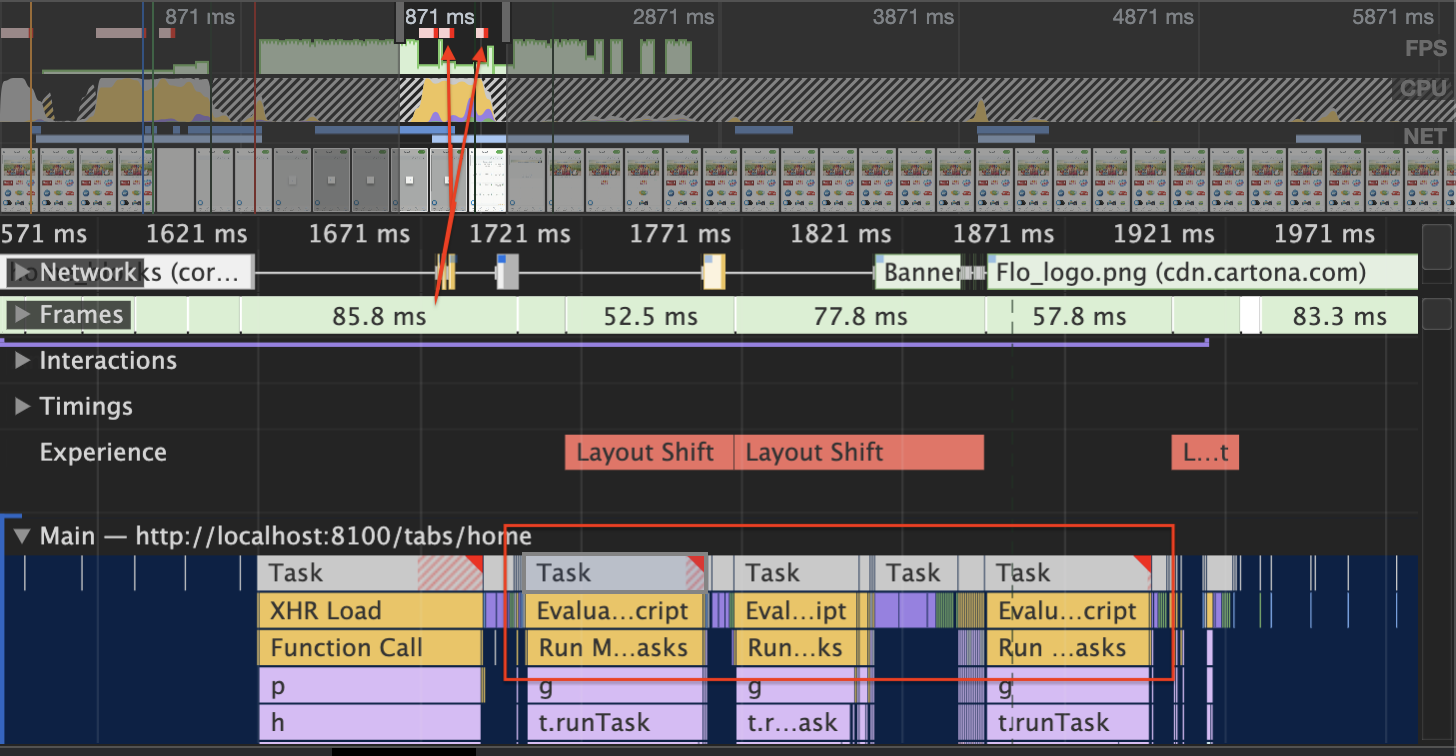
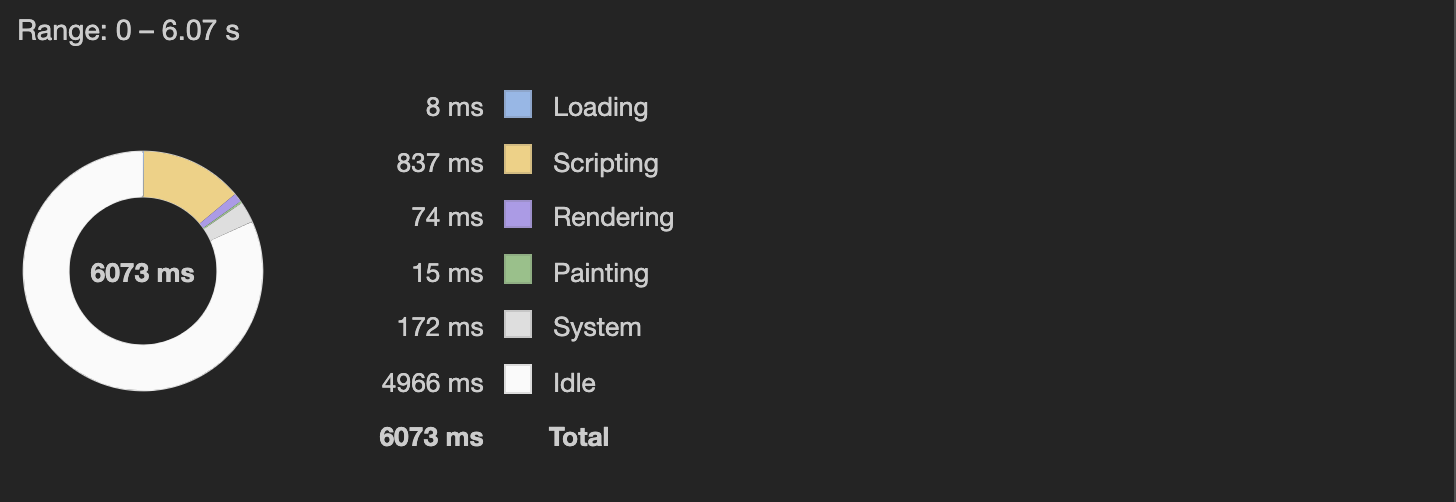
- We noticed when we started profiling the app performance using chrome dev tool that long tasks are triggered from Zone.js, after searching for the reason we realized that angular when a DOM event(click, hover, scroll, etc.) happen or async request occurs a change detection is triggered and it walks down starting from the root component and goes all the way down to check for changes.
- We can see here that there are two long tasks are triggered related to Zone.js
Steps:
- use
onPushchange detection strategy to avoid unnecessary change detection for child components of the page.
Results:
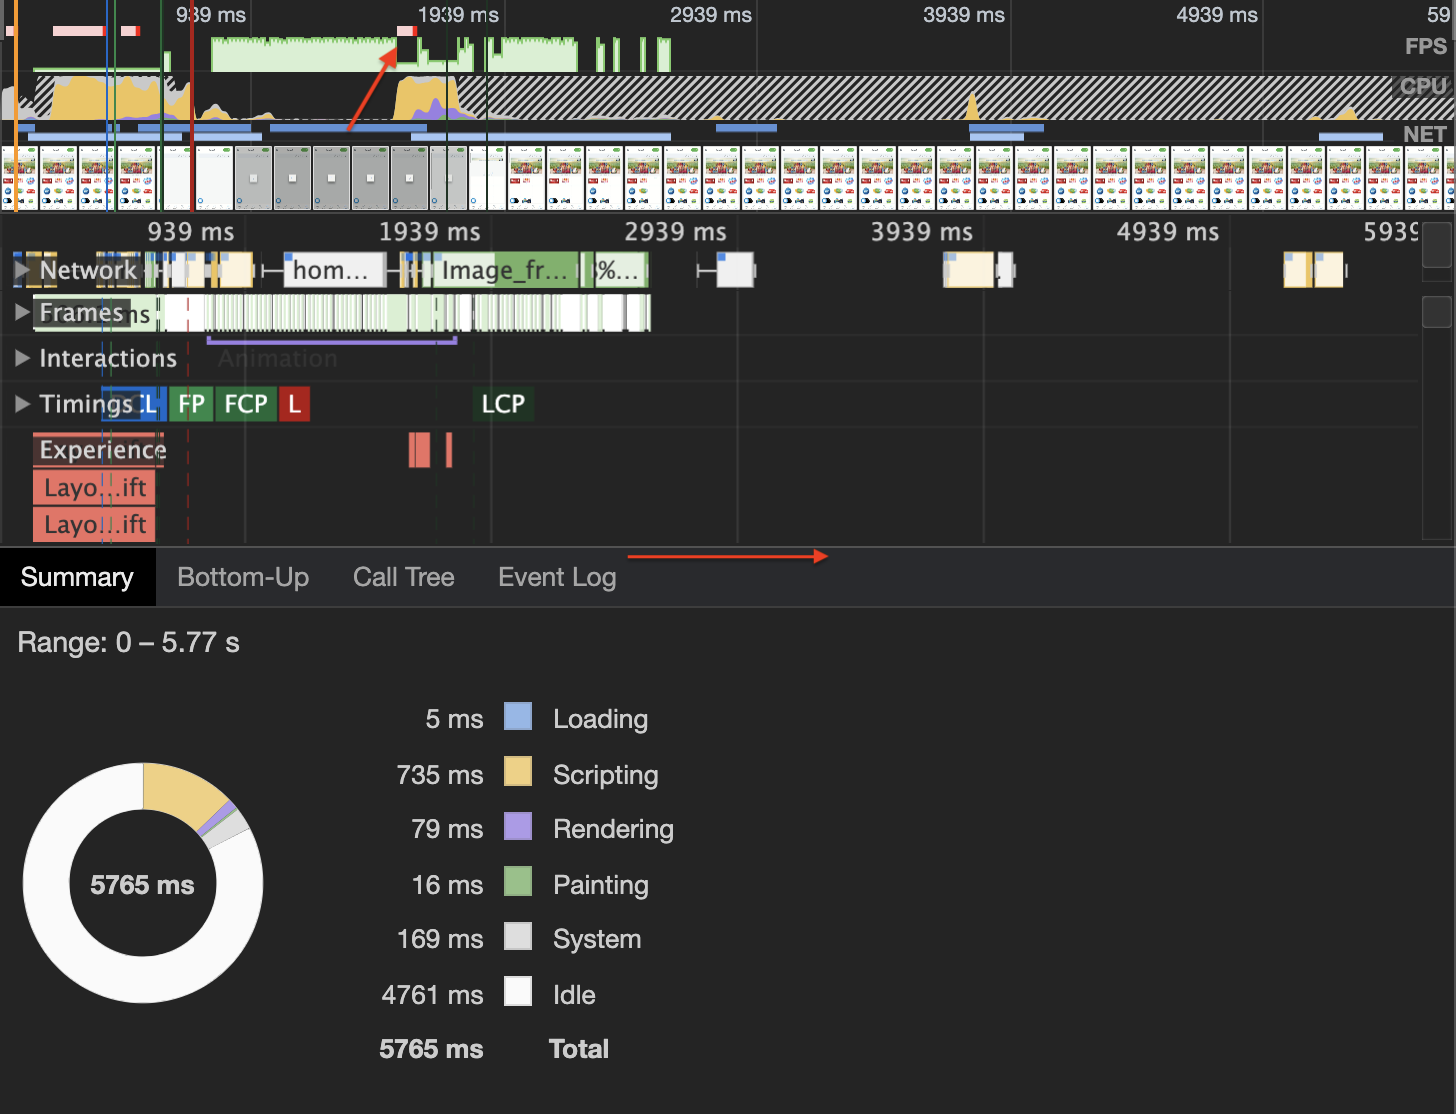
- when we re-ran the performance profiling again we noticed that those Zone.js tasks are not triggered and the total scripting time has decreased by 300ms.
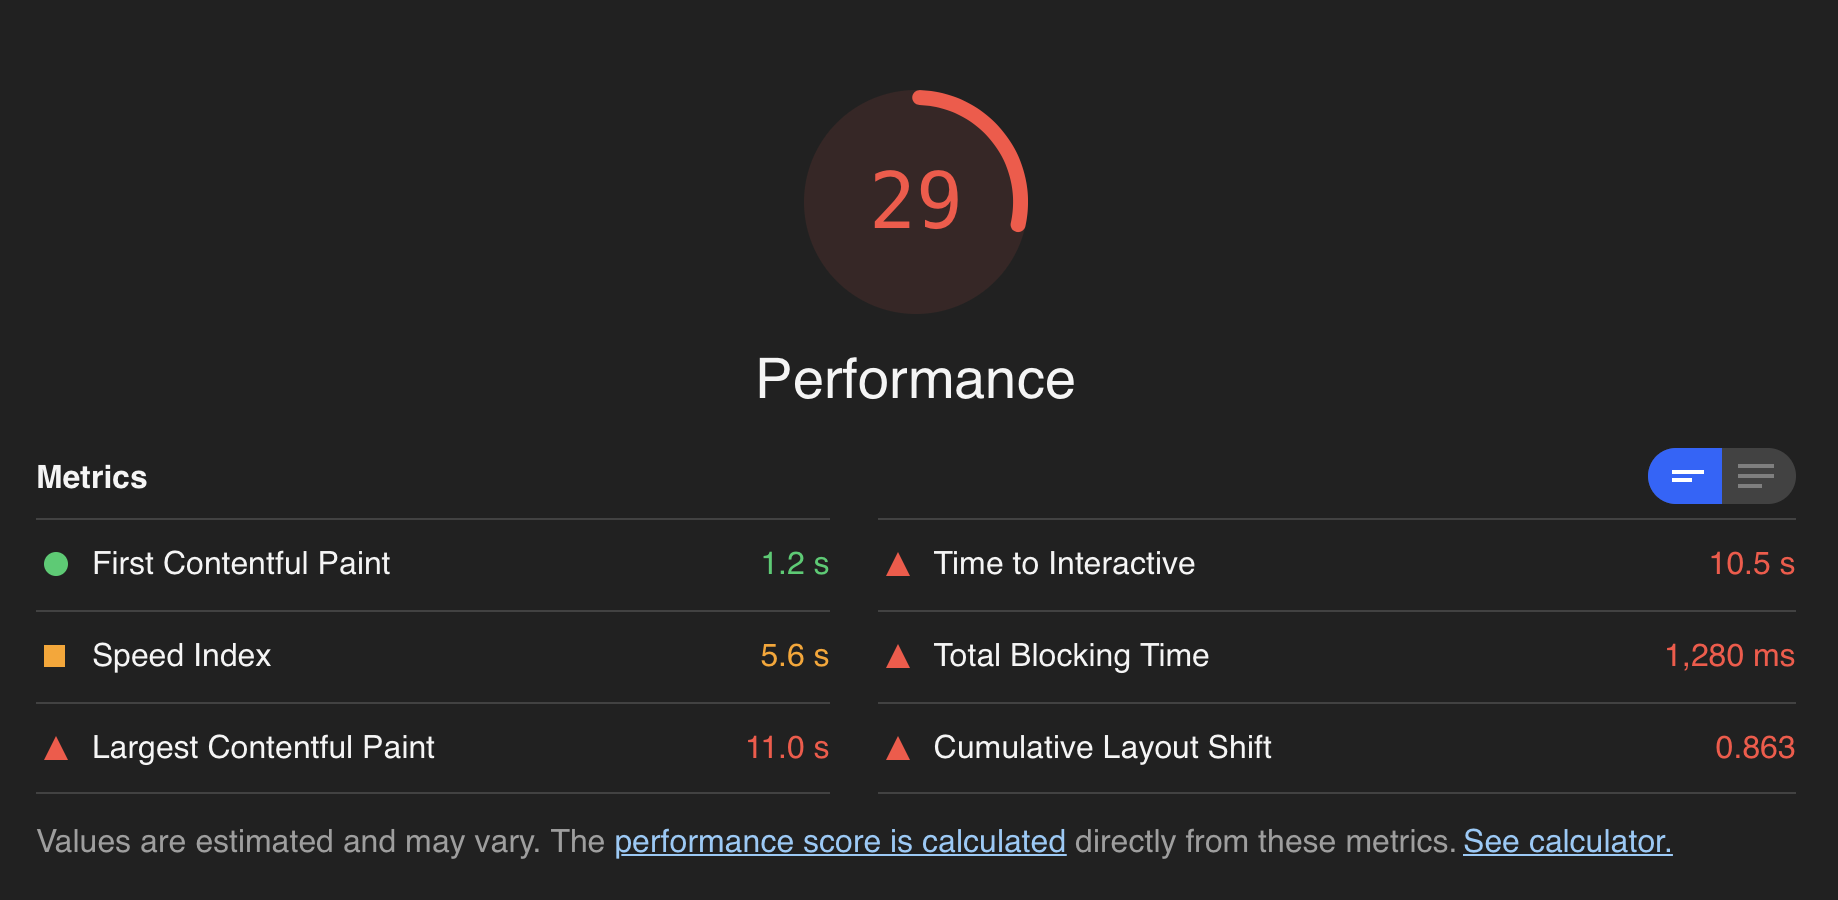
- The Lighthouse report didn't show much improvement in the performance score but some of the metrics gained better scoring like First Contentful Paint, Speed Index and Largest Contentful Paint
Trial #4 (Dynamically Loading Scripts)
Description: We noticed in the Network tab that there are two scripts are fetched on app loaa and they increase the script evaluation time, and they're not needed on app startup.

Steps:
- dynamically loading those scripts when needed to avoid unnecessary script evaluation.
