freeRouter is a free, open source router os process. it speaks routing protocols, and (re)encapsulates packets on interfaces.
All 26 of Grafana's freeRtr dashboard's have been updated and improved. One of the main differences is that we now have the router name.
- You can use this universal sensor (copy and paste).
sensor ifaces-sw
path interfaces-sw/interface/counter
prefix freertr-ifaces
key name interfaces-sw/interface
command sho inter swsumm
prepend iface_sw_byte_
name 0 ifc=
replace \. _
column 1 name st
column 1 replace admin -1
column 1 replace down 0
column 1 replace up 1
column 2 name tx
column 3 name rx
column 4 name dr
.
exit
server prometheus pr
 sensor ifaces-hw
 sensor ifaces-sw
 vrf <PROMETHEUS_VRF>
 exit
global:
  scrape_interval: 15s
  scrape_timeout: 10s
  evaluation_interval: 30s
alerting:
  alertmanagers:
  - static_configs:
    - targets: []
    scheme: http
    timeout: 10s
scrape_configs:
- job_name: router
  scrape_interval: 15s
  scrape_timeout: 10s
  metrics_path: /metrics
  scheme: http
  static_configs:
  - targets:
    - <prometheus_agent_ip_1>:9001
    labels:
      node_name: <prometheus_agent_1_node_name>
  - targets:
    - <prometheus_agent_ip_2>:9001
    labels:
      node_name: <prometheus_agent_2_node_name>
$ sudo apt-get install --no-install-recommends --no-install-suggests --yes default-jre-headless
$ wget http://www.freertr.org/rtr.jar
$ sudo apt install docker.io
$ sudo apt install docker-compose
$ git clone https://github.com/Tetzdesen/FreeRouter-Prometheus.git
$ cd FreeRouter-Prometheus
$ sudo mv prometheus /etc
- Check the IP from your interface
$ ifconfig
- Change the IP in the prometheus.yml file with your preferred text editor
$ sudo nano /etc/prometheus/prometheus.yml
$ cd docker
$ sudo docker-compose up -d
$ sudo docker ps
- R1
$ java -jar <path>/rtr.jar routersc topology/r1/r1-hw.txt topology/r1/r1-sw.txt
- R2
$ java -jar <path>/rtr.jar routersc topology/r2//r2-hw.txt topology/r2/r2-sw.txt
Access http://127.0.0.1:3000
-
User: admin
-
Password: freerouter
-
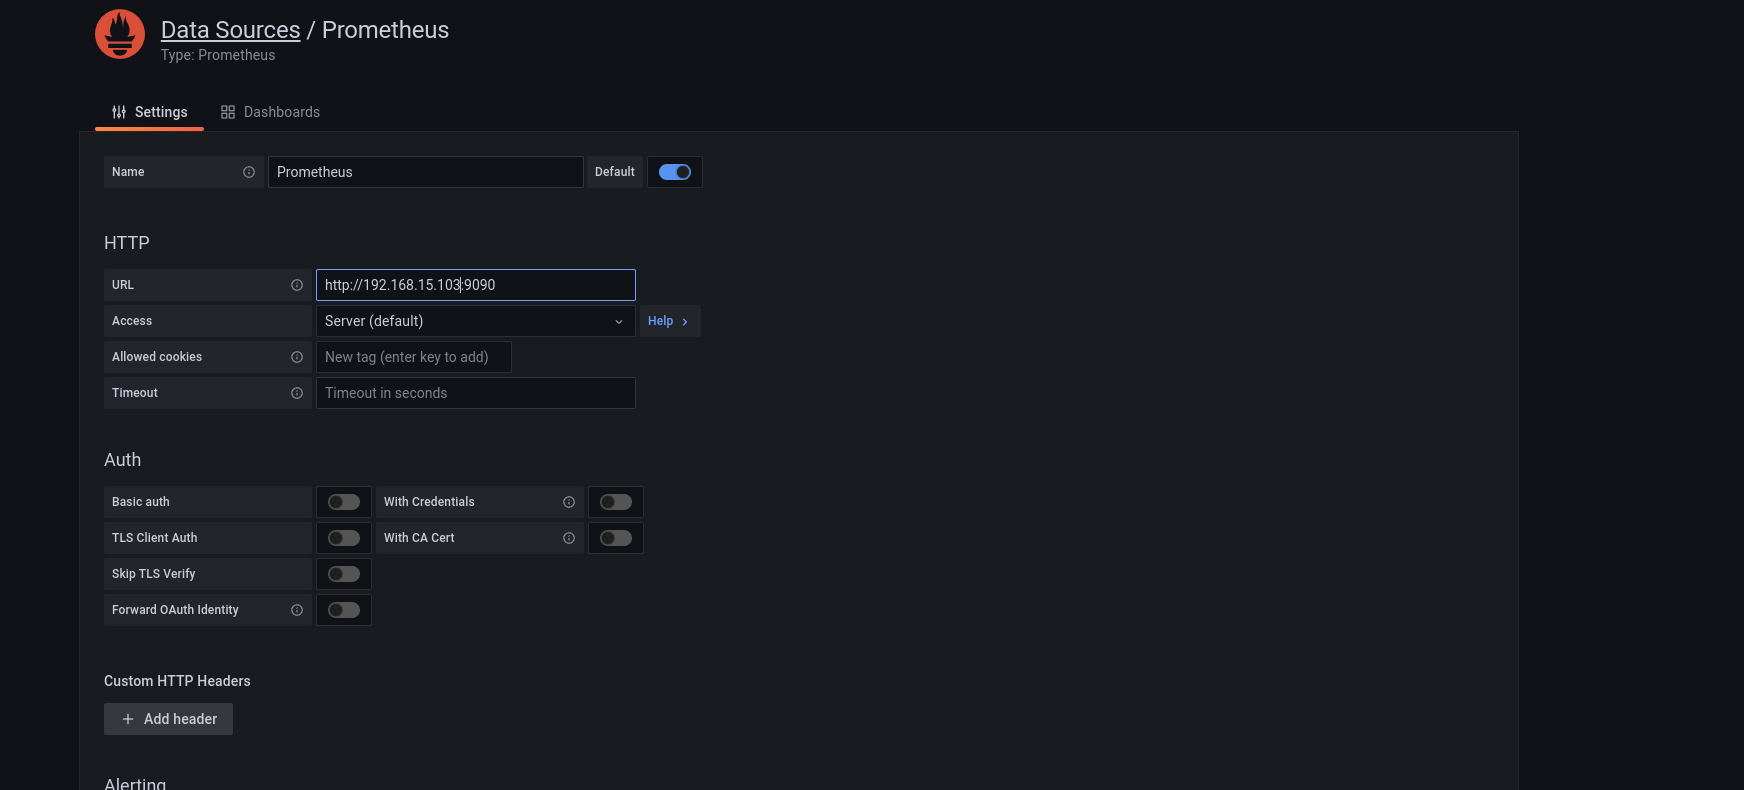
Once installed configure Prometheus as Grafana data source.
- Fill in all the prometheus server information.
- Check the the data source is defined correctly by clicking the "Save & test" button.
-
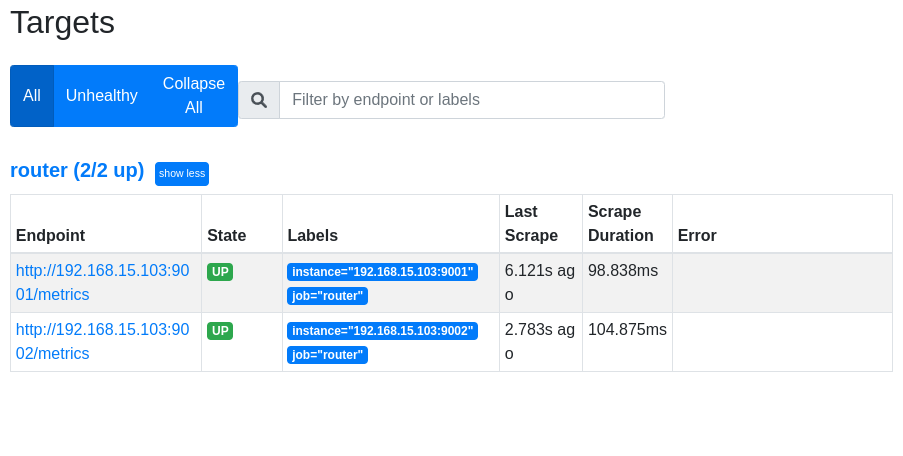
Access Prometheus - http://127.0.0.1:9090
-
Access Targets
-
Verify router's up
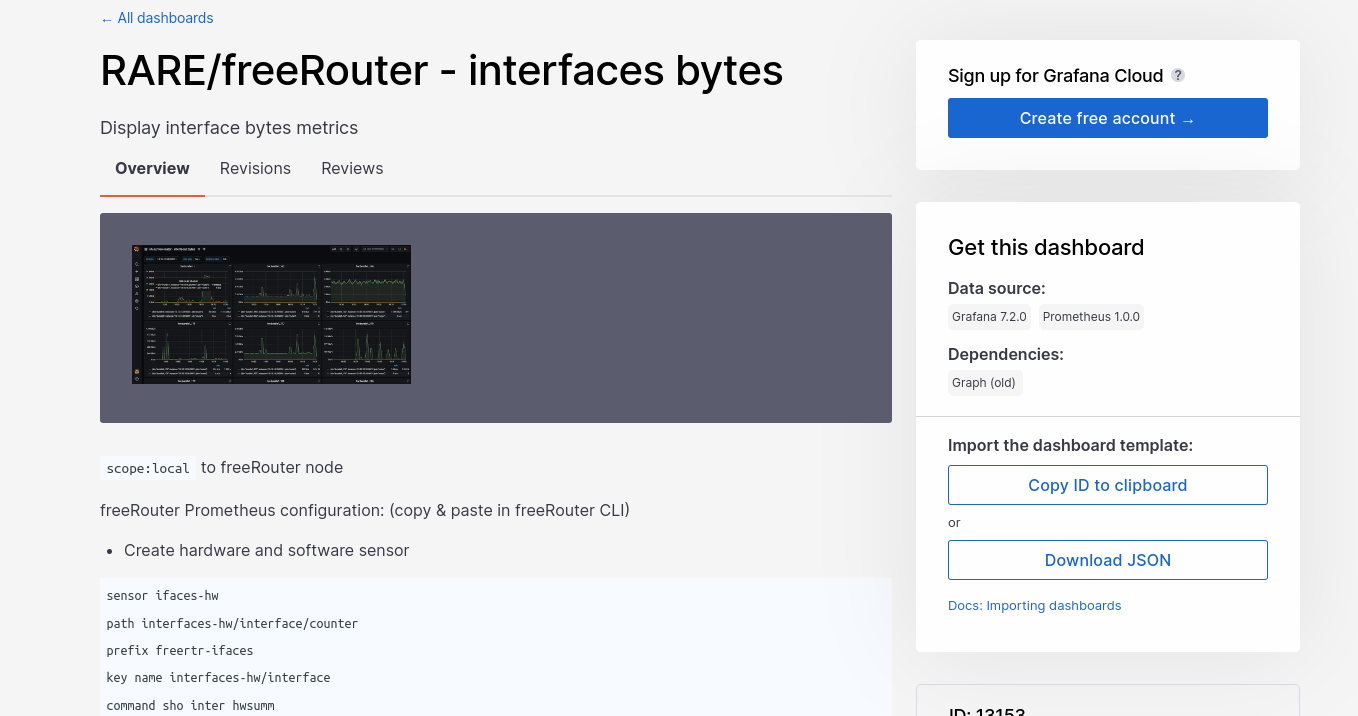
- Download freeRouter interface bytes dashboard here.
-
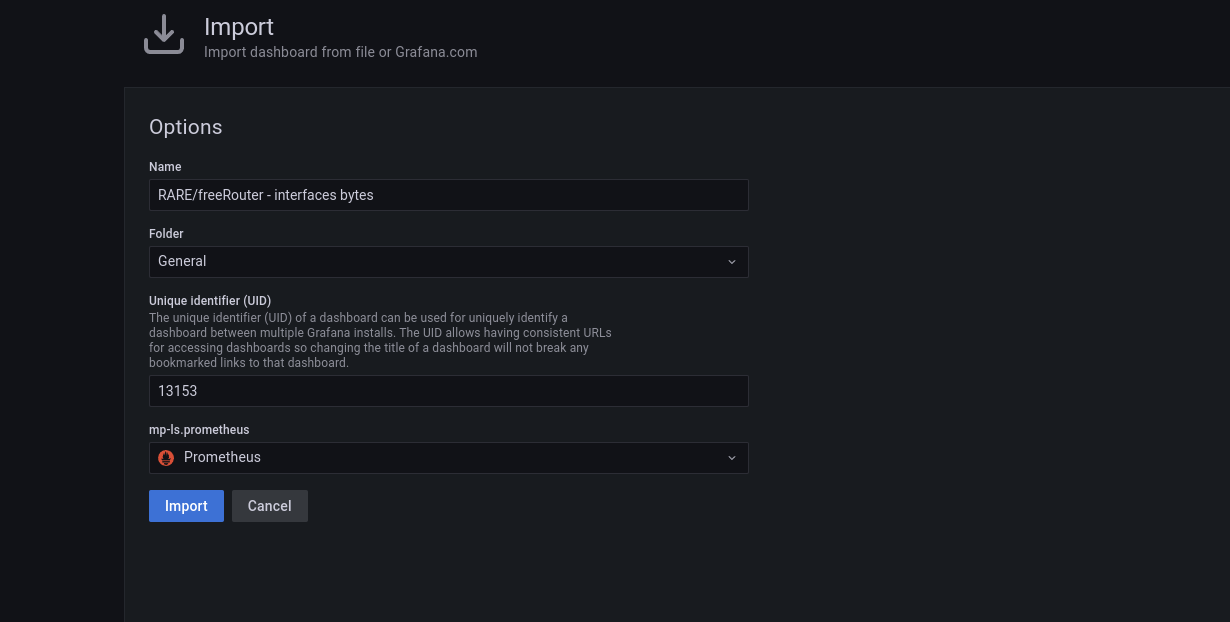
Access Grafana - http://127.0.0.1:3000
-
Import Dashboard RARE/freeRouter
-
Dashboard Verify
-
R1
- R2


