elevation-slopegraphs
Scripts
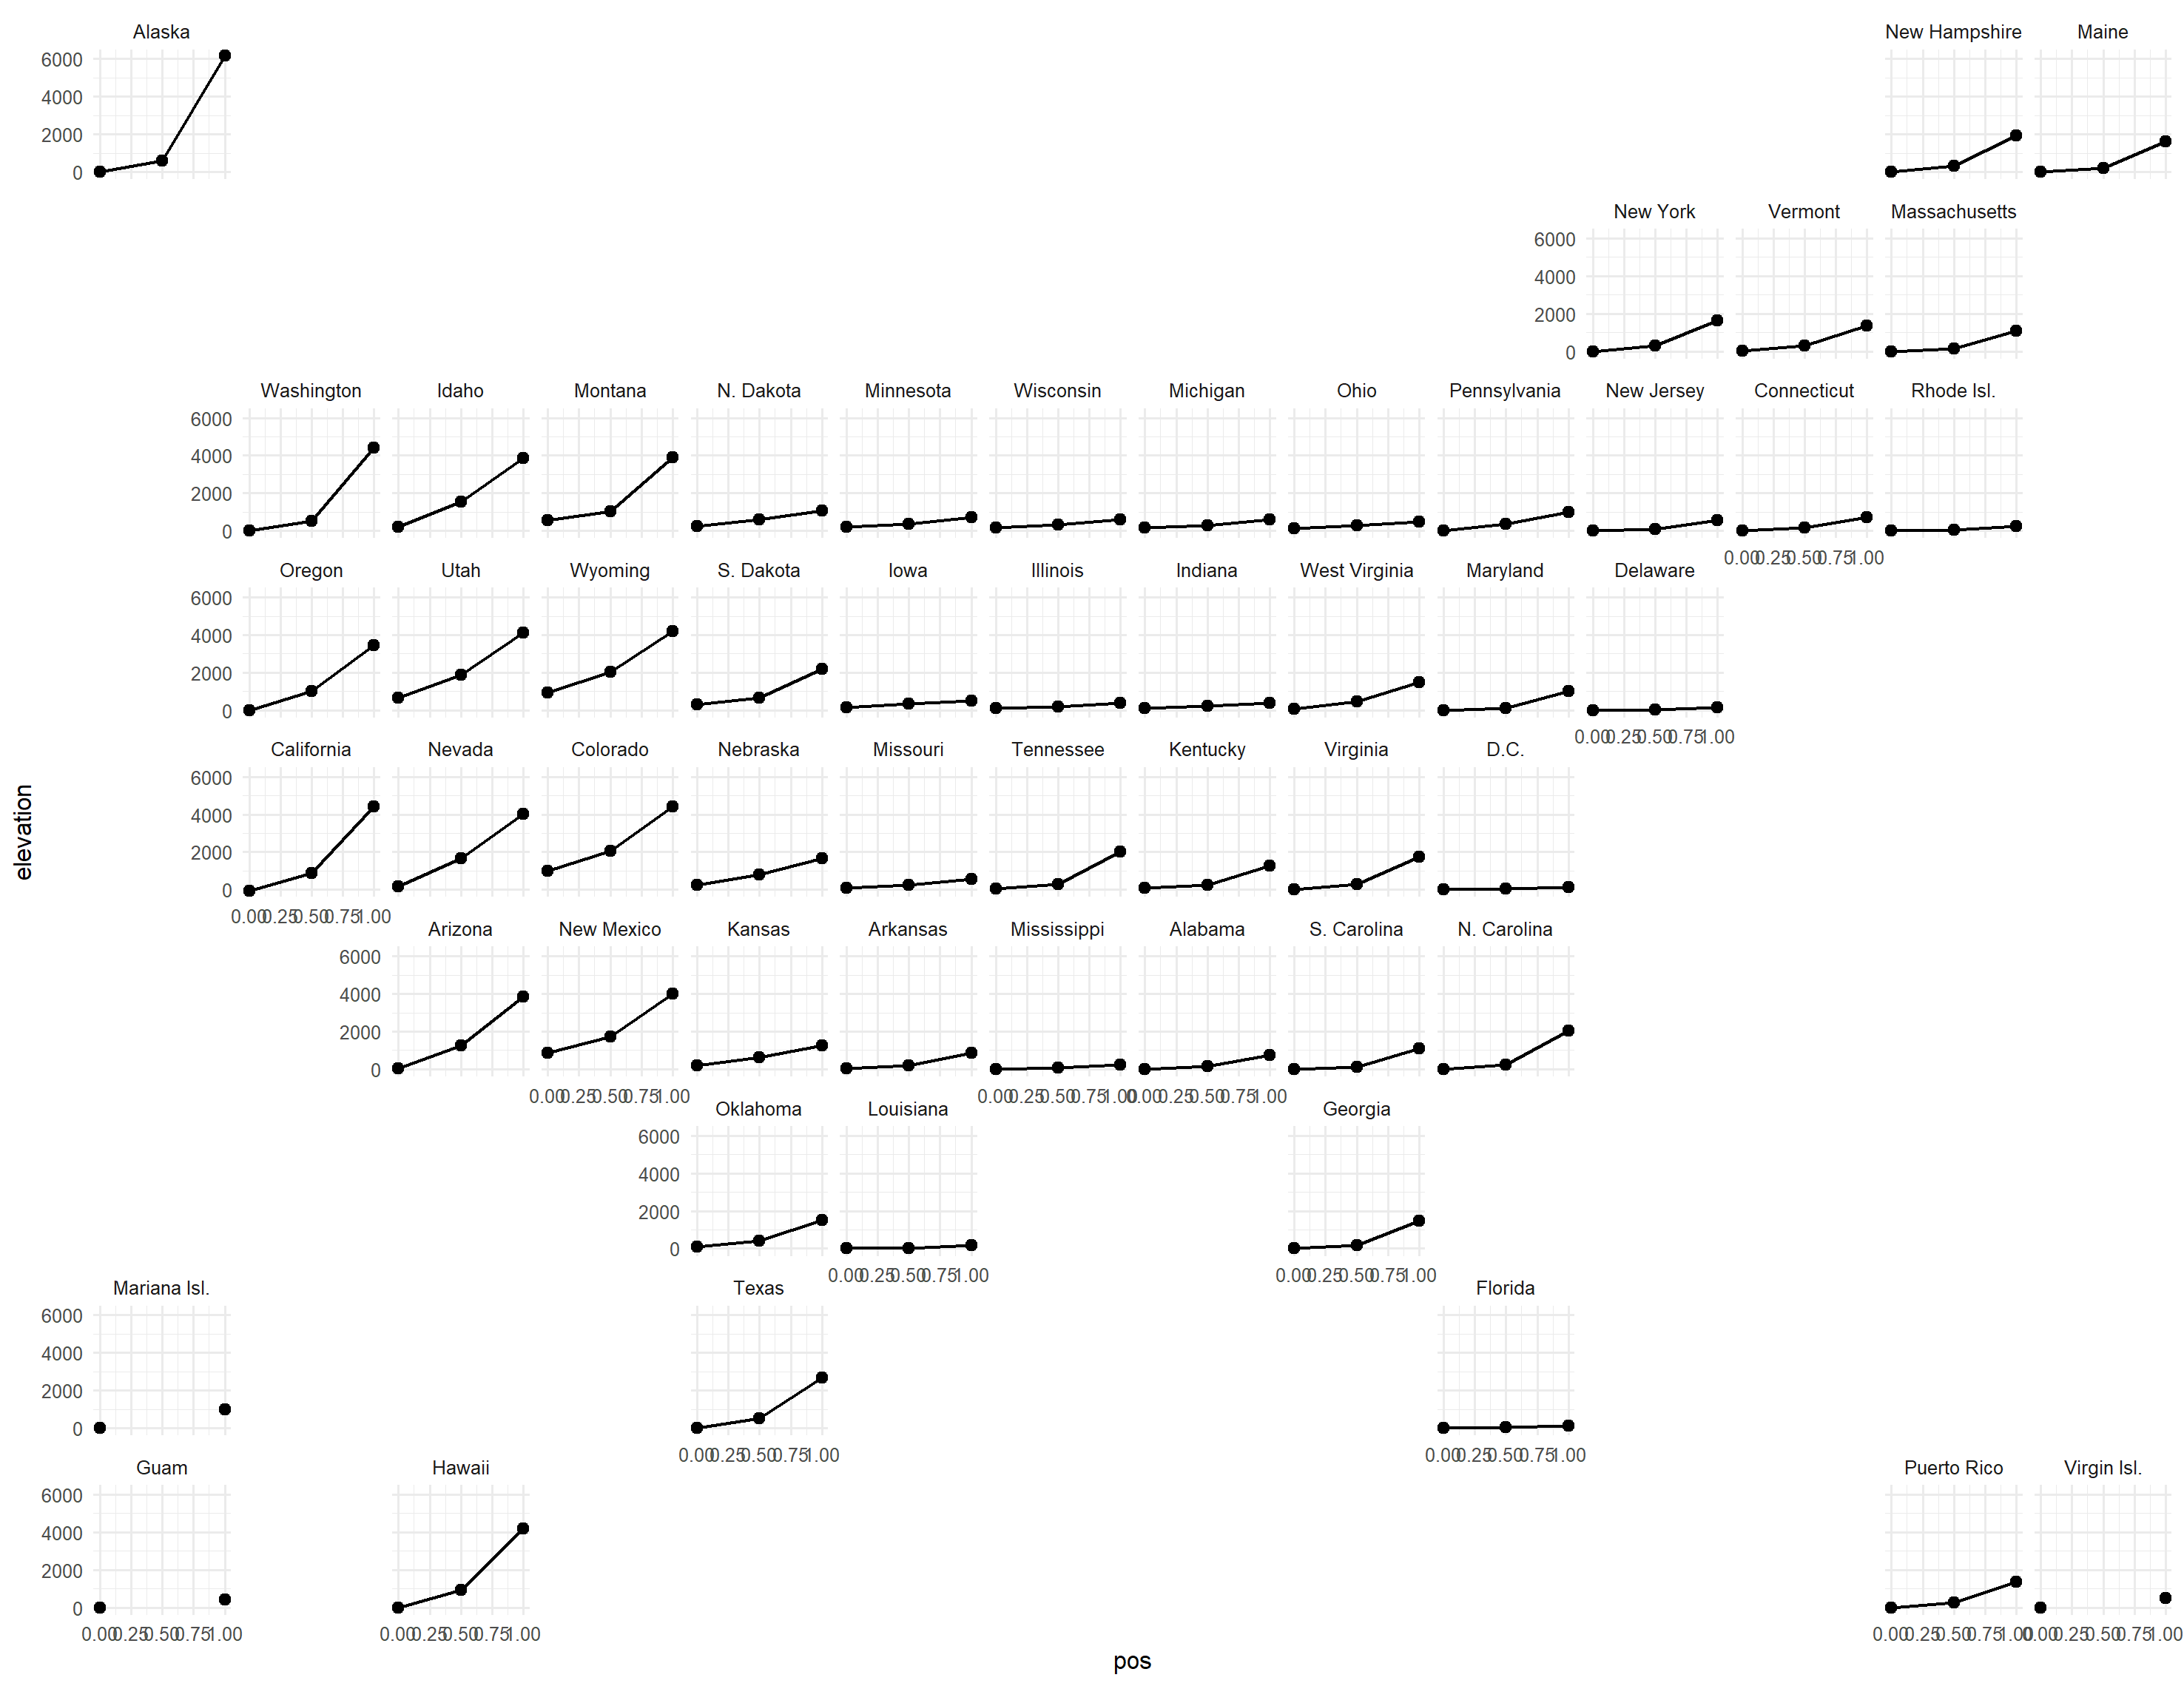
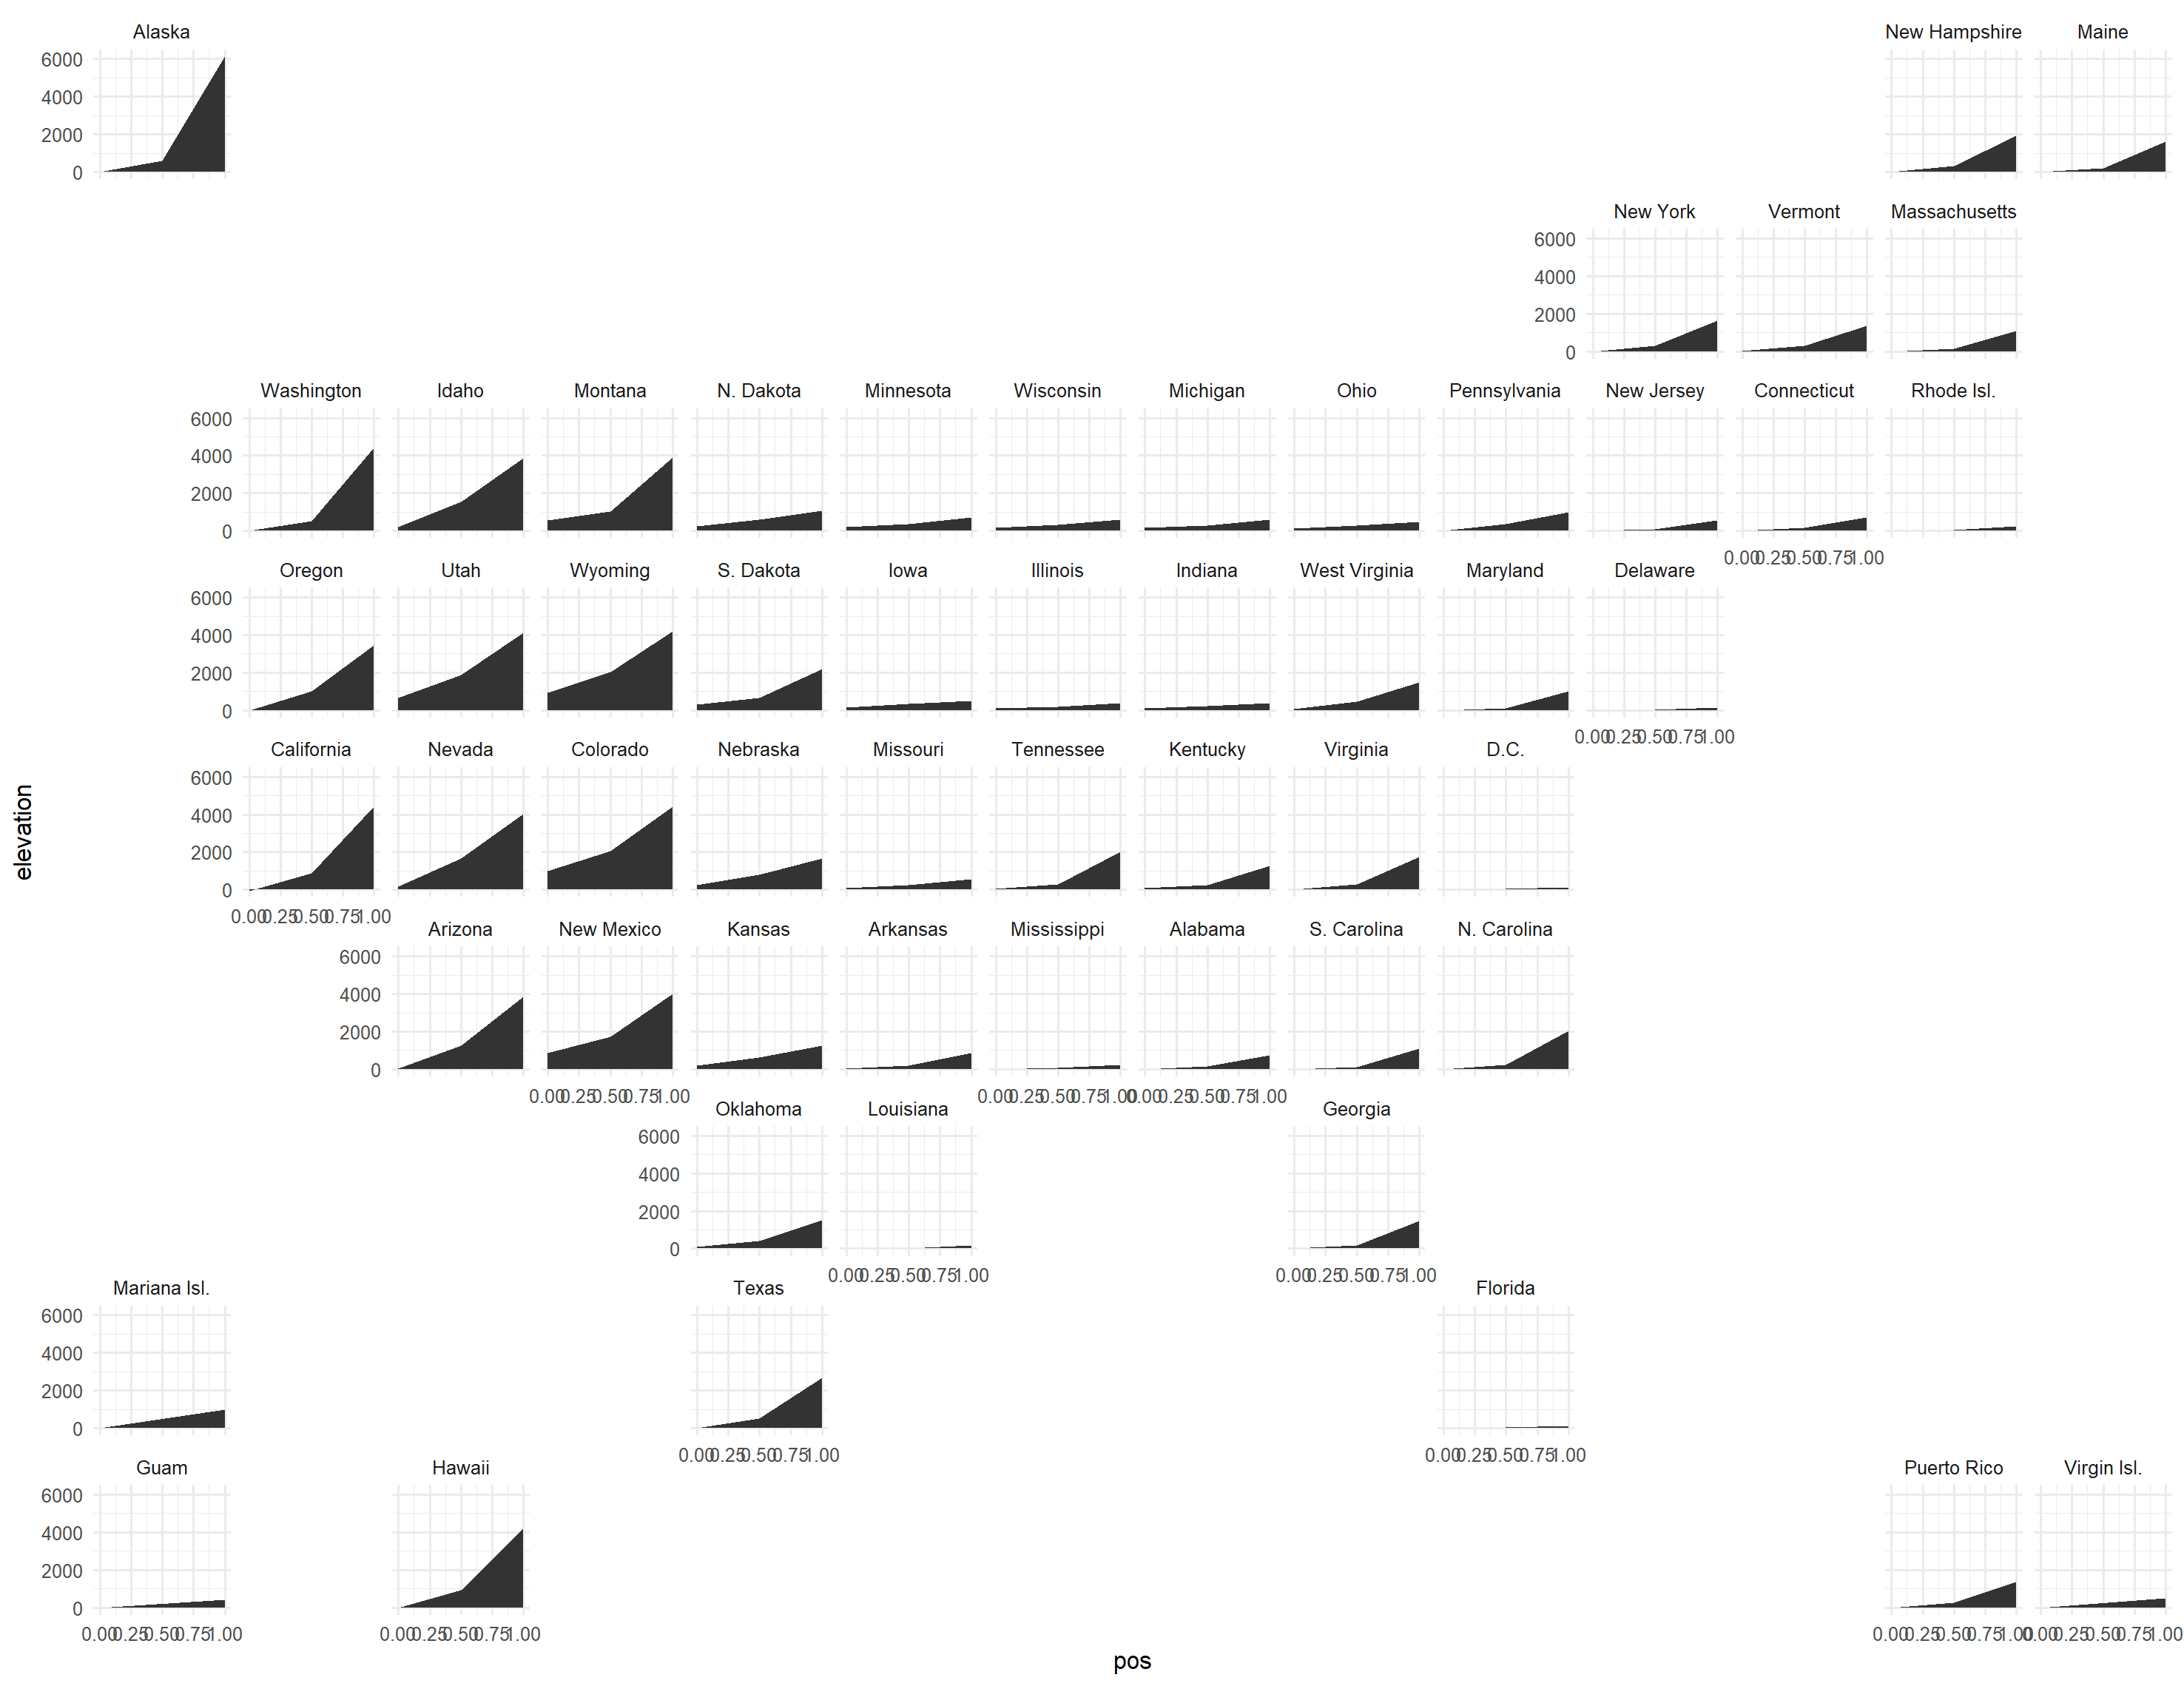
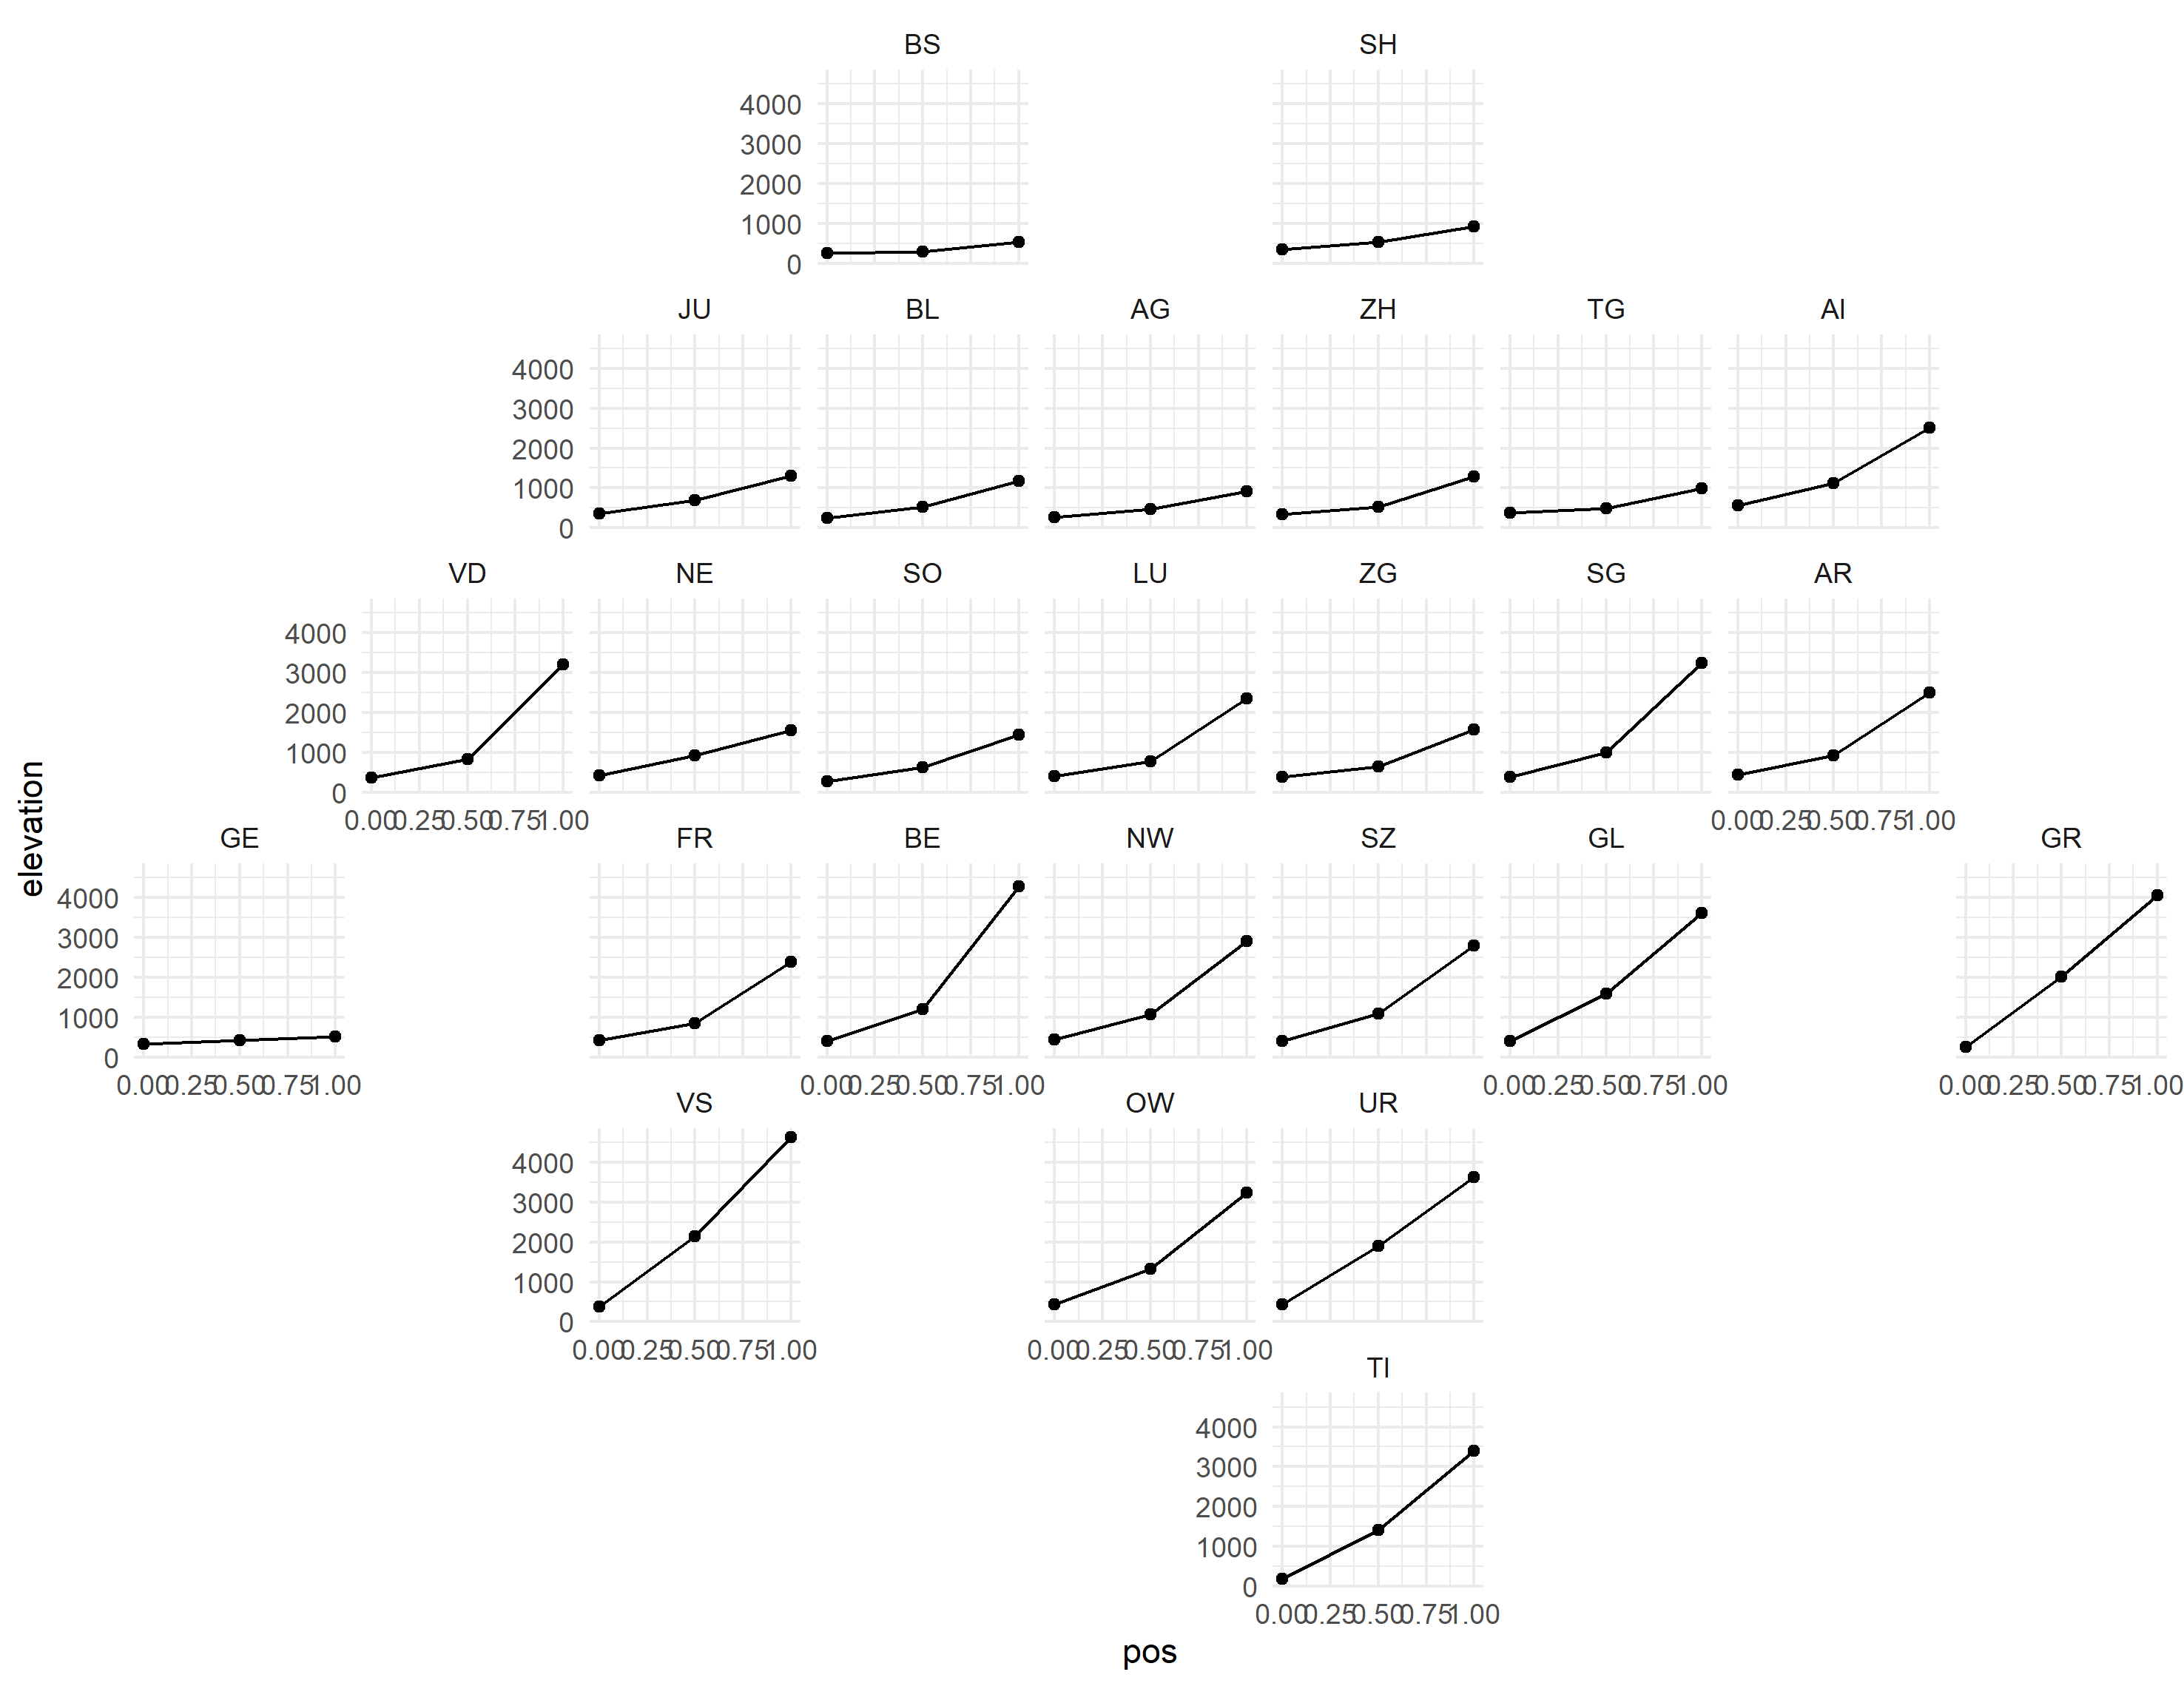
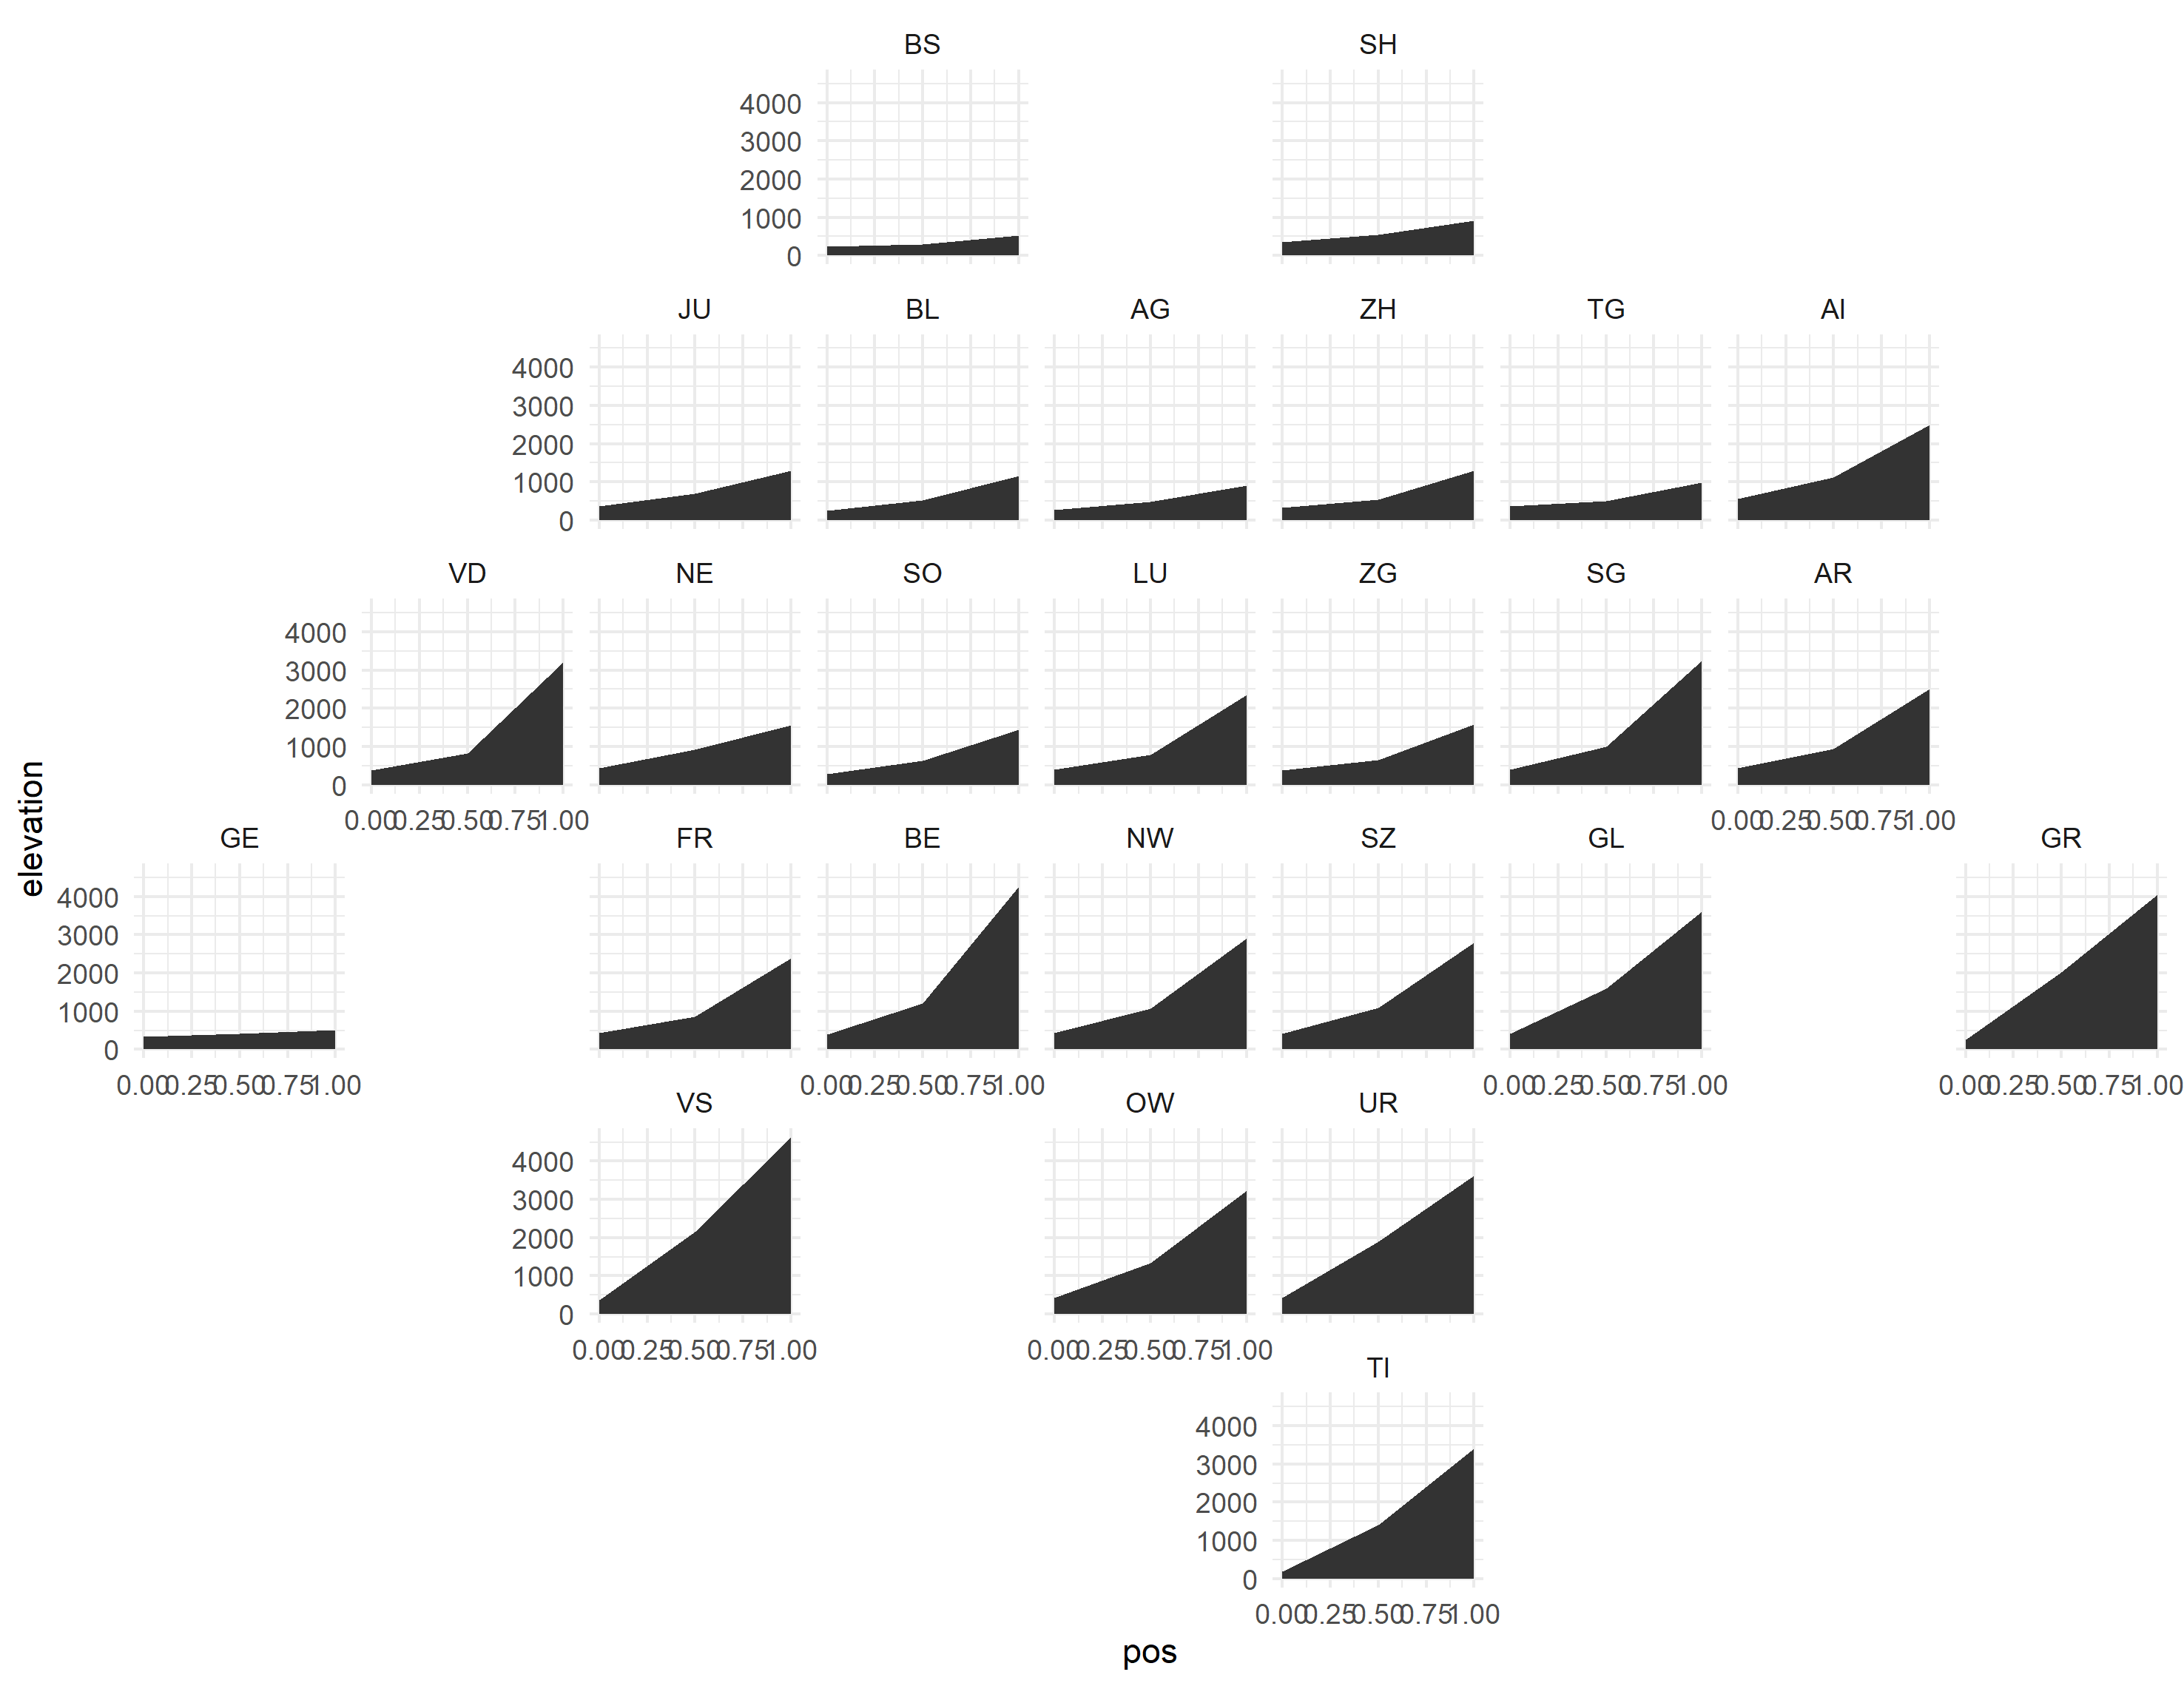
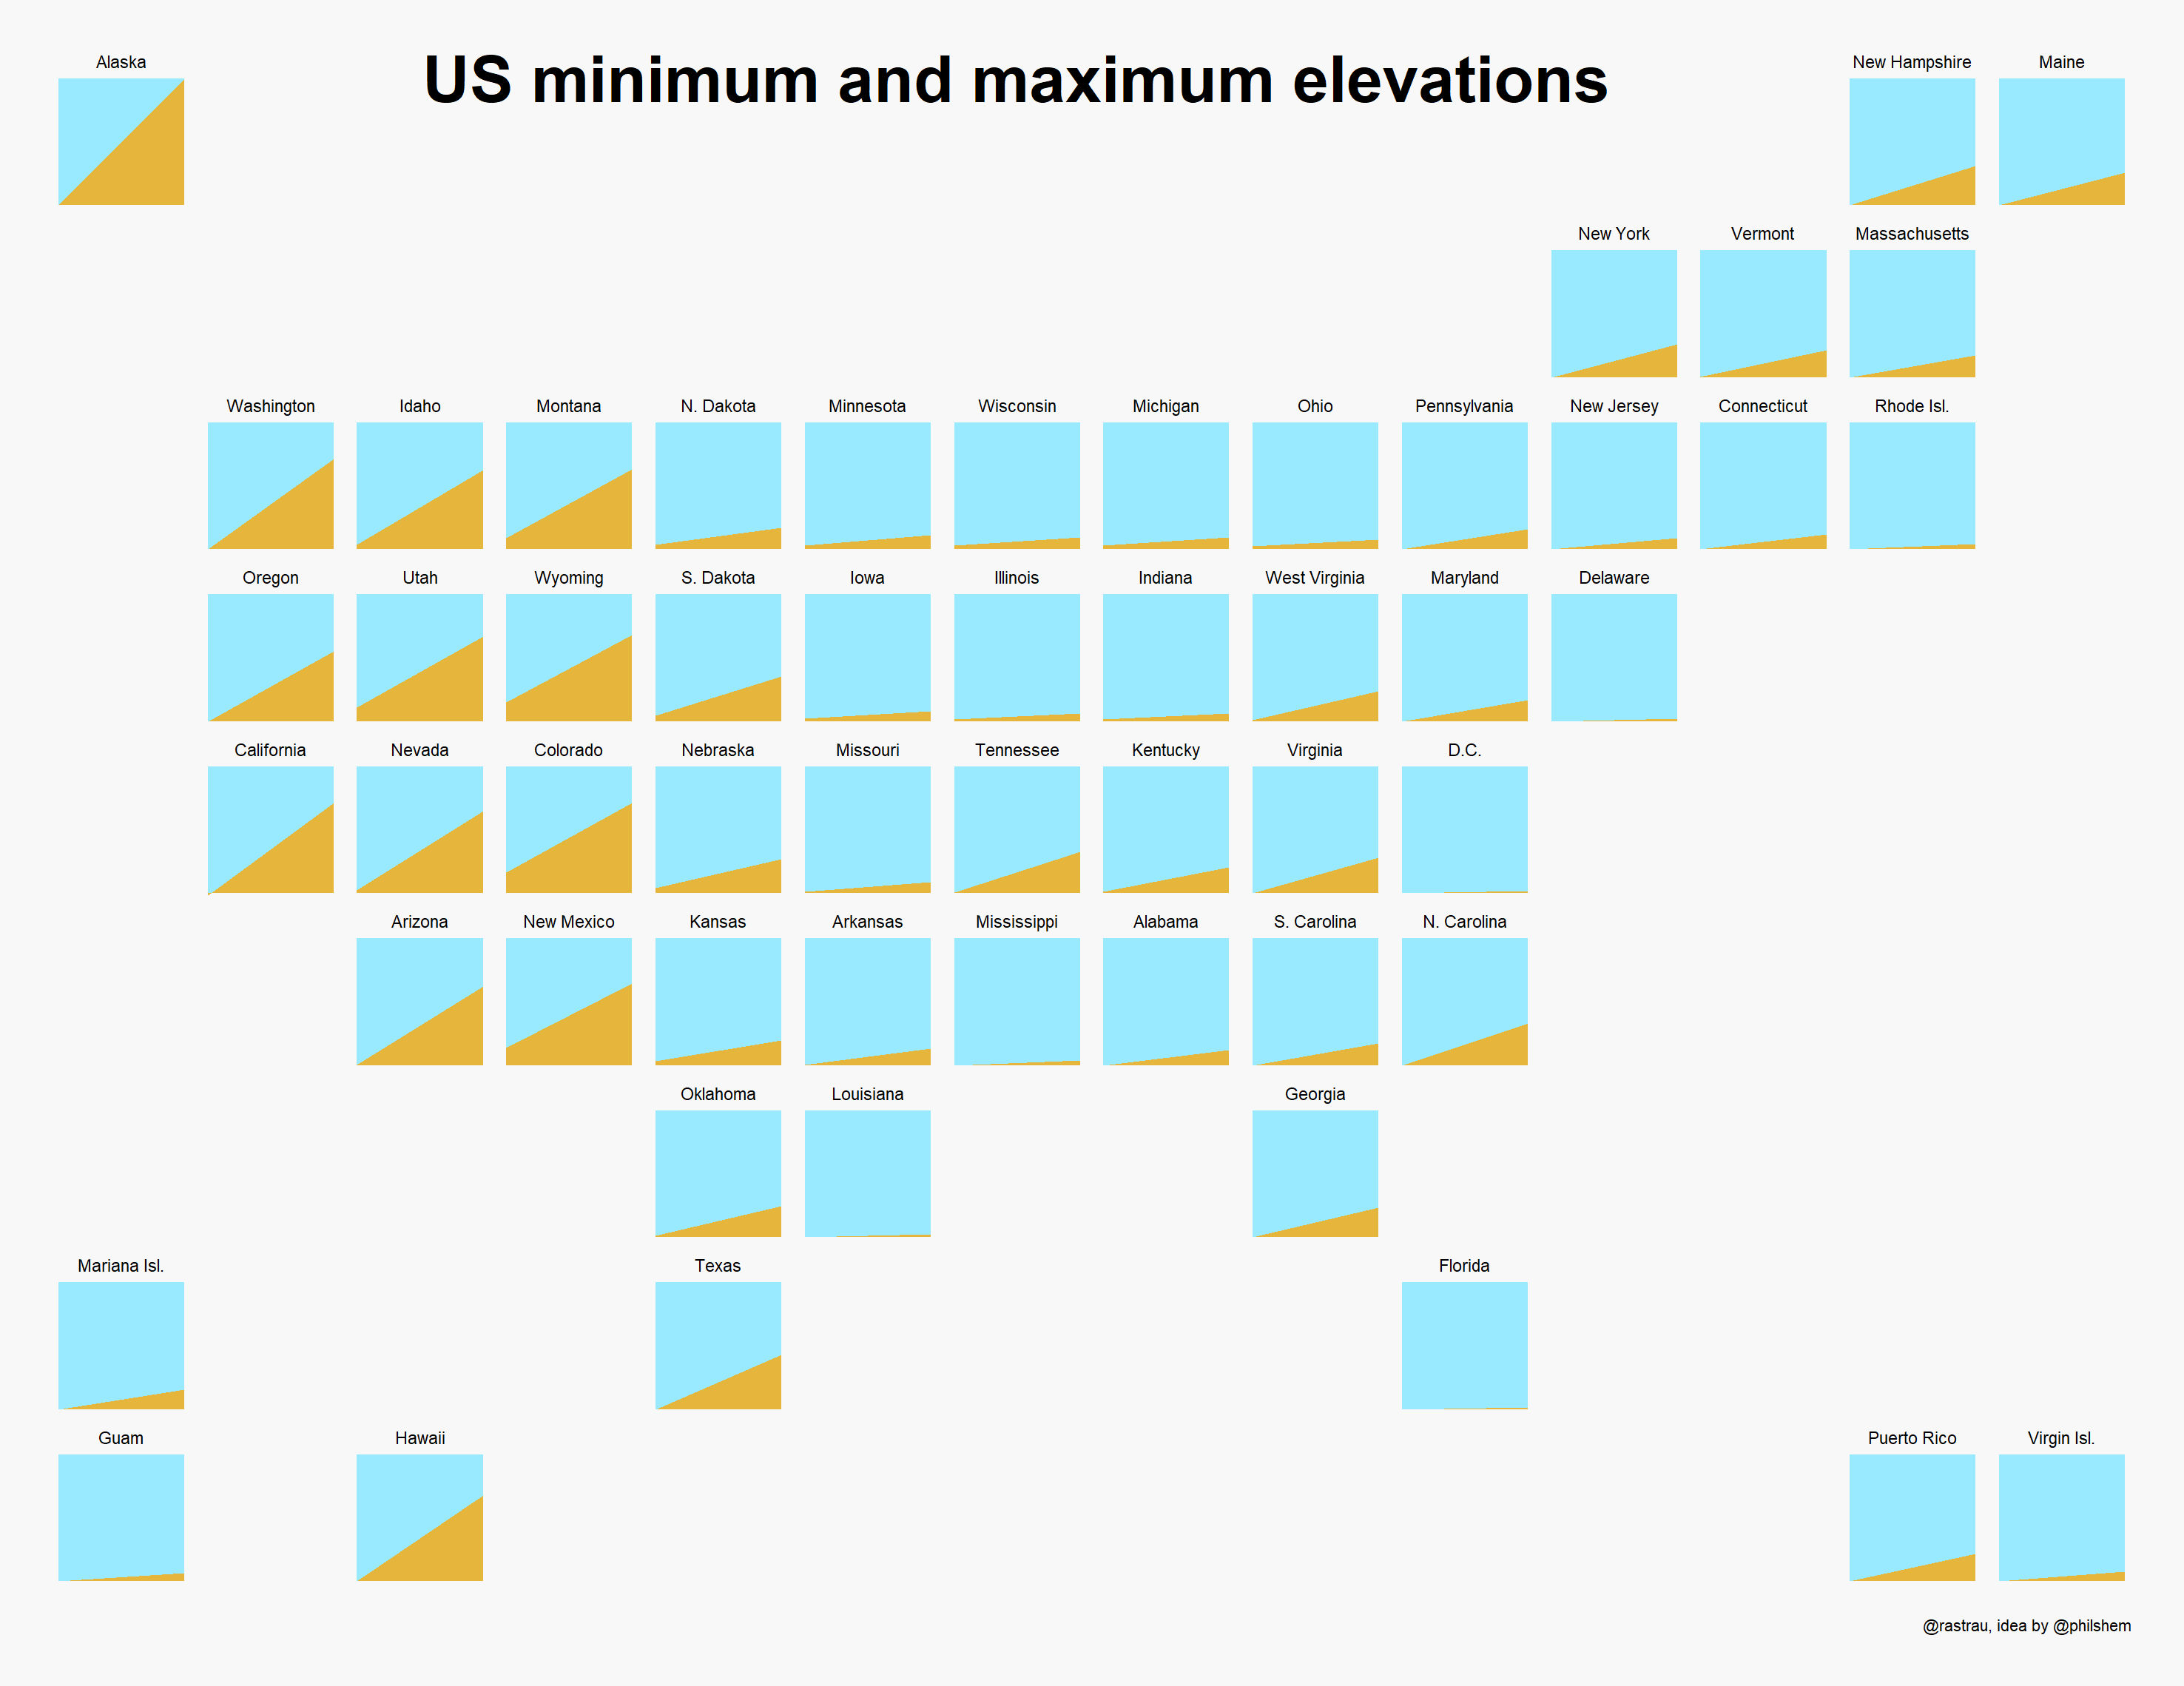
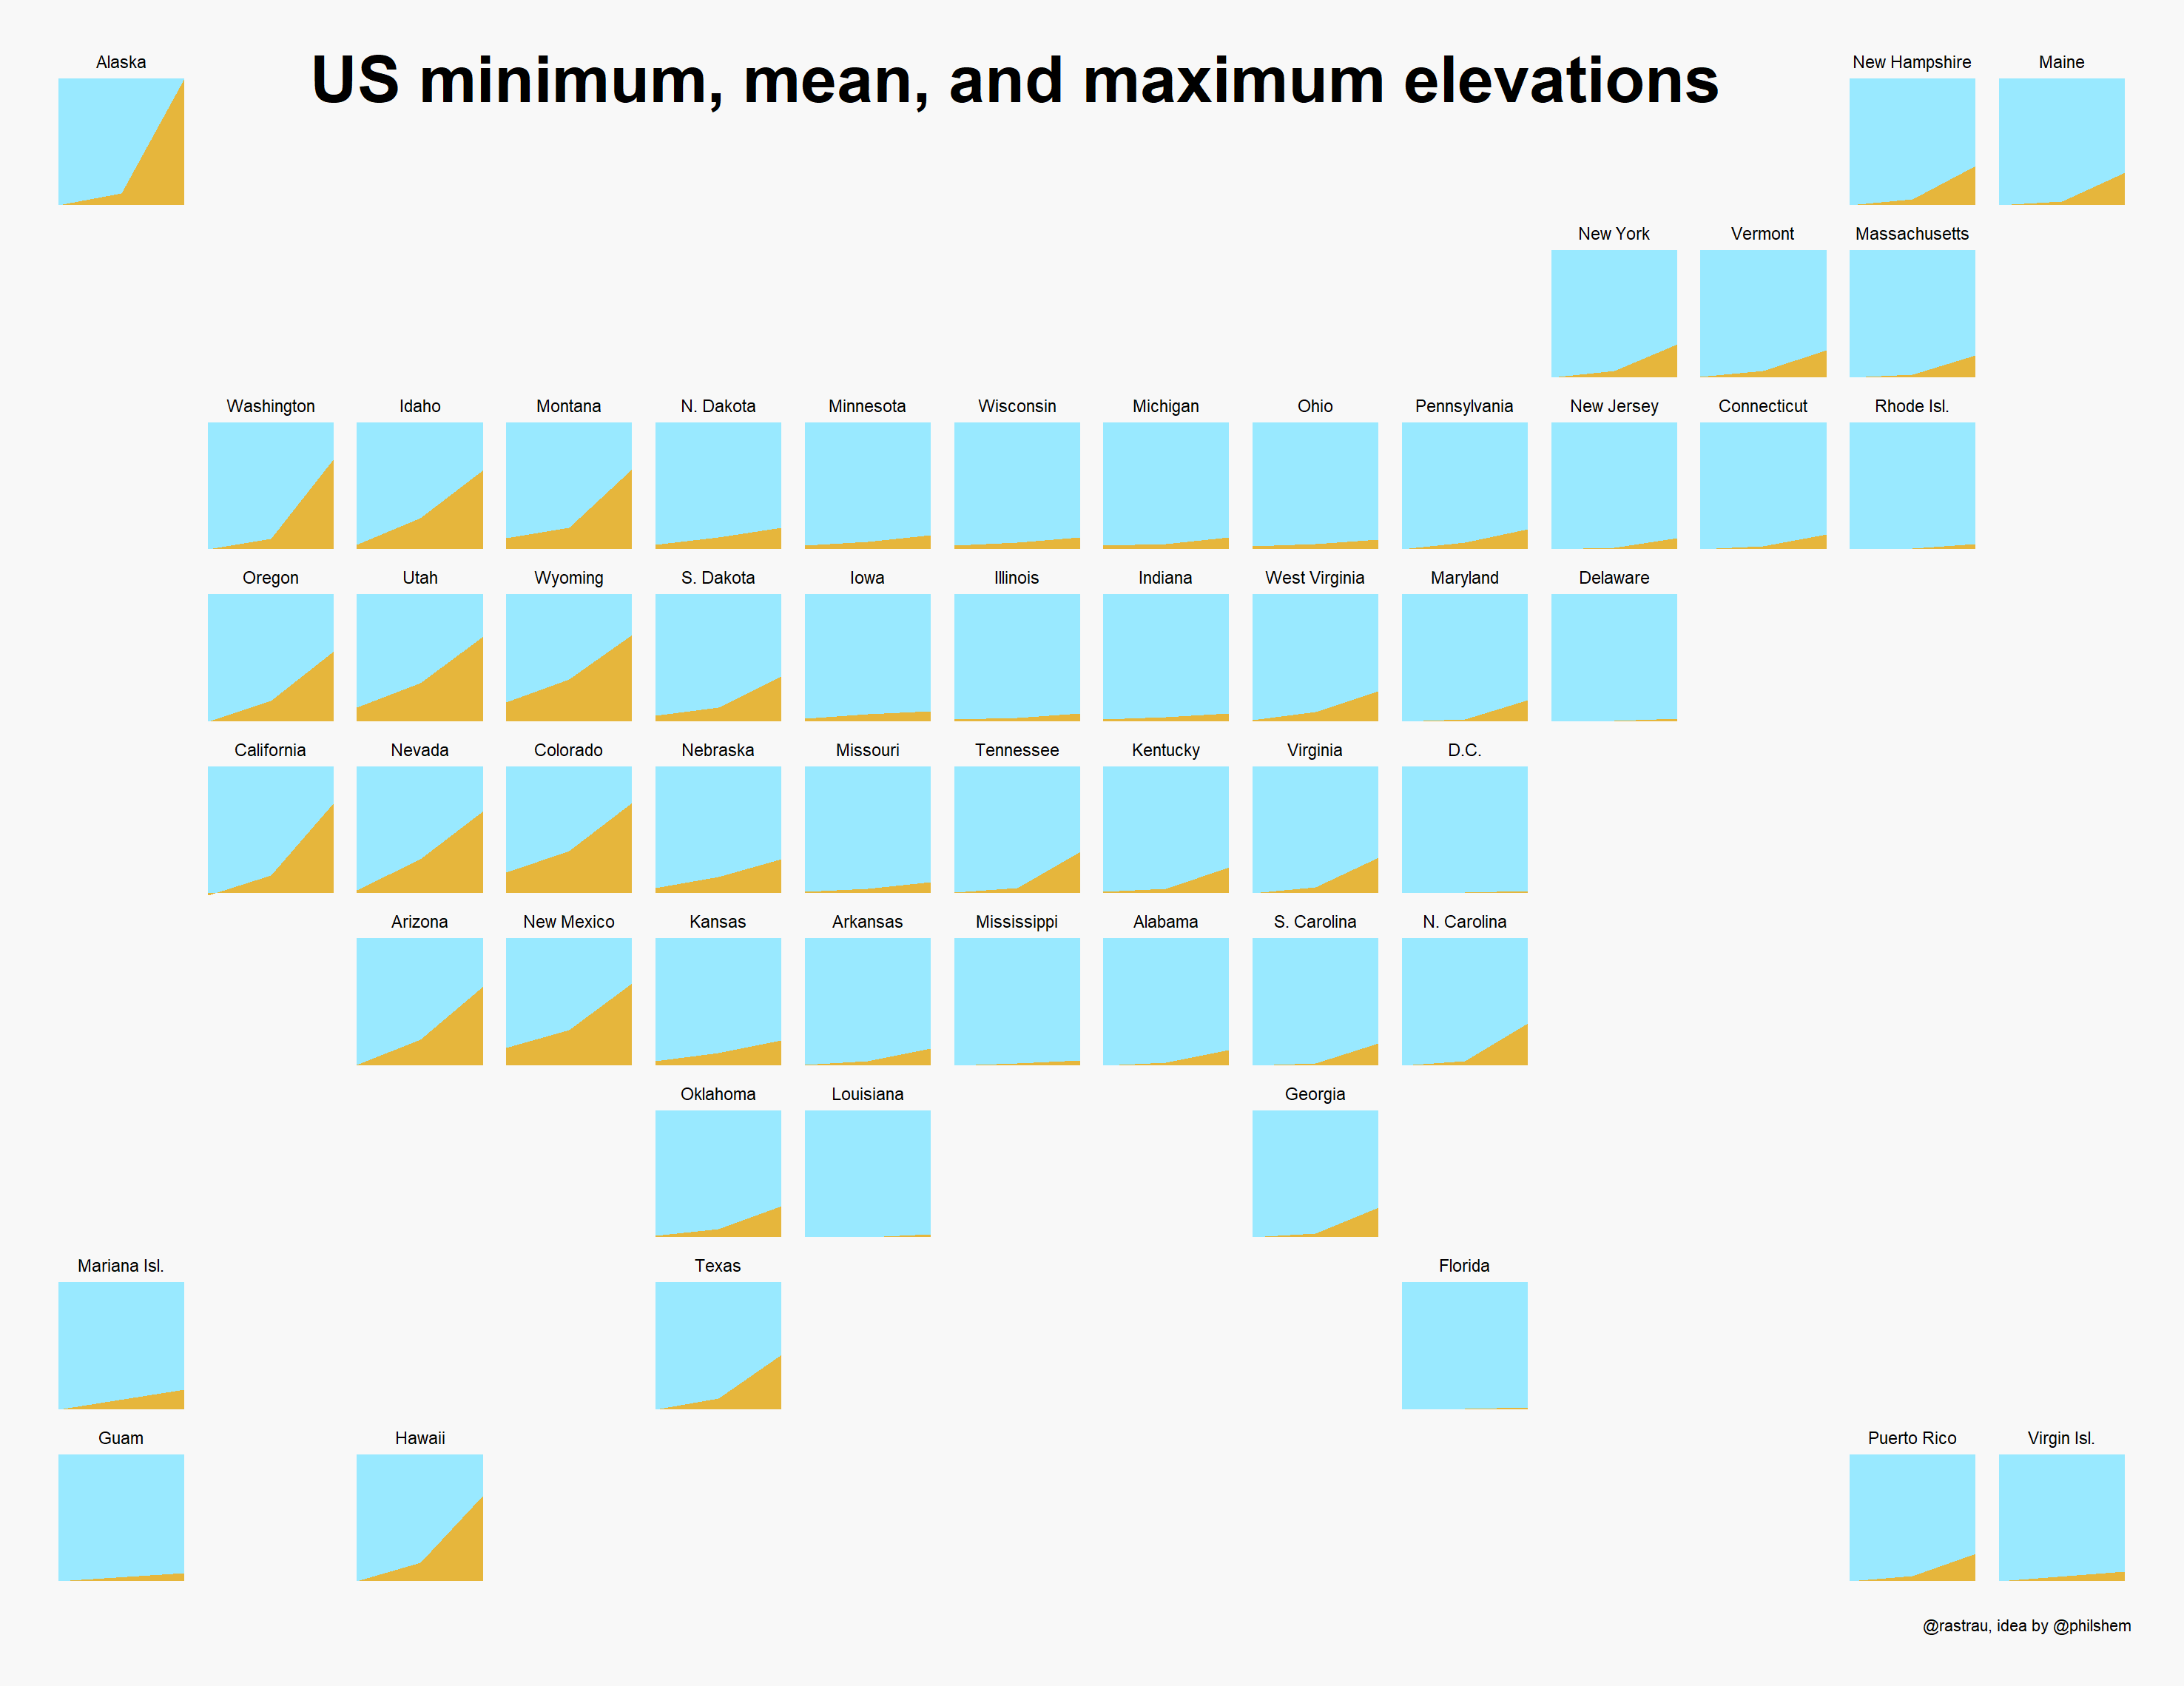
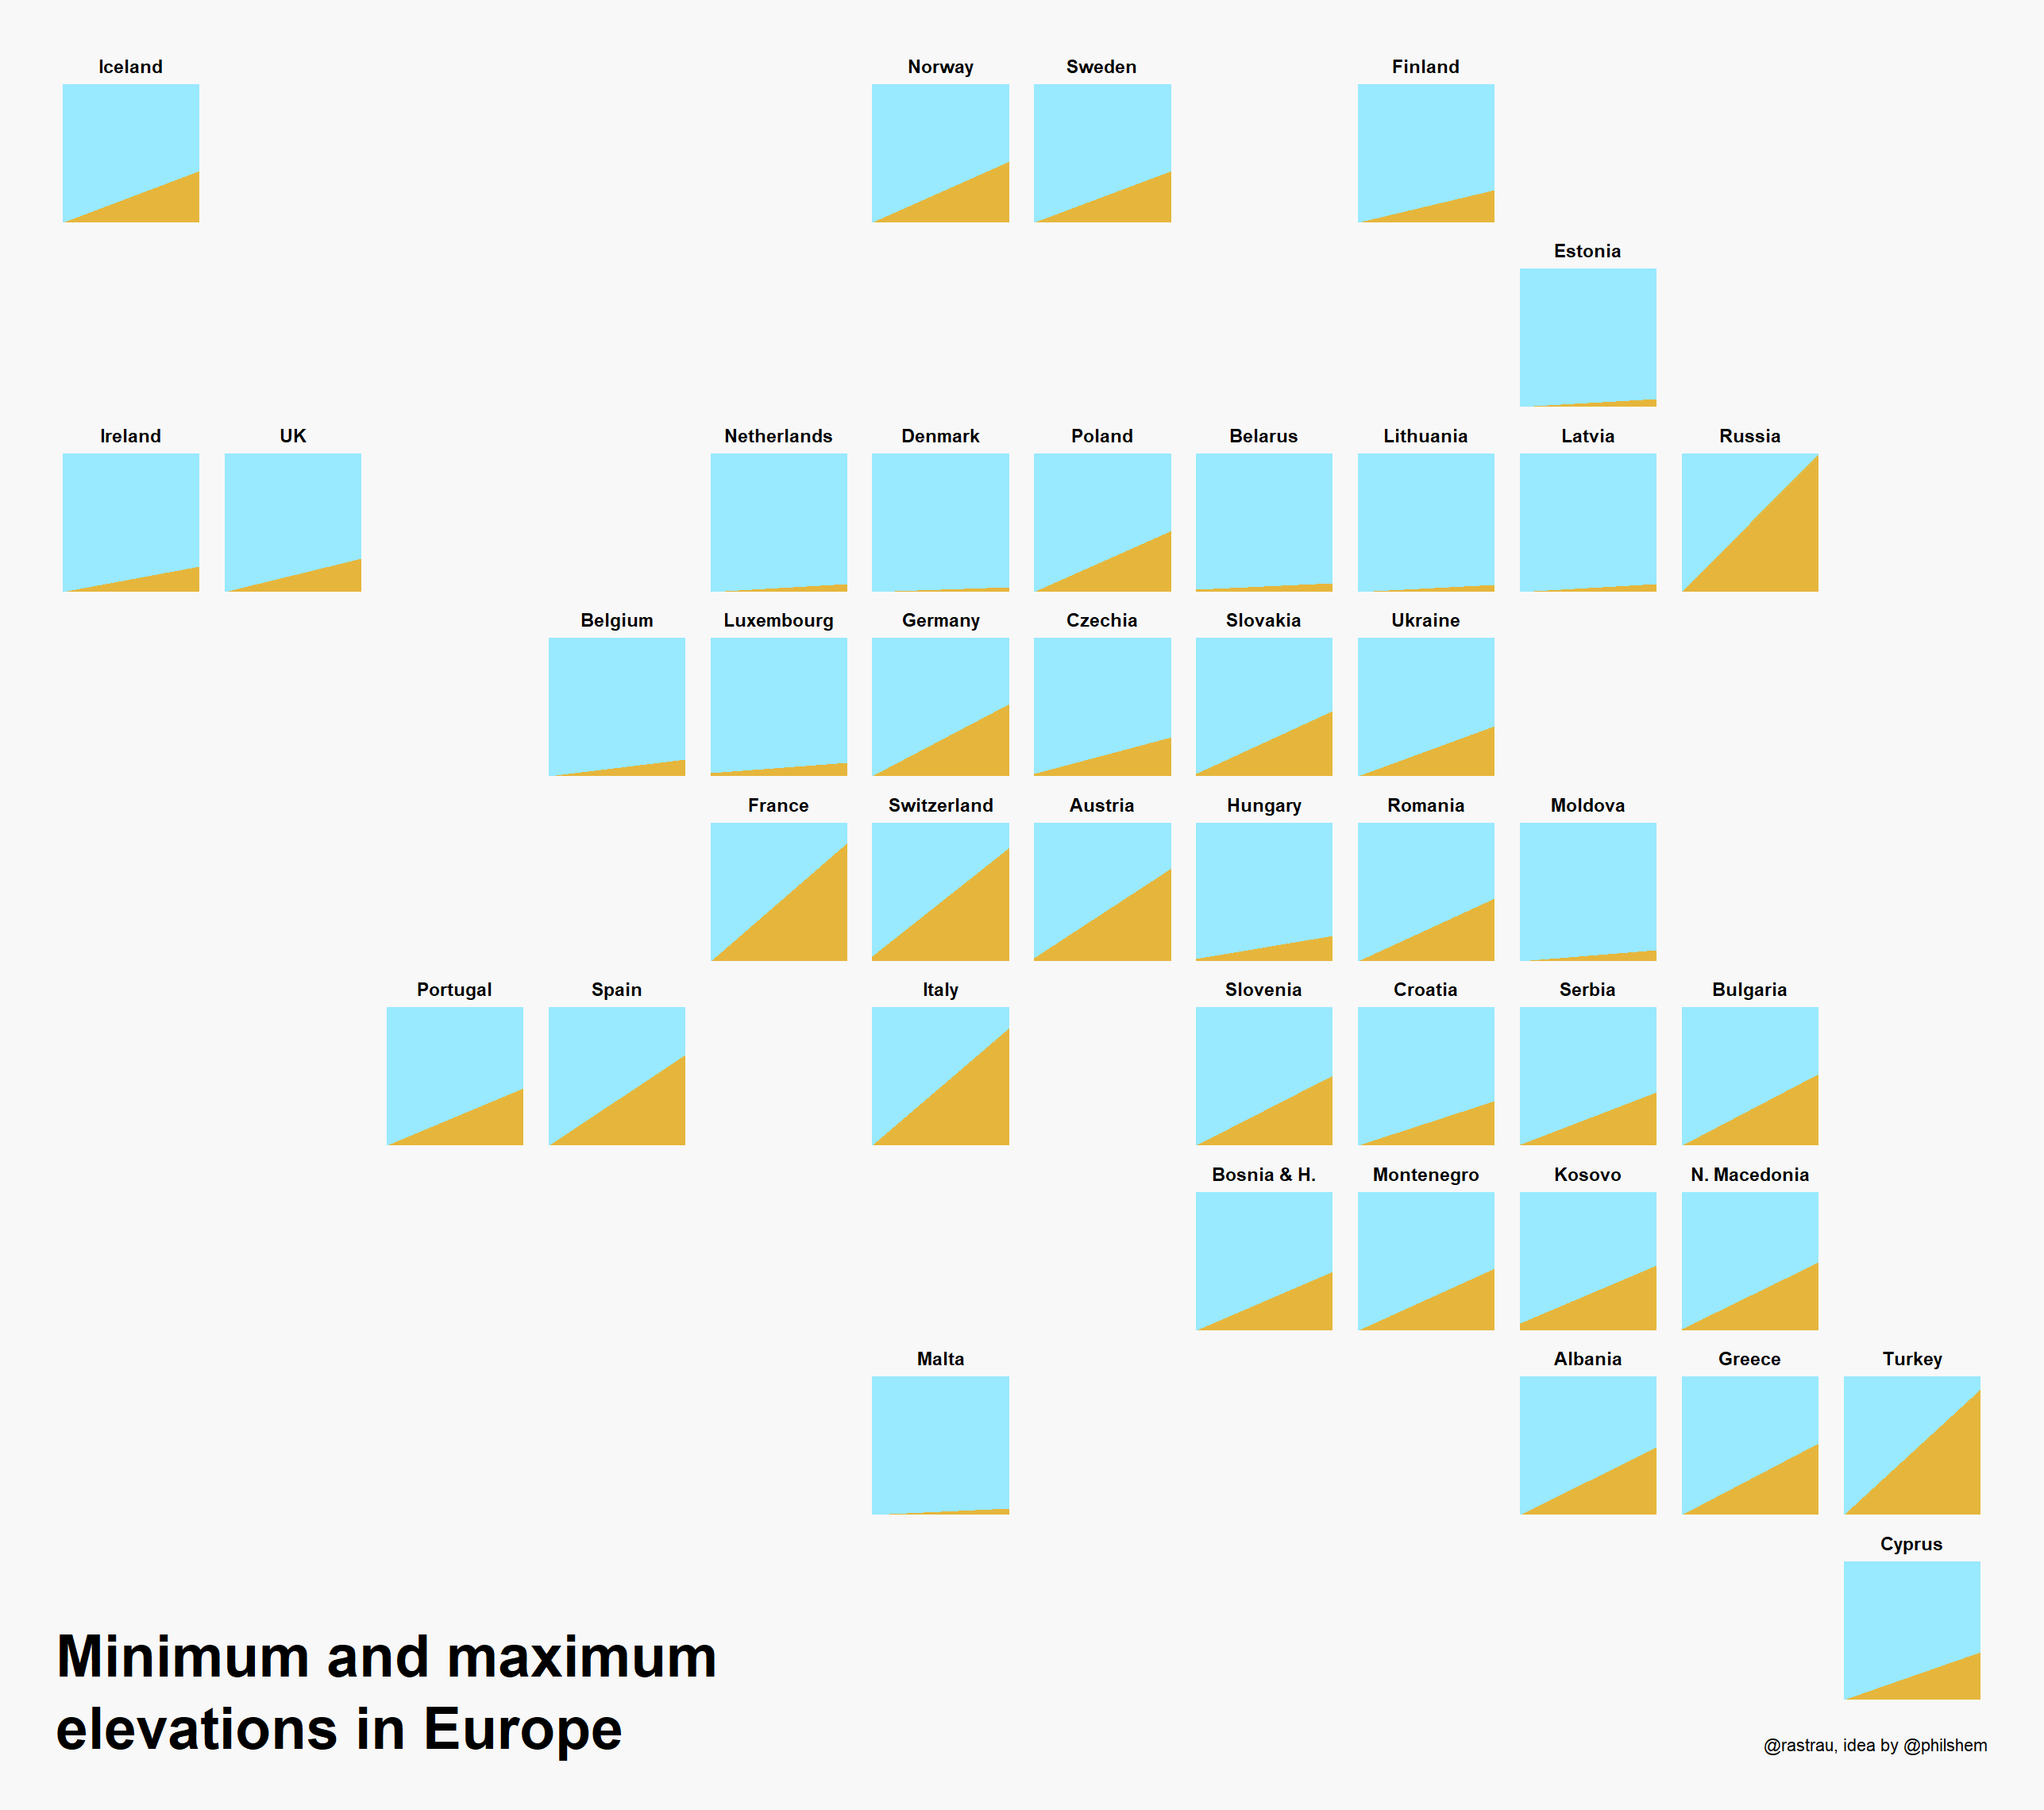
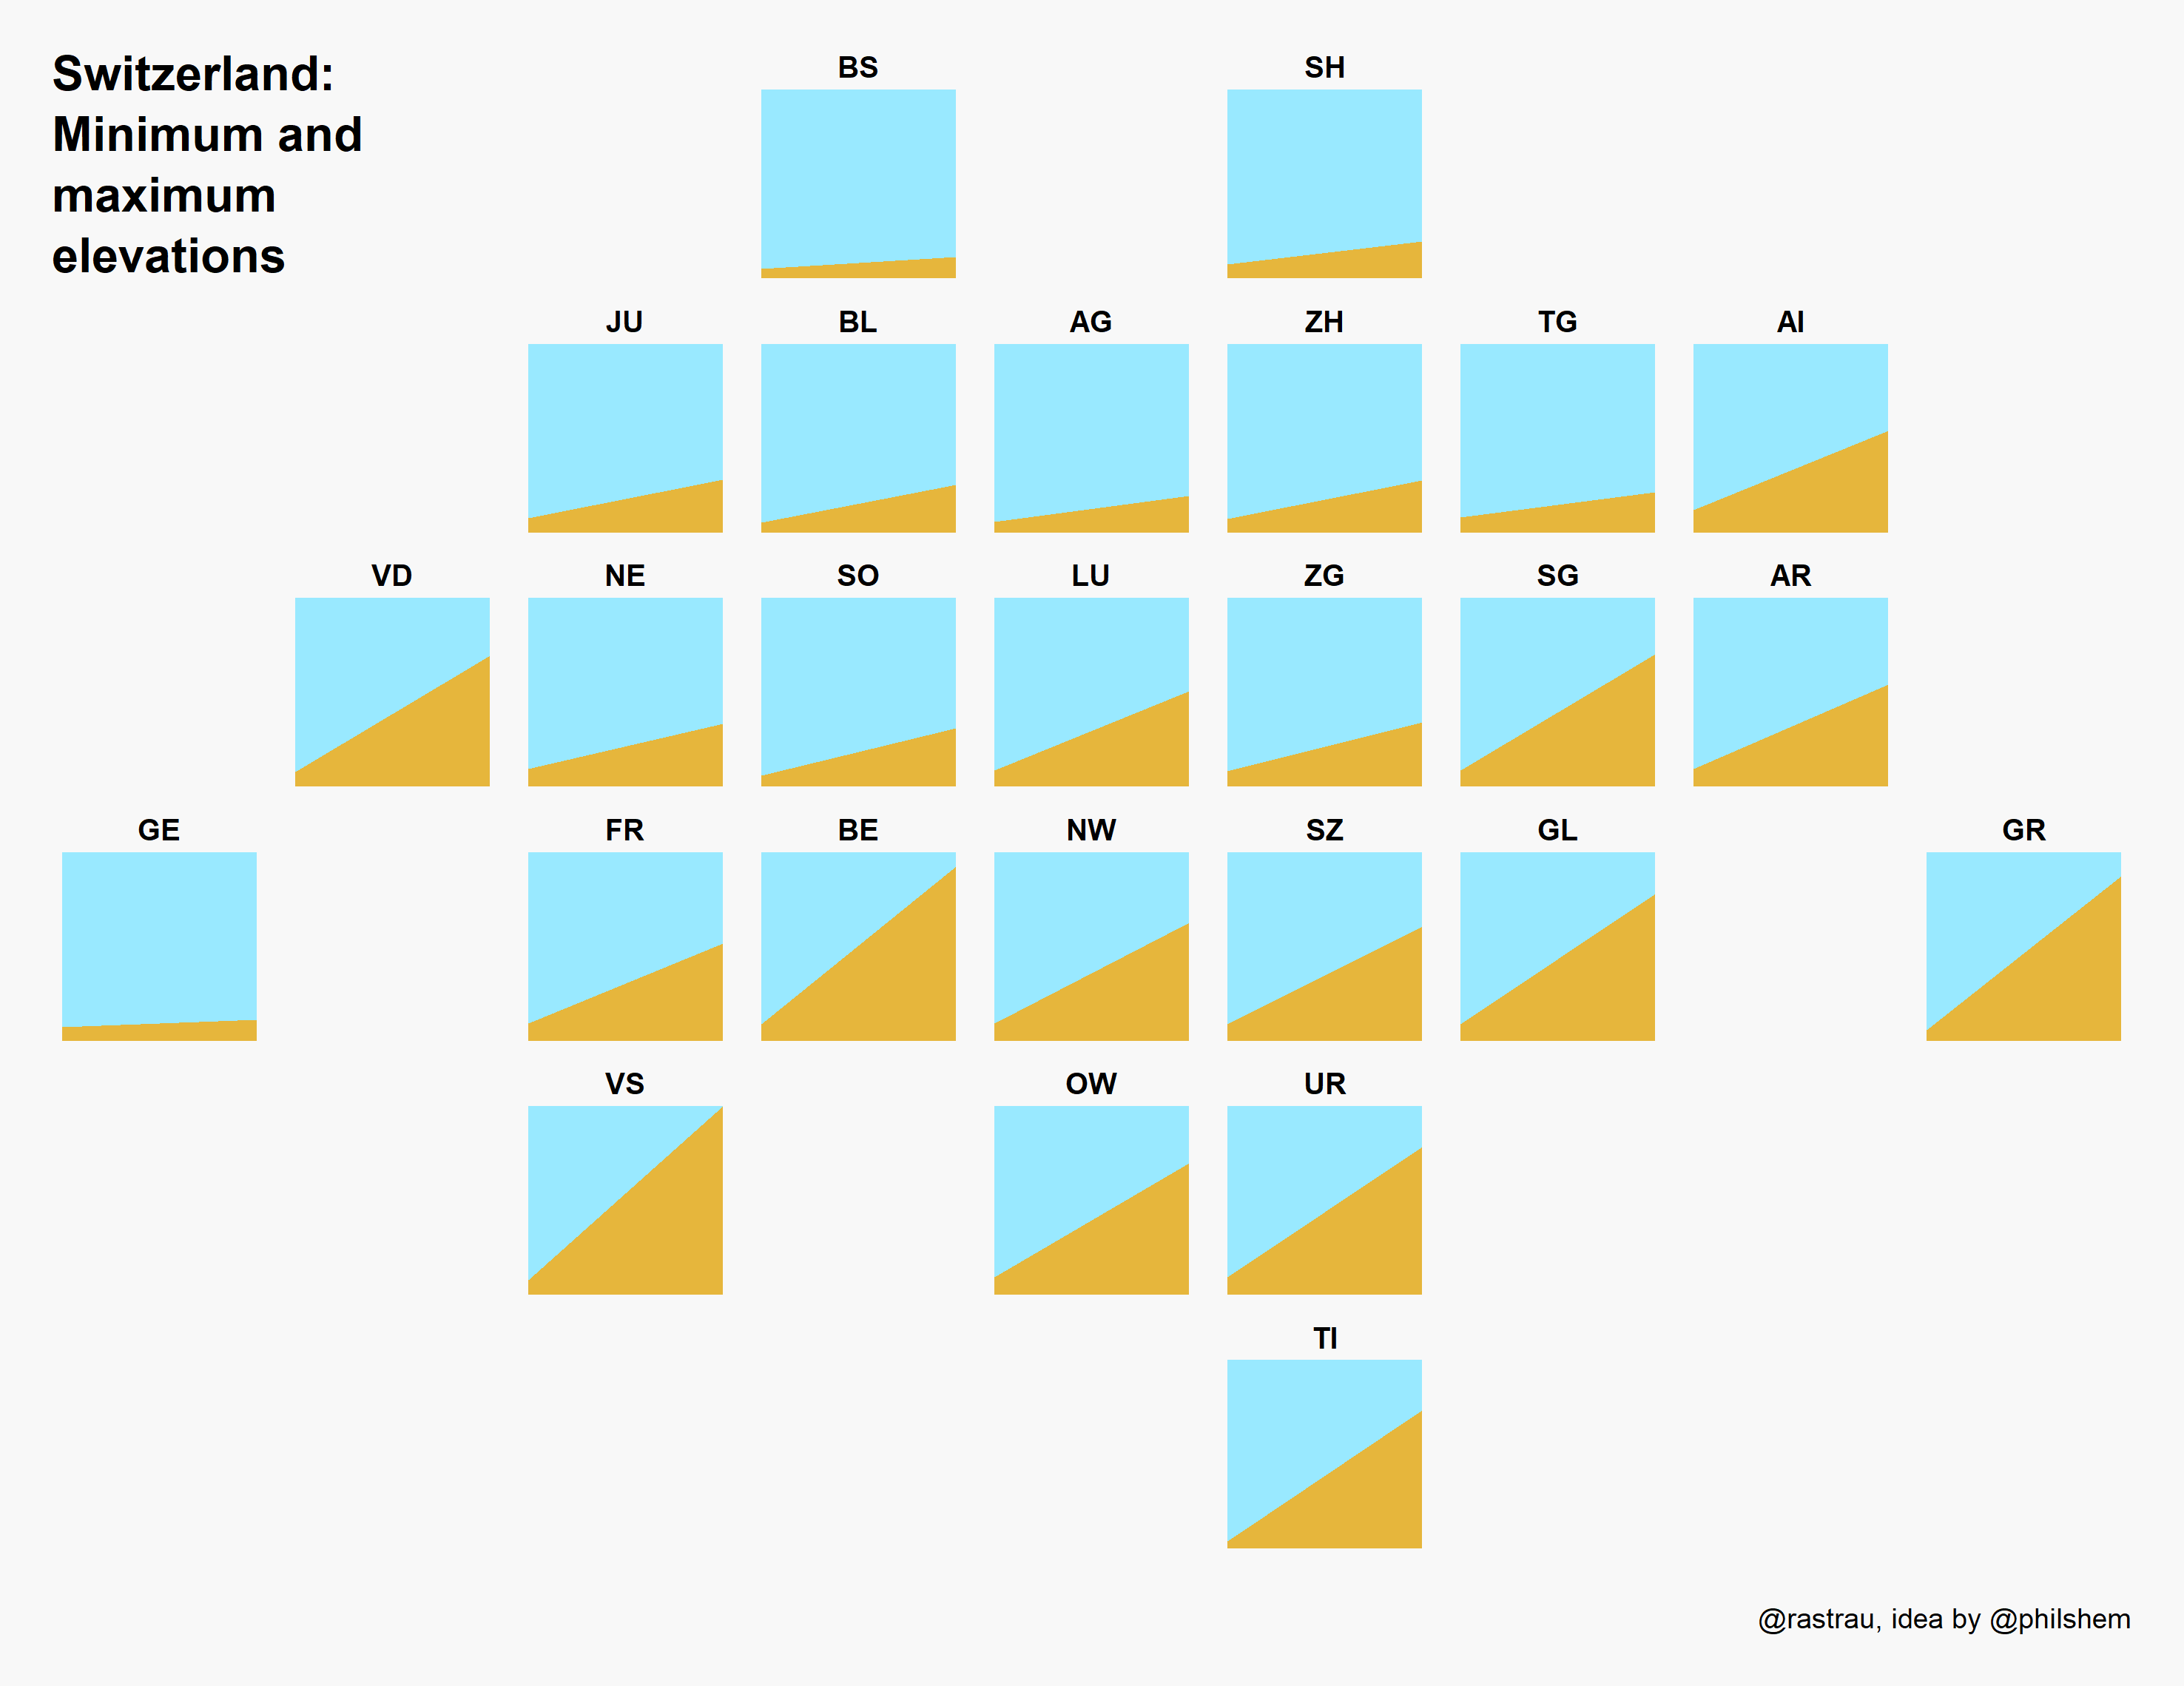
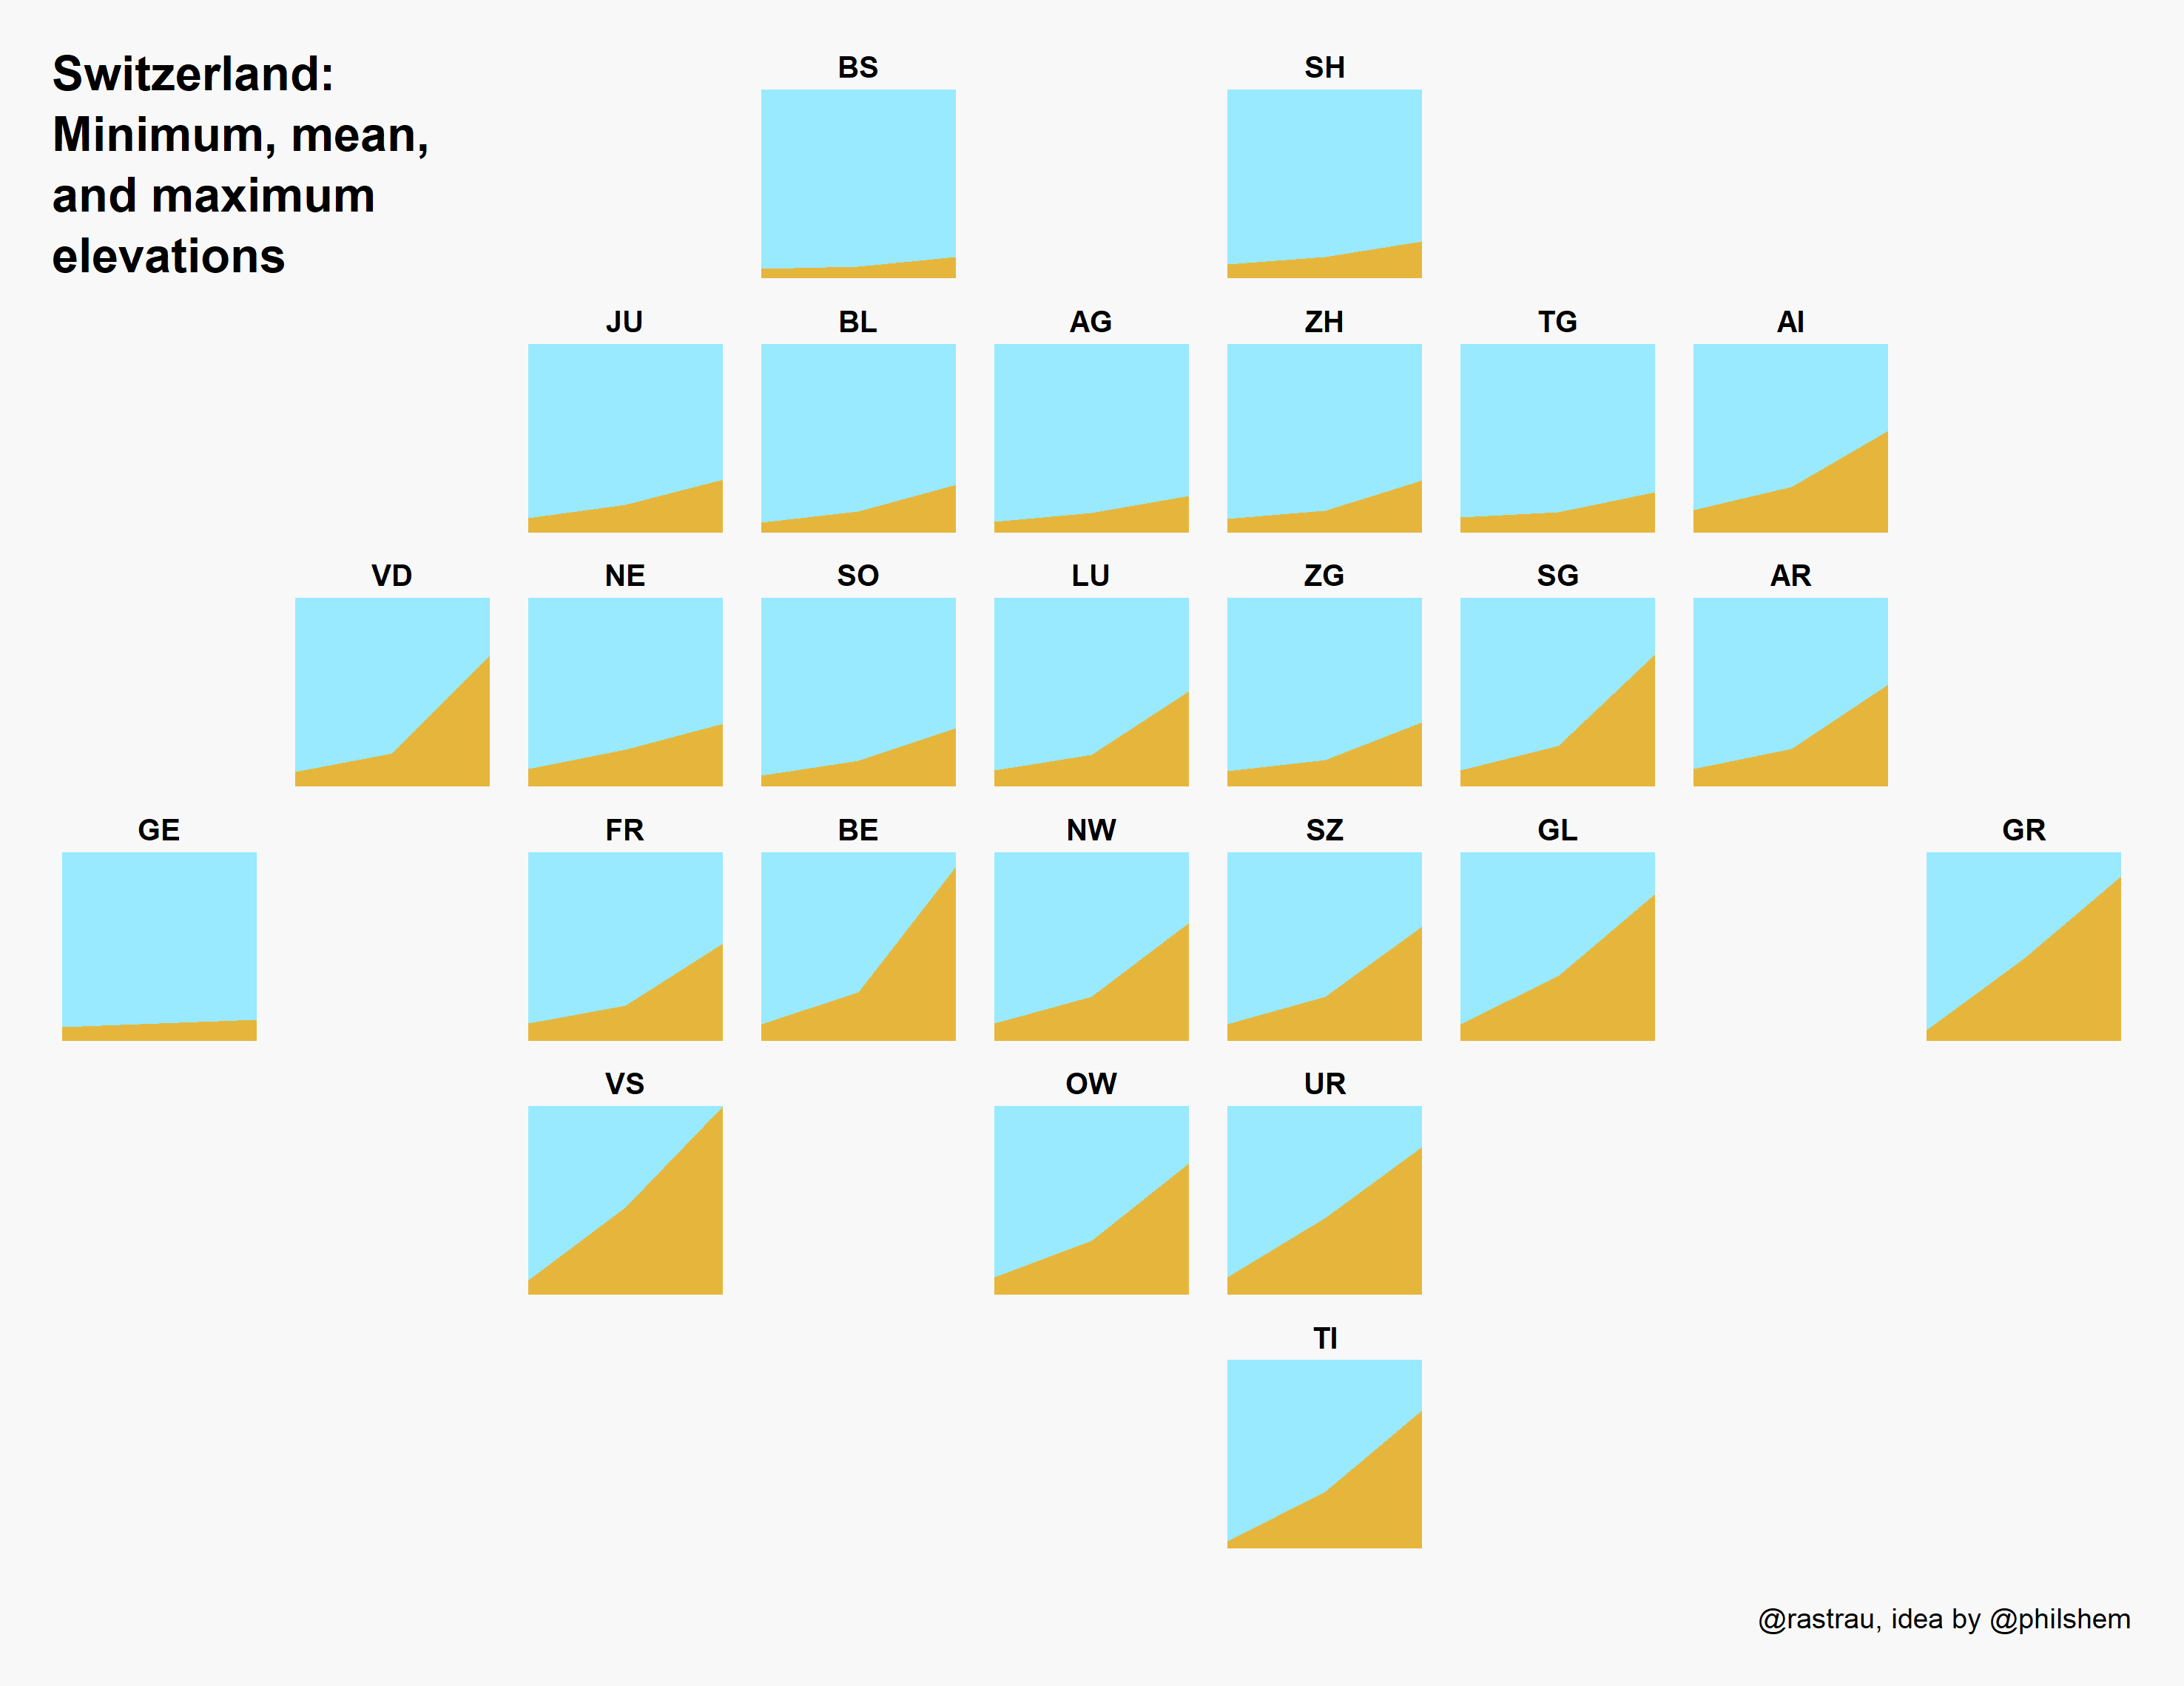
Run us-elevation-plots.R, europe-elevation-plots.R, and switzerland-elevation-plots.R in R in order to produce a slopegraph of minimum and maximum (and for the US and Switzerland: mean) elevation per state or country in the US, in Europe, and in Switzerland, respectively.
Some more background about these type of visualizations and how to make them in R (including custom tilemap layouts) can be found in this blog post: Tile Maps in R
Visualizations
USA
Europe
Switzerland
The code for the US and Switzerland also produces two (unrefined) alternatives / earlier iterations which you could use as starting points for your own experiments if you like: