Crowdfunding platforms like Kickstarter and Indiegogo have been growing in success and popularity since the late 2000s. From independent content creators to famous celebrities, more and more people are using crowdfunding to launch new products and generate buzz, but not every project has found success. To receive funding, the project must meet or exceed an initial goal, so many organizations dedicate considerable resources looking through old projects in an attempt to discover “the trick” to finding success. Here is an analysis to uncover any trends to success.
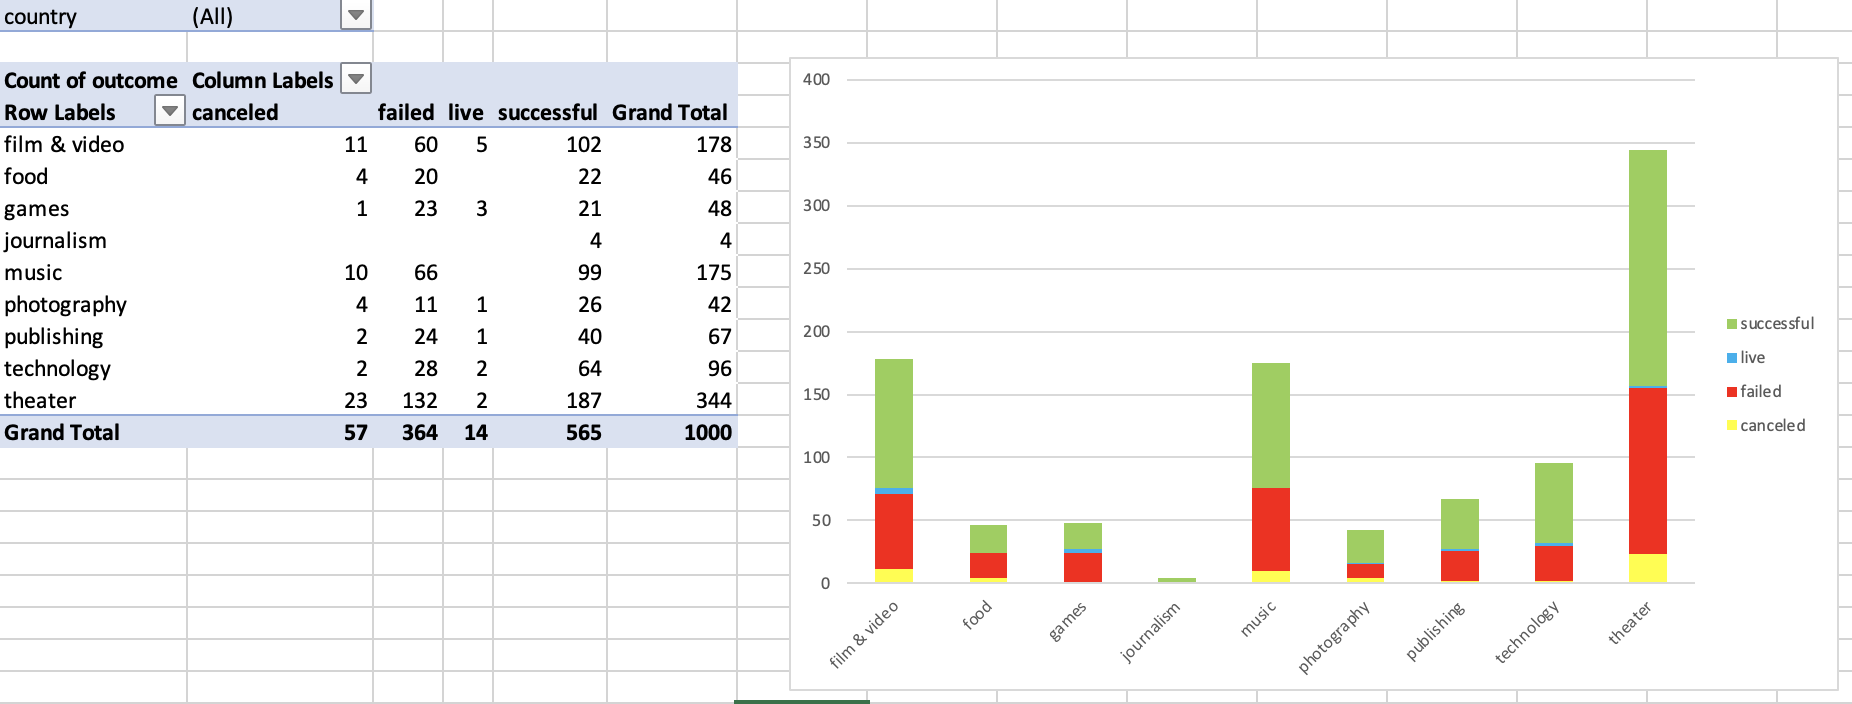
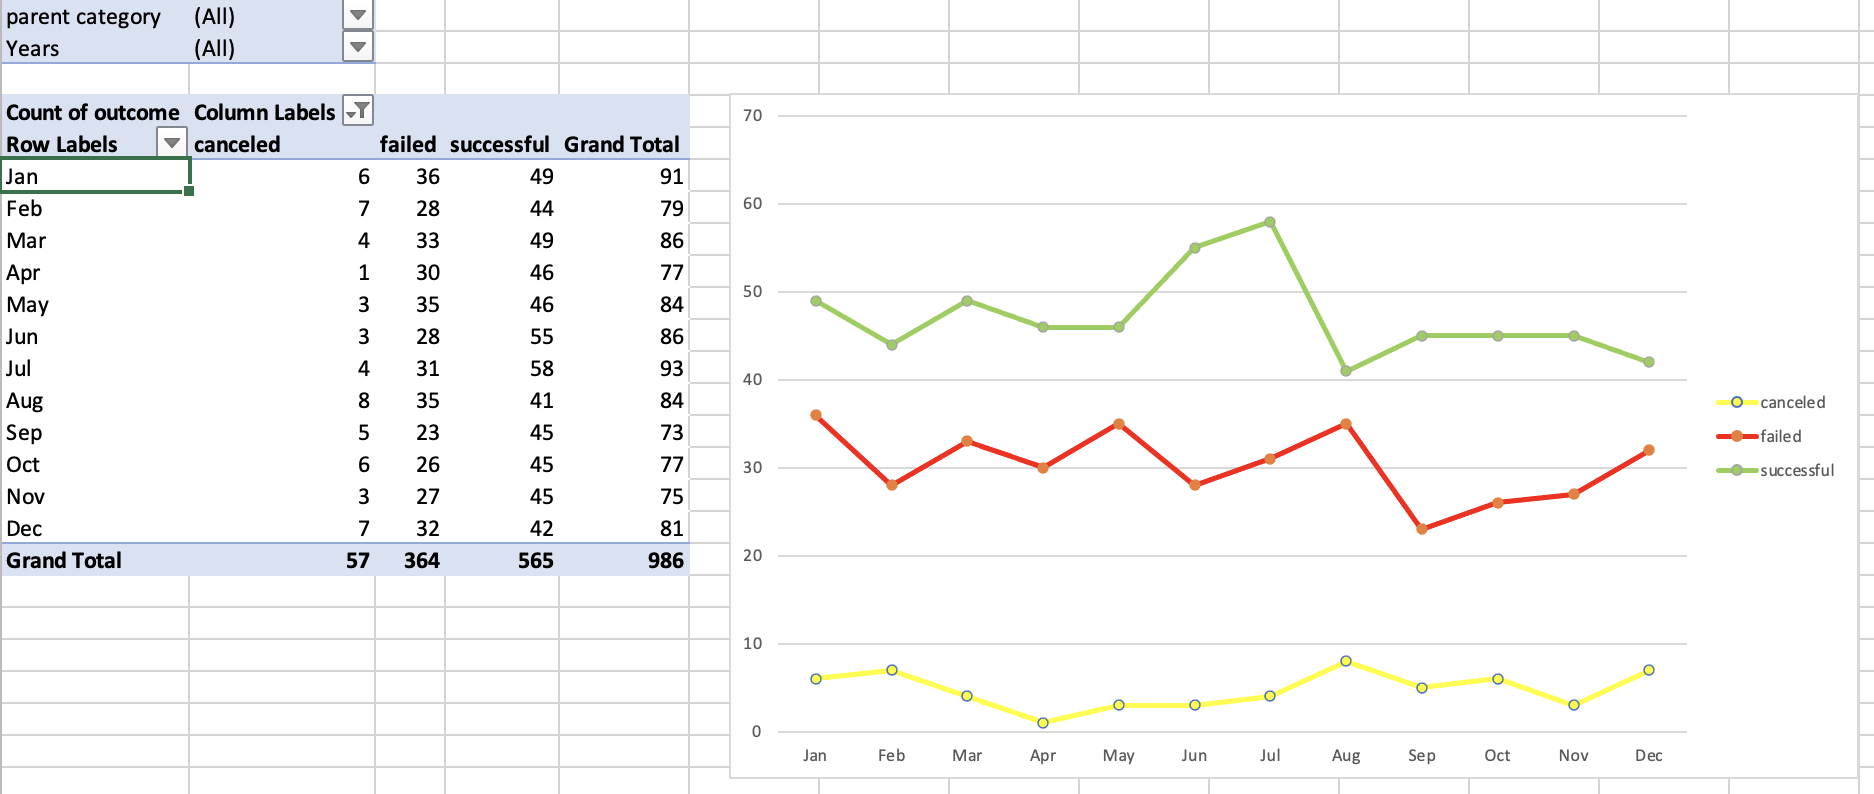
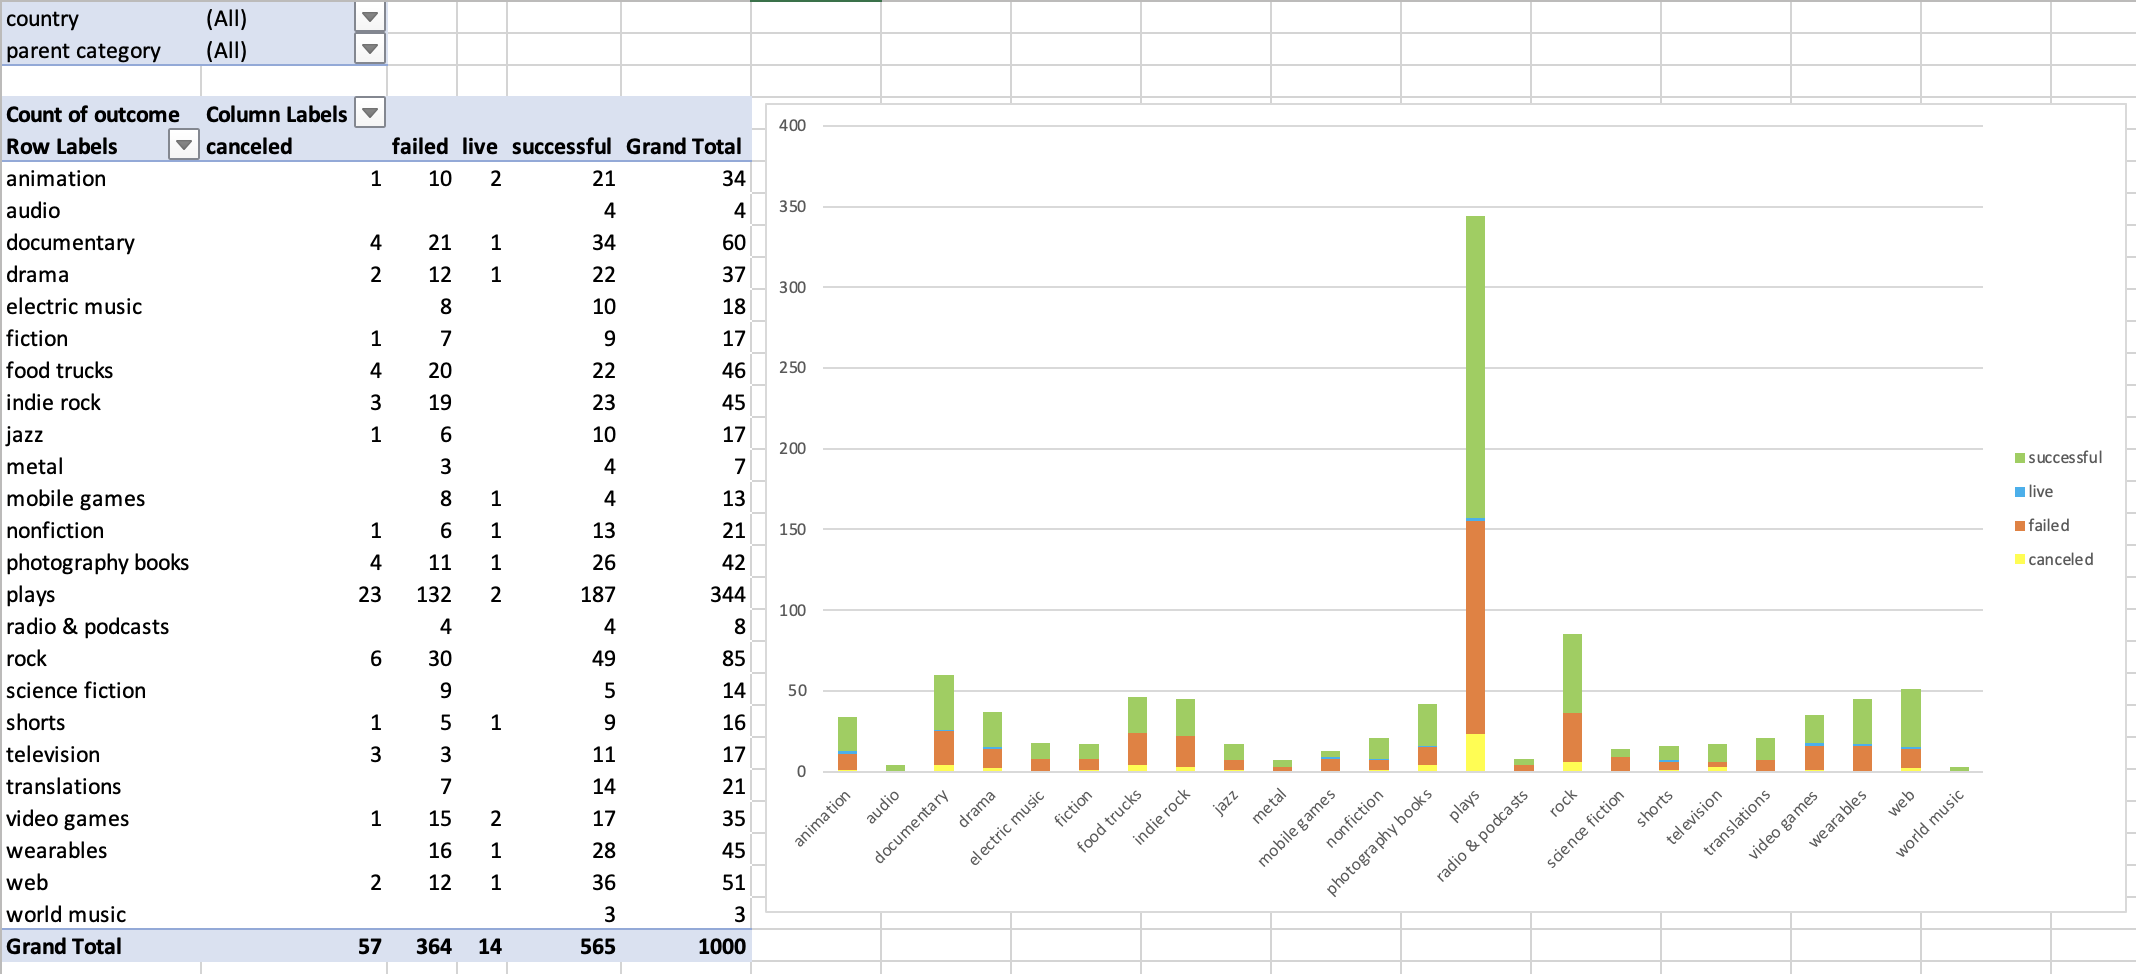
After looking at all three graphs I can conclude, Technology has the highest percentage of success above other categories at 67% followed by photography (61.9%) then publishing (59.7%). Campaigns completing in the months of June and July have a higher success rate, while August to December accounts for a decreasing success rate. Although most fields within the entertainment industry, such as theater, film & video and music, have the highest participation on these platforms, gaming, a large proportion of the industry is significantly less present.
Limitations can be found in the parent category of journalism has a 100% success rate but with a small dataset of four. It is thus premature to come to a conclusion. The same can be said for sub-categories metal, rock and world music as they all have similarly small datasets. Another limitation is not including other crowdfunding platforms such as GofundMe, FundRaze or Rockethub.
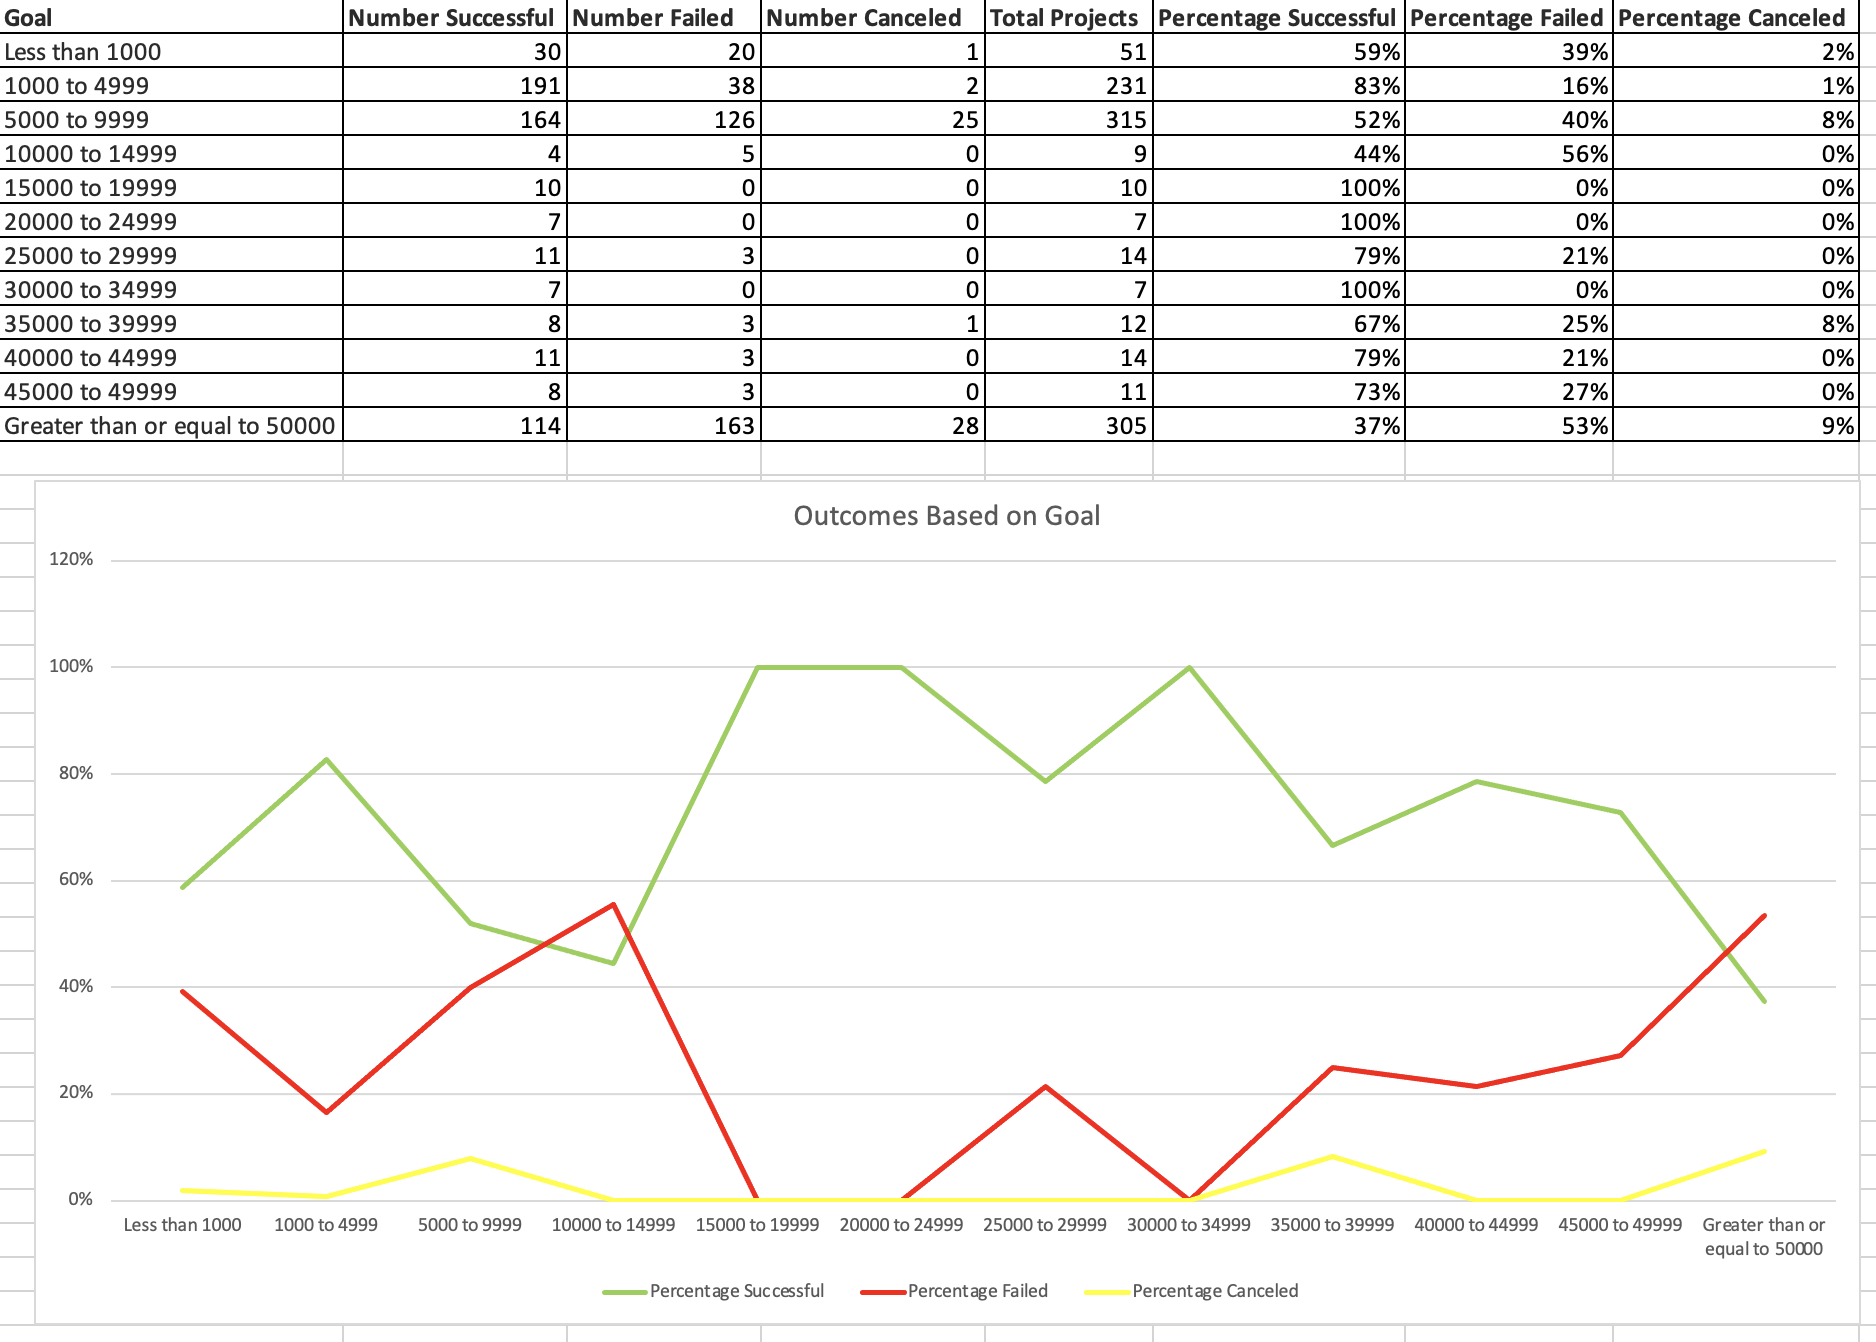
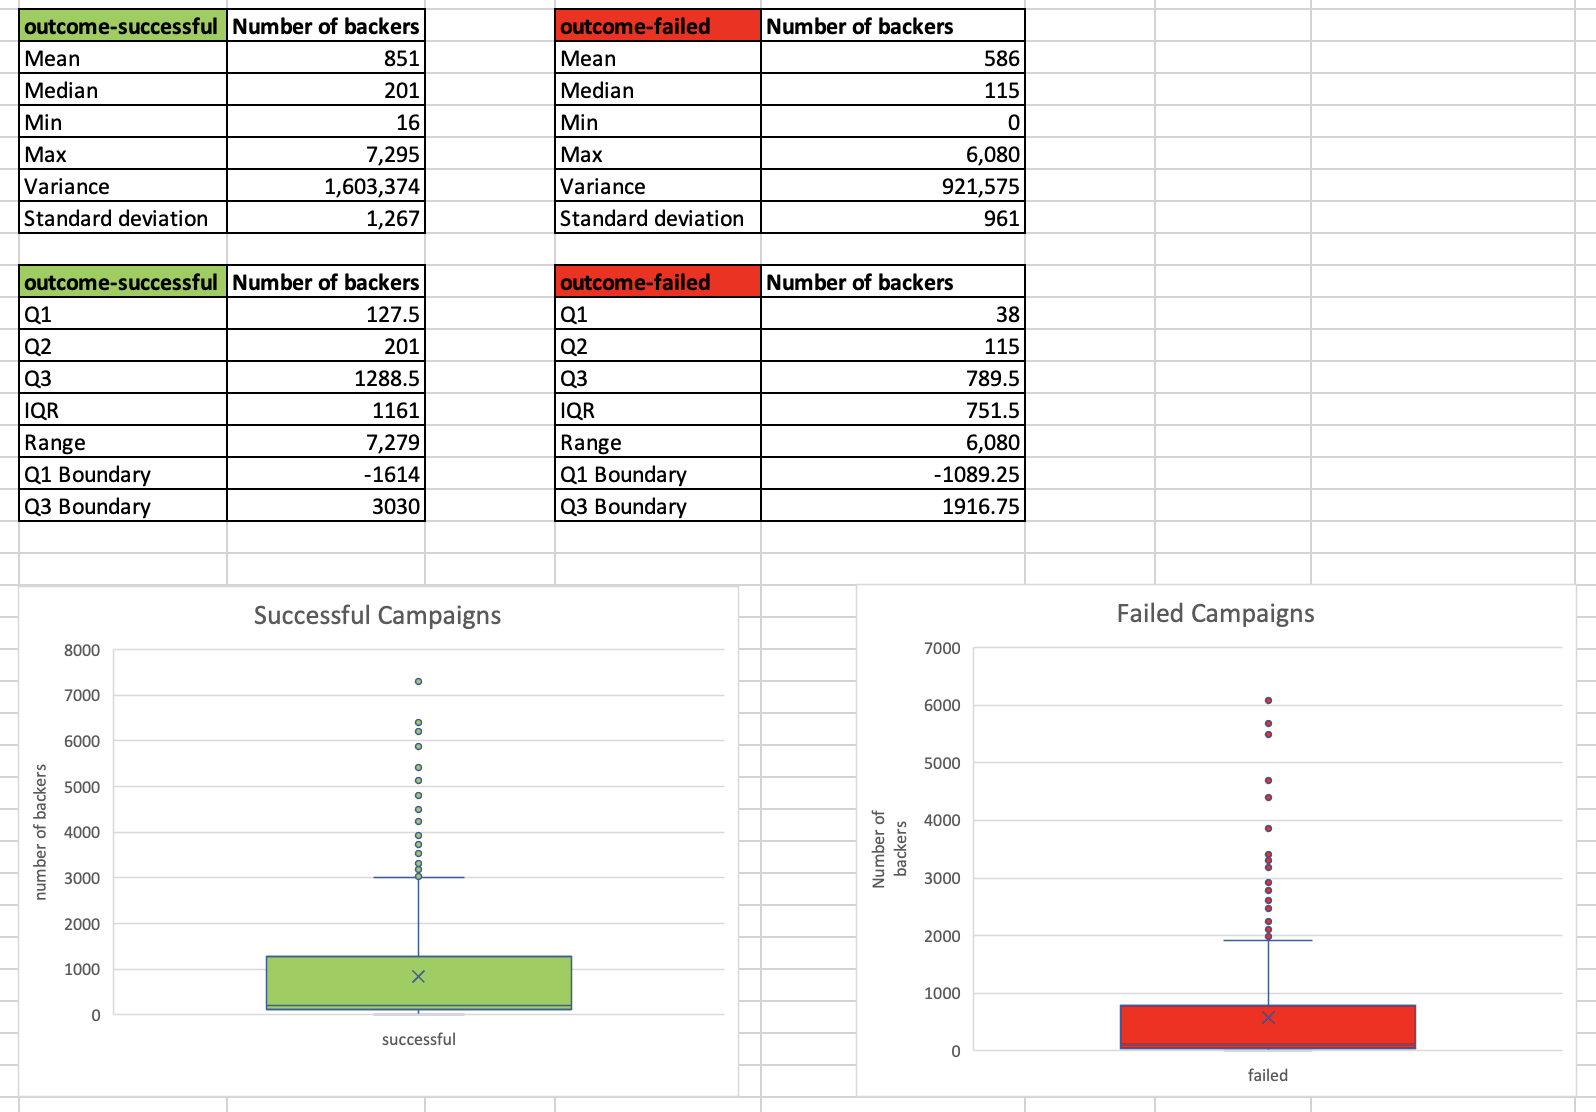
We haven’t factored in the duration of campaigns for successful and failed projects. A bar graph would be helpful in this case with the number of days on the x-axis and number of successful or failed projects on the y-axis. If we also plot the goals to percentage of successful, failed, live and canceled on a line graph we can see what goals are more likely to succeed. We have also yet to understand the number of backers for each project. Here a box and whisker plot would be helpful in finding the average, median, and distribution of the number of backers.
Median is a better measure of central tendency as illustrated by successful and failed box and whisker plots. Both display multiple outliers above the top whisker. Inclusively, the median and mean are not similar in value, thus, the data is skewed to the higher number of backers. This may suggest projects with and increasing number of backers have a higher likelihood of a randomized outcome. Or, conversely, projects with high set goals carry greater uncertainty in their outcome.
Looking at the Interquartile range and range of successful and unsuccessful campaigns, the successful campaigns have higher variability. This makes sense as successful campaigns have a wider spread of data than failed campaigns.
