Monitoring and profiling Spark applications in Databricks with Prometheus, Grafana and Pyroscope
Table of Contents
Dive deeply into performance details and uncover what Spark Execution Plan doesn't typically show.
This project demonstrates how to monitor and profile Spark applications in Databricks using Prometheus, Grafana and Pyroscope. This is applicable to any Spark application running on Databricks, including batch, streaming, and interactive workloads (including ephemeral Jobs).
Besides Prometheus, Pyroscope and Grafana, this project will create a small single-node Spark Cluster and a set of init scripts to configure it to push metrics to Prometheus Pushgateway and Pyroscope.
       ┌─────────┐
       │ Grafana │
       └────▲────┘
            │                           ┌────────────────┐
            │                           │   Databricks   │
   ┌────────┴────────┐                  │  Spark Cluster │
   │   Prometheus    │                  │                │
   └────────▲────────┘                  │                │
            │                           │ ┌────────────┐ │
            │                       ┌───┼─┤ Driver     ├─┼───┐
            │                       │   │ └────────────┘ │   │
            │                       │   │                │   │
┌───────────┴────────────┐  Metrics ▼   │ ┌────────────┐ │   ▼   APM Traces   ┌───────────┐
│ Prometheus Pushgateway │◄─────────────┼─┤ Executor   ├─┼───────────────────►│ Pyroscope │
└────────────────────────┘          ▲   │ └────────────┘ │   ▲                └───────────┘
                                    │   │                │   │
                                    │   │ ┌────────────┐ │   │
                                    └───┼─┤ Executor   ├─┼───┘
                                        │ └────────────┘ │
                                        │                │
                                        └────────────────┘
This demo uses Terraform to create all necessary resources in your Databricks Workspace. You will need Terraform version 1.40 or later installed on your machine.
You'll also need a VM with the network connectivity to the Databricks Workspace. This VM should preferably be created in the same virtual network as the Databricks Workspace, or the peered network.
You will need a Databricks account to run the demo if you don't have one already. You can sign up for a free account at https://databricks.com/try-databricks.
In order to send metrics and traces to Prometheus and Pyroscope, they need to be set up and running. For the convenience of the demo, the complete setup is done using Docker Compose, which you can find in docker directory. The included Terraform configuration won't create these resources for you, so you will need to set them up.
It can be started with the following command:
docker compose upYou will need a Databricks Personal Access Token to run the demo. Once you have the token, you can create a profile in the Databricks CLI or configure the provider explicitly (using PAT or any other form of authentication).
Terraform setup has only two variables that need to be set, we can provide them through Environment (or through a file), making sure to replace the values with the actual ones:
export TF_VAR_prometheus_pushgateway_host={pushgateway_host}:9091
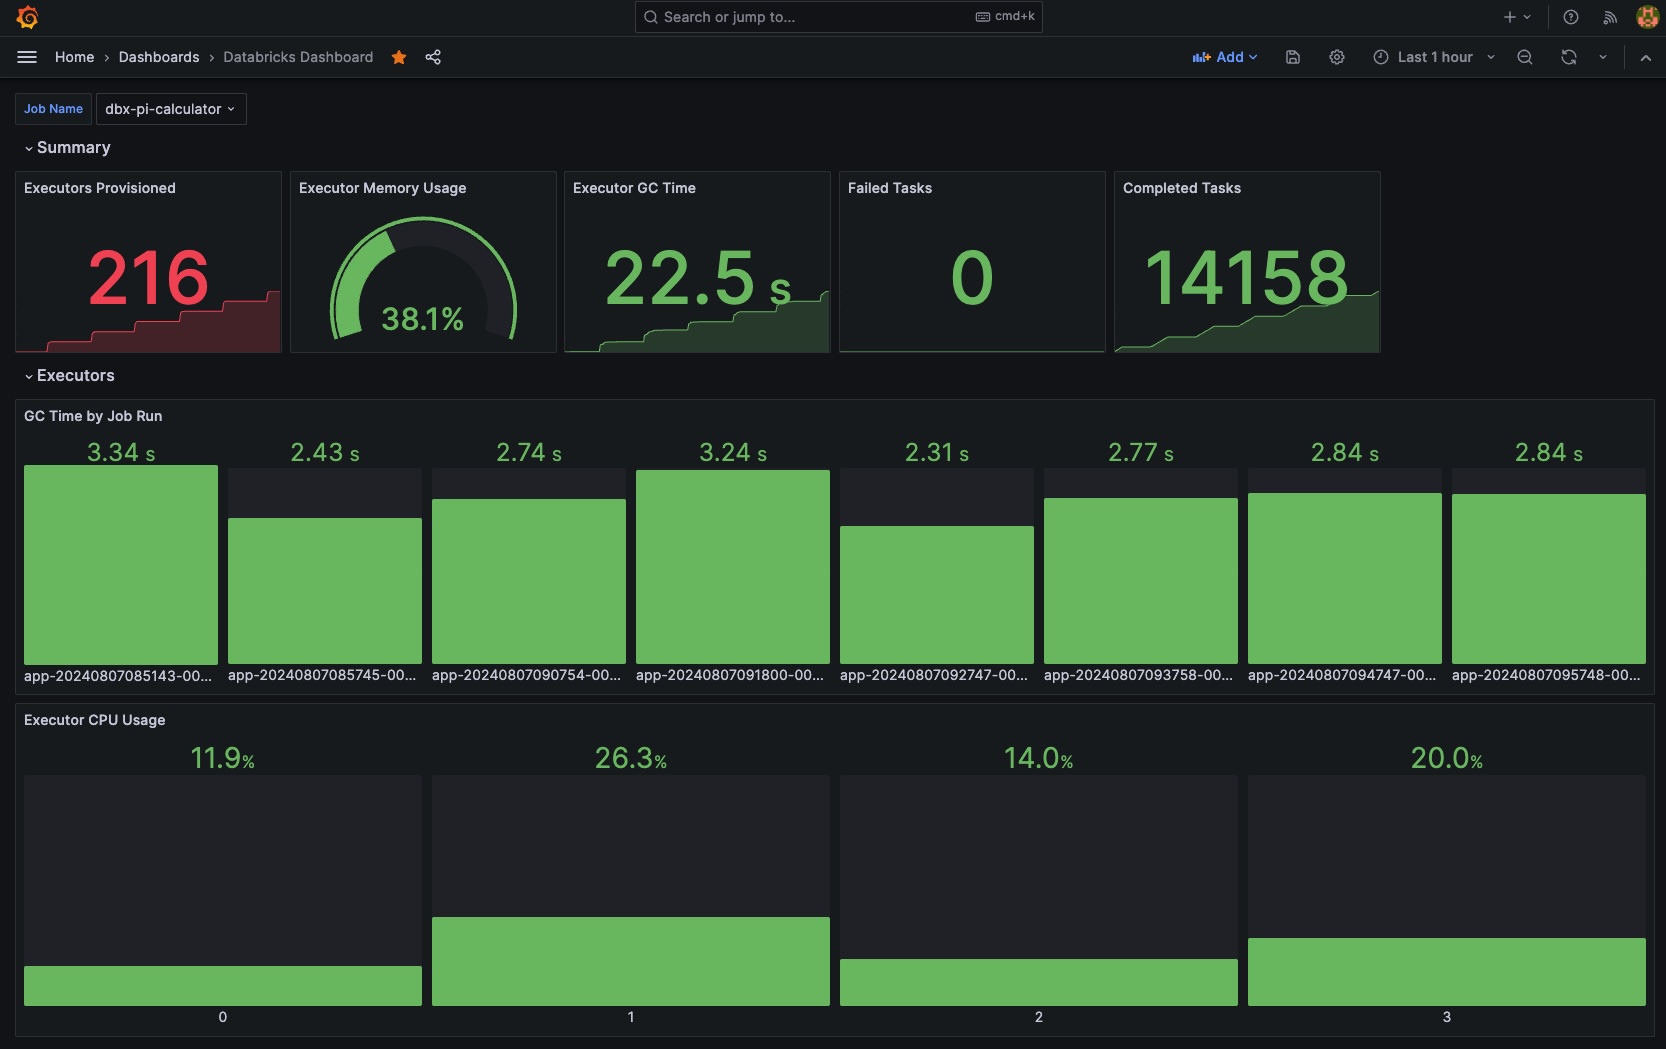
export TF_VAR_pyroscope_host={prometheus_host}:4040If configured, you'll be able to see all relevant metrics in Grafana. If you're using tagging, you are also able to filter by cluster, job, and other tags.
The example below shows how to configure the basic dashboard to show job metrics over time.
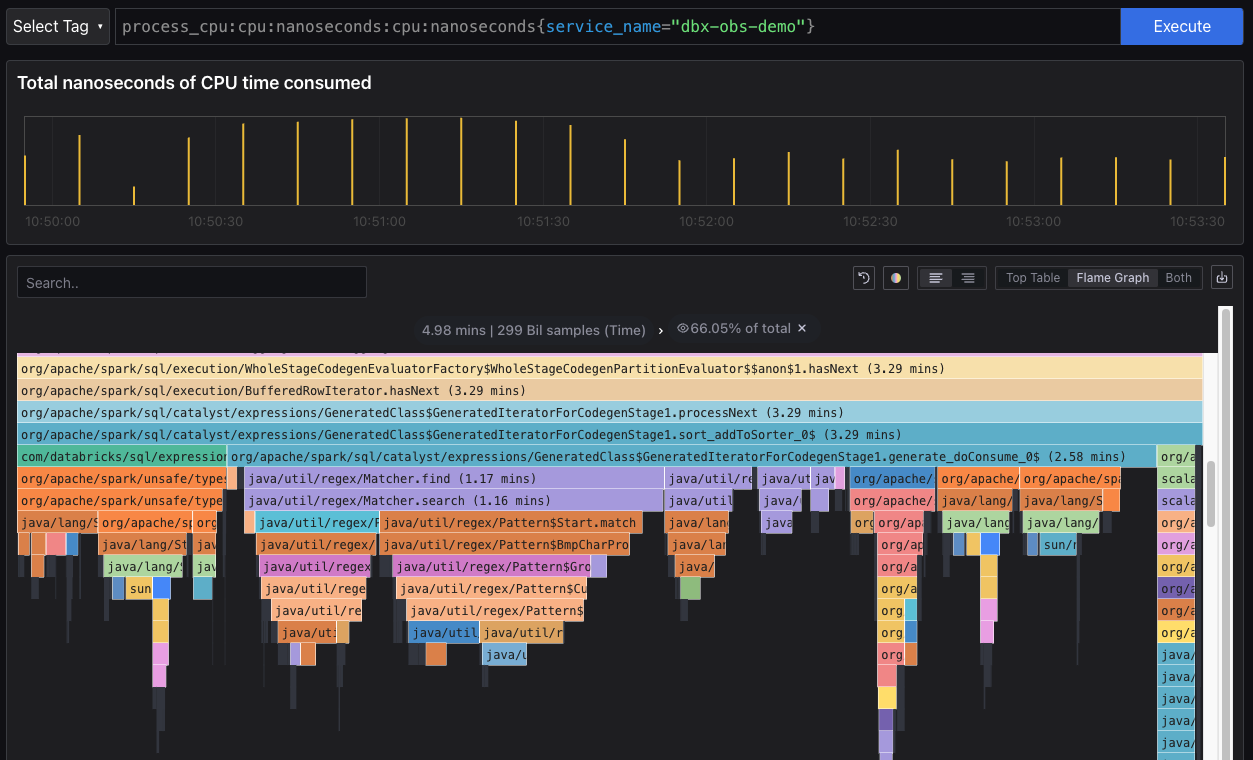
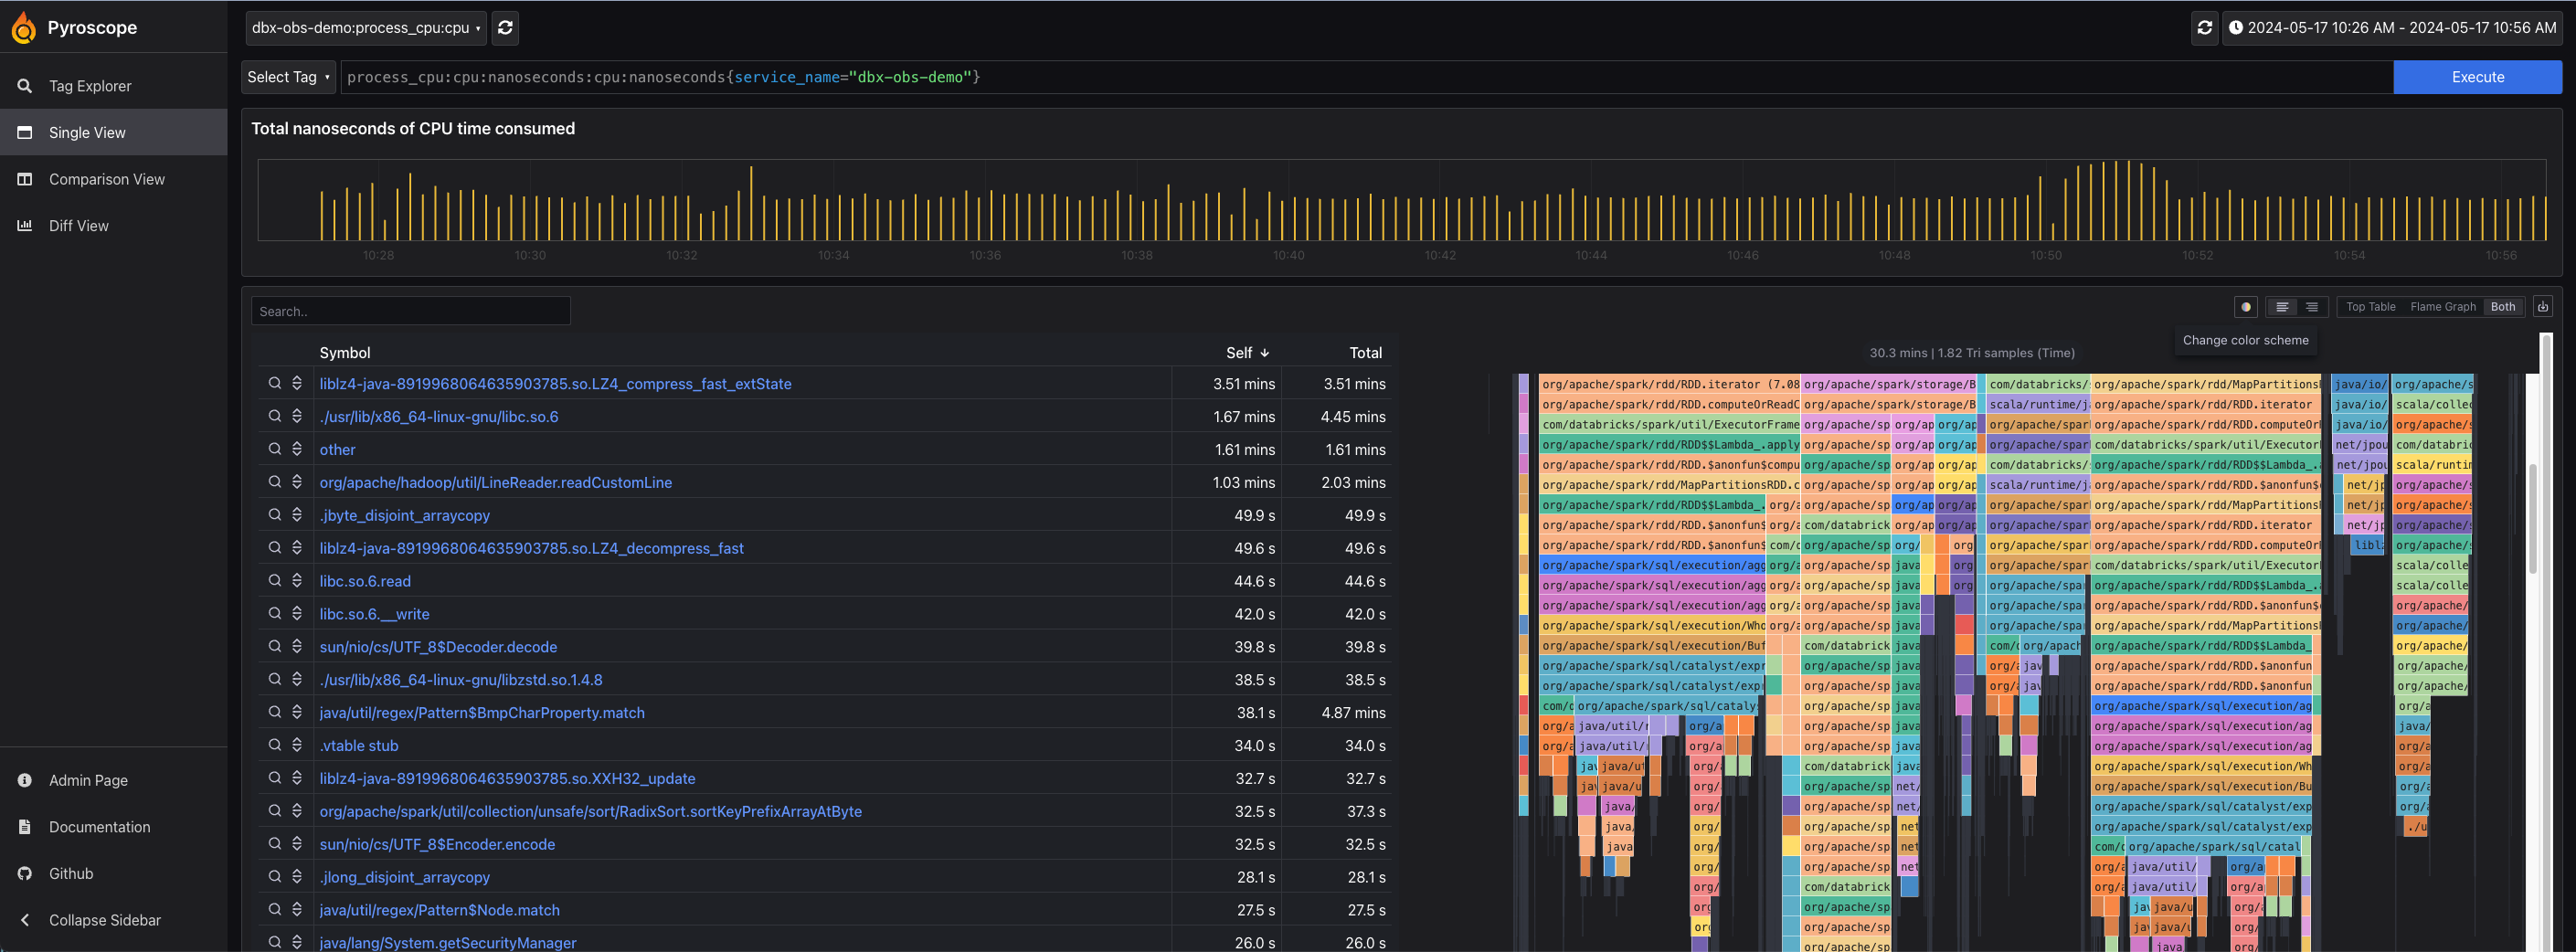
If set correctly, here's what you should get at the end. The following example demonstrates profiling a Spark application that is bottlenecked by reading lzw compressed files, as well as using regex to process the data.
Distributed under the MIT License. See LICENSE.txt for more information.
Project Link: https://github.com/rayalex/spark-databricks-observability-demo
Special thanks to these, as without them this would not be possible:


