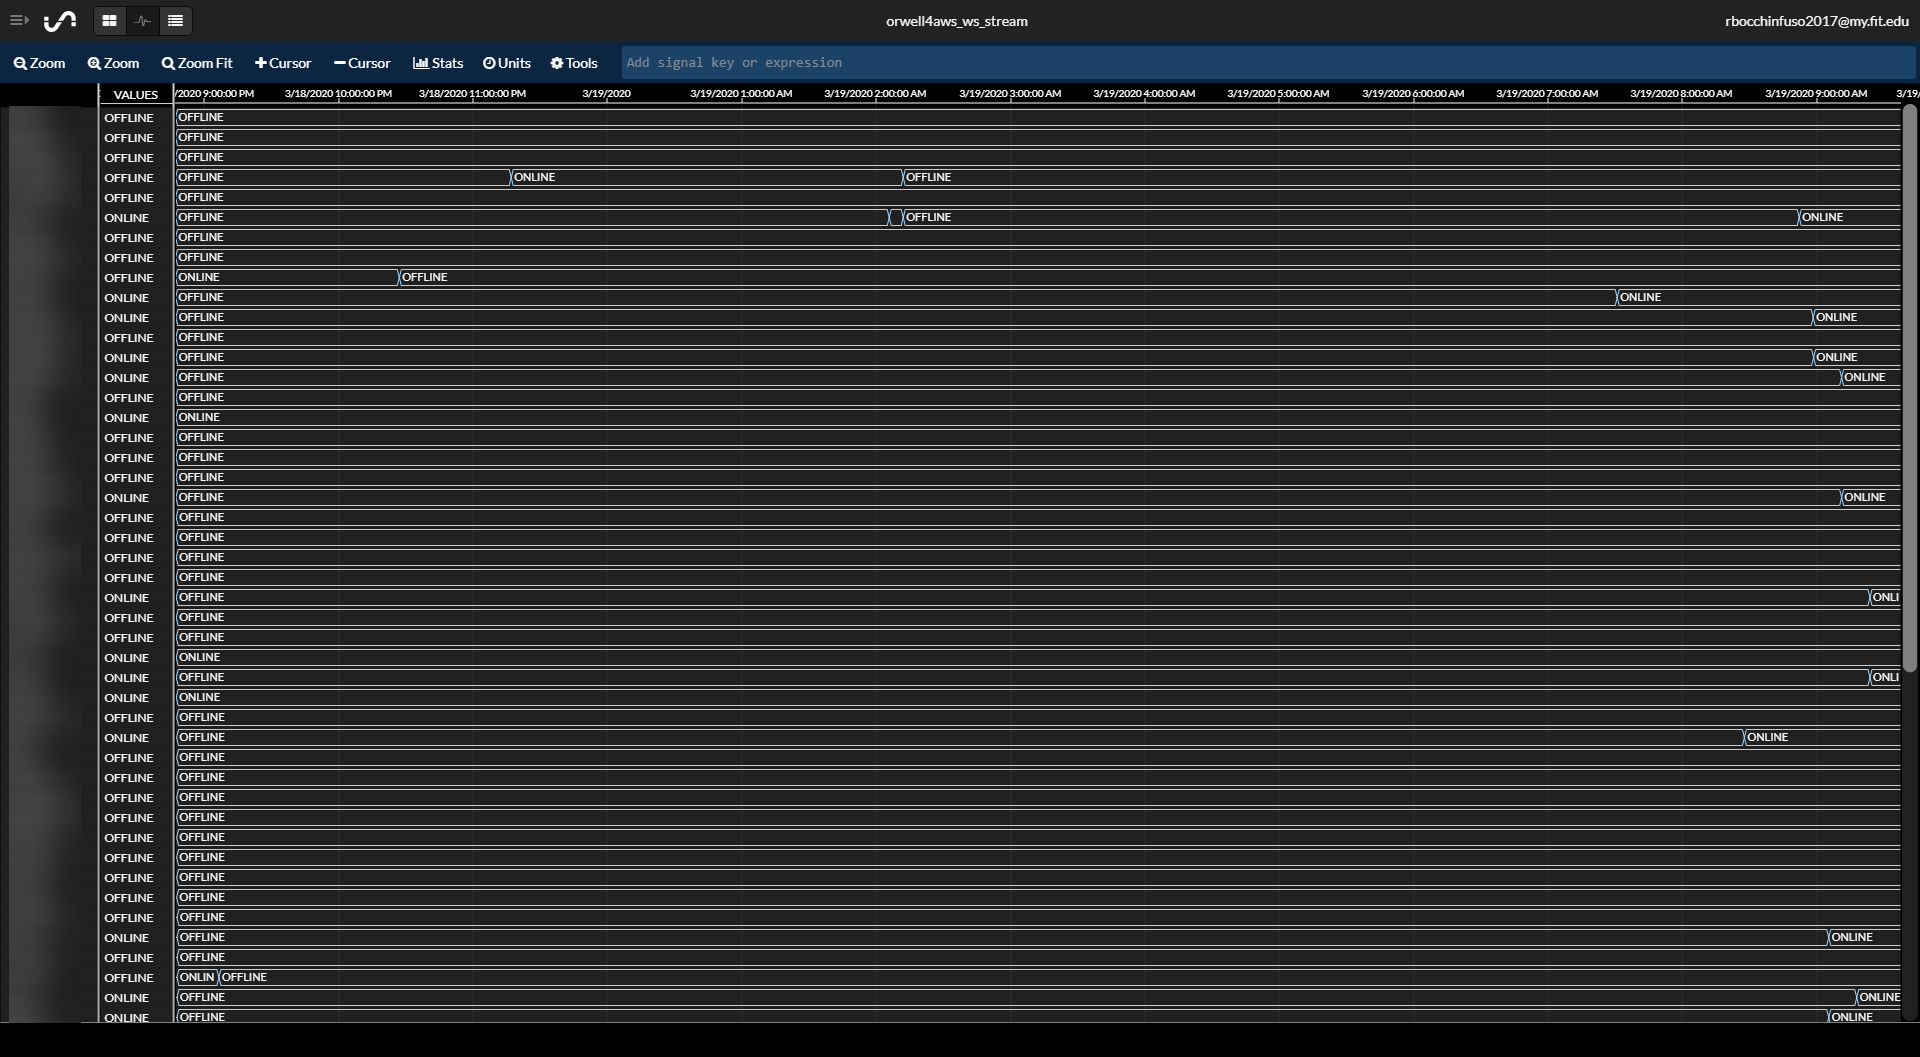
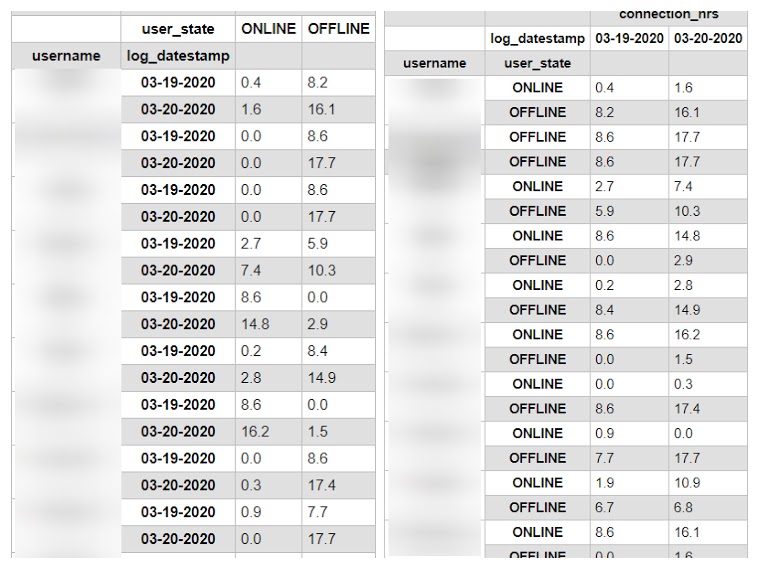
Big Brother tooling to gather user utilization/access data from AWS Workspaces via API, aggregate with pandas and numpy and publish pivot reports showing user online and offline time in a variety of views.
Note: The way I like things, plenty of other options and ways to do the same thing.
- Miniconda Python distro (https://docs.conda.io/en/latest/miniconda.html)
- Nginx for publishing reports -- This is not an Nginx tutorial, but I suggest using fancy indexing which will likely require installing "nginx-extras".
- If you want to stream live data you will streaming you will need an Initalstate account (https://www.initialstate.com/) Note: Again lots of option here, I am only providing the option I utilzed.
- Download code from GitHub
git clone https://github.com/rbocchinfuso/orwell4awsws.git
Note: If you don't have Git installed you can also just grab the zip: https://github.com/rbocchinfuso/orwell4awsws/archive/master.zip
- Make sure the orwell4awsws dir and files have proper ownership and permissions
- Install miniconda
- Create env
conda create env - Activate env
conda activate env - Install requirements
pip install -r requirements.txt - Copy config.ini.example to config.ini
- Modify settings in config.ini Note: Initialstate information only required if you want to use the ISStreamer to stream realtime connection data for connection visualization.
- Configure the AWS CLI -- Not an AWS tutorial but you will need an IAM role with the appropriate access and
nohup python orwell4awsws.py >/dev/null 2>&1 &
0 * * * * python [PATH]/orwell4awsws/orwellpivot.py > [PATH]orwell4awsws/orwellpivot.log 2>&1
- Quick hack so general code cleanup is in order.
- Integrate pivottablejs and qgrid for interactive data analysis.
- Figure out how the heck to return more than 25 results from the Workspaces API so I can stop using the AWS CLI to grab JSON and start using boto3 and the AWS SDK.
- Add logic for dev | test | prod and running in interactive or daemon mode.
- Add matplotlib graphs.
- Move from csv files to sqllite.
- Cleanup documentation.
- Whatever else comes to mind.
- Fork it!
- Create your feature branch:
git checkout -b my-new-feature - Commit your changes:
git commit -am 'Add some feature' - Push to the branch:
git push origin my-new-feature - Submit a pull request ツ
- version 0.2.0 (initial release) - 2020/03/19
Rich Bocchinfuso <rbocchinfuso@gmail.com>
MIT License
Copyright (c) [2020] [Richard J. Bocchinfuso]
Permission is hereby granted, free of charge, to any person obtaining a copy of this software and associated documentation files (the "Software"), to deal in the Software without restriction, including without limitation the rights to use, copy, modify, merge, publish, distribute, sublicense, and/or sell copies of the Software, and to permit persons to whom the Software is furnished to do so, subject to the following conditions:
The above copyright notice and this permission notice shall be included in all copies or substantial portions of the Software.
THE SOFTWARE IS PROVIDED "AS IS", WITHOUT WARRANTY OF ANY KIND, EXPRESS OR IMPLIED, INCLUDING BUT NOT LIMITED TO THE WARRANTIES OF MERCHANTABILITY, FITNESS FOR A PARTICULAR PURPOSE AND NONINFRINGEMENT. IN NO EVENT SHALL THE AUTHORS OR COPYRIGHT HOLDERS BE LIABLE FOR ANY CLAIM, DAMAGES OR OTHER LIABILITY, WHETHER IN AN ACTION OF CONTRACT, TORT OR OTHERWISE, ARISING FROM, OUT OF OR IN CONNECTION WITH THE SOFTWARE OR THE USE OR OTHER DEALINGS IN THE SOFTWARE.


