Purpose:
- closed, proprietary binary and also open source binary, library fuzzing
- speed
Code and approach is EXPERIMENTAL. YMMV
Ptrace fuzzer experiments based on https://h0mbre.github.io/Fuzzing-Like-A-Caveman-4/#
- Modified it to snapshot also Heap (needed for a more real target than dummy one)
- Modified it to snapshot and restore FP (Floating Point) registers along General Purpose registers
- Fixed small bug with percentage showing of Coverage
- debuged, debuged, debuged till it work with real target (Oniguruma library :))
TODO:
- automatic snapshot collection from /proc/maps - DONE
- shared memory for Corpus - DONE(50% speed increase on one core, multicore/distributed fuzzing)
- Mutators - DONE
- Your ideas?
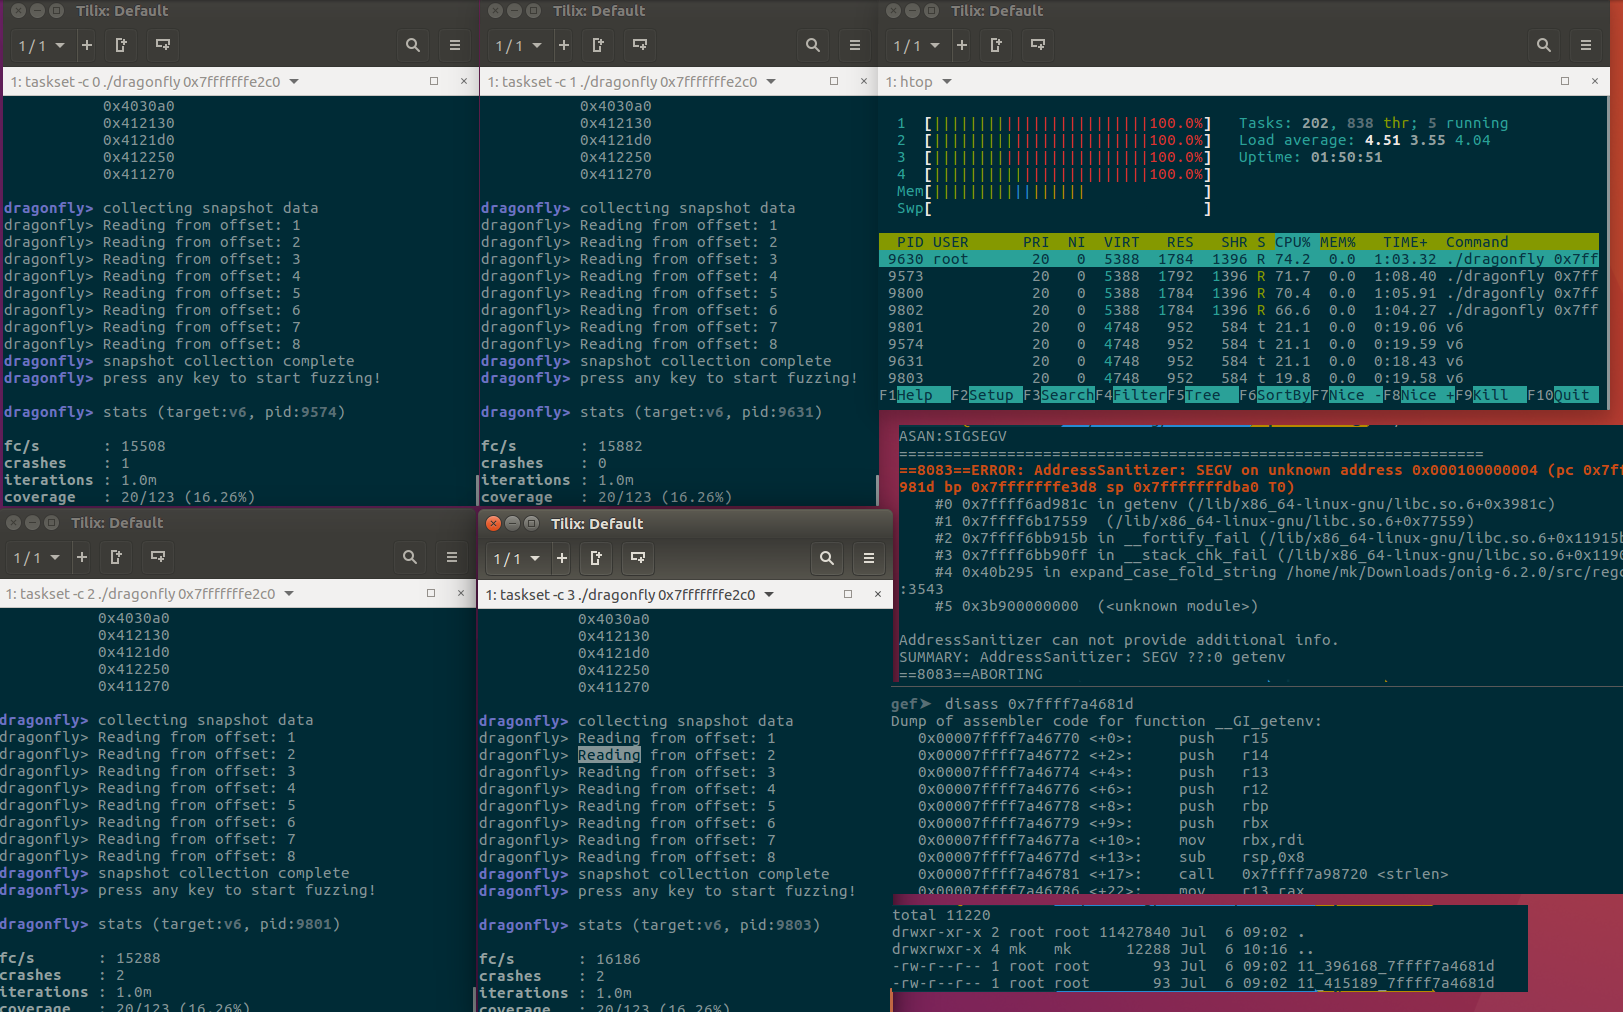
Fuzzing at ca. 60k exec/s. I can imagine you can scale it even more with 25% drop per total cores. With 4 cores I achieved 60k exec/s (25% total drop, since 1 core was ca 20k). Below you can also see how I trigger Stack Protector with my crash. #fuzzing #speed Fuzzing older "Oniguruma" regular expression library
With shared memory corpus and increase of speed on one core to 50%, it could be even 90k exec per second (didn't try yet) on 4 cores.
Dont forget to:
sudo echo 0 | sudo tee /proc/sys/kernel/randomize_va_space
Thats how proc maps looked on my system (see snapshot.c)
cat /proc/30918/maps | grep rw
0065f000-00664000 rw-p 0005f000 00:34 7868250                            /home/mk/fuzzer/v6
00664000-00685000 rw-p 00000000 00:00 0                                  [heap]
7ffff7dd1000-7ffff7dd3000 rw-p 001c4000 fd:01 13908802                   /lib/x86_64-linux-gnu/libc-2.23.so
7ffff7dd3000-7ffff7dd7000 rw-p 00000000 00:00 0
7ffff7fc5000-7ffff7fc8000 rw-p 00000000 00:00 0
7ffff7ffd000-7ffff7ffe000 rw-p 00026000 fd:01 13908788                   /lib/x86_64-linux-gnu/ld-2.23.so
7ffff7ffe000-7ffff7fff000 rw-p 00000000 00:00 0
7ffffffde000-7ffffffff000 rw-p 00000000 00:00 0                          [stack]
Hopefully, rest you can figure out.
Comment those lines out:
// dup both stdout and stderr and send them to /dev/null
       int fd = open("/dev/null", O_WRONLY);
       dup2(fd, 1);
       dup2(fd, 2);
       close(fd);
You will get the Test case buffer address on start, before hitting SPACE:
share memory attatched at 0x7ffff7ff7000 address
fuzz_location:0x7fffffffe2d0

dragonfly> debuggee pid: 12119
dragonfly> setting 'start/end' breakpoints:

   start-> 0x40185b
   end  -> 0x401863

Data ptr:0x7fffffffe2d0
read size: 0, max_size: 12
Adjust your
void* fuzz_location = (void*)0x7fffffffe2d0;
The ADDRESS will be different when running in the SHELL and in DRAGONFLY. Use the second one!
Adjust start and end, disassembling the binary (sample ./v7)
   0x000000000040185b <+137>:	mov    rdi,rax
   0x000000000040185e <+140>:	call   0x4015c3 <LLVMFuzzerTestOneInput>
   0x0000000000401863 <+145>:	mov    edi,0x42817f
here:
long long unsigned start_addr = 0x40185b;
long long unsigned end_addr = 0x401863;
Breakpoints
Use Ghidra or nm to dump them:
nm -g -C ./v3 | grep " T " | cut -f 1 -d " " > listX.txt
Then generate using this Python Script:
import sys
f = open("listX.txt", "r")
i=0
for x in f:
  x = x[:-1]
  sys.stdout.write("vuln.bp_addresses["+str(i)+"]=0x"+x+";\n")
  sys.stdout.flush()
  i=i+1
and put in fuzzer.c
Fuzz.
