This repository contains a prototype web application that leverages the fuel economy public environmental dataset that allows consumers to view and compare fuel efficiency and greenhouse-gas information for automobiles back to 2005.
The public dataset used is http://www.fueleconomy.gov/feg/epadata/vehicles.csv.zip, which contains all of the fuel efficiency and greenhouse-gas emissions data for vehicles from the present day back to 1984. For the purposes of the prototype, the data was limited to a 10-year span, back to 2005.
The consumer is able to access this prototype application at http://afseparfi.github.io/afseparfi/. The site is a responsive, single-page application that, once loaded into a browser, can be used whether a network connection exists or not. It allows the consumer to review fuel efficiency and greenhouse-gas information for any model car, and to compare up to three vehicles against one another.
The current EPA site, www.fueleconomy.gov, already features a similar capability, but the development team has reimagined the feature with a focus on supporting mobile platforms such as smartphones and tablets, since the likely use of the site would be while shopping for a new or used vehicle at a dealer location, rather than at home from a desktop computer.
The team identified open-source, reusable frameworks as the basic underpinning of the site to allow the creation of both application and infrastructure as quickly as possible while ensuring a good-quality product and environment. The fuel economy app is based on the following technologies:

Travis-CI |
Travis-CI.org provides a continuous integration environment which understands how to interact with GitHub without complicated configurations and programming. Projects are imported automatically and continuous integration starts as soon as the Travis-CI configuration file is committed to the baseline. |

|
Yeoman provides the AngularJS web application framework for the prototype site, creating all of the necessary Grunt, Bower and AngularJS files and settings to work from. A simple "yo angular", answer a few questions and the initial (empty) site can be up and running in minutes. |

|
AngularJS provides a MVC framework on which the team built the single-page application. Information on the page is updated immediately based upon controls and inputs from the user without requiring calls back to the server to load new pages. The underlying JavaScript code has order and intention rather than being mashed into one large JavaScript file. |
|
|
Grunt provides a reusable build tool with a host of contributed compoments to allow multiple JavaScript-based technologies to be built and tested quickly without creating a series of homegrown scripts and configurations. |
Modern web projects are performed by many developers distributed across geographical regions, and this project is no exception. To enable distributed-yet-controlled development, the team chose the following technology:
 GitHub
|
GitHub provides the Git-based public code repository and code-sharing infrastructure that allows the team, distributed across multiple locations, to seamlessly interact and construct the website in a shared manner. |
Any properly run software project uses unit testing to evaluate the code baseline to ensure planned functionality operates as expected. The team has chosen two technologies to use to provide this test coverage on the project.
|
|
Jasmine provides the language in which team is able to author JavaScript unit tests to test the AngularJS controllers and services. Test failures are caught in continuous integration and team members notified of problems long before they reach production. |

|
Karma provides the unit testing execution framework, with the ability to start both user-driven and headless browsers, execute the Jasmine test cases and report the results back to the developers. |
The flow of code from initial authoring through testing, quality review and deployment to staging and production environments should be as automated as possible. The technologies below have been selected to provide automated build, testing and deployment.
|
Travis-CI |
Travis-CI monitors the afseparfi master branch, automatically executing Grunt build, test and deploy tasks each time a developer commits changes. |
|
|
Grunt executes a series of actions against the web site code baseline, checking code quality, performing unit tests/quality checks and create distributions for deployment.
For this project, Grunt runs jshint, test and build targets on Travis-CI. |
|
GitHub
|
GitHub.io provides the hosting environment for the deployed web application. Any code committed to the gh-pages branch of the project is automatically hosted in GitHub.io. When a build is successful and passes all quality and unit tests, the resulting web application is pushed to the gh-pages branch by Travis-CI, resulting in a deployed build. |
As shown in the figure below, to implement the prototype site we followed a five phased approach: Discover, Describe, Design, Develop and Release.

In the Discover phase, we interviewed several consumers in the market for a new car. We captured their needs and wants, key factors in making a purchase decision, trusted tools and resources to educate themselves, as well as their understanding of and interest in fuel economy. We conducted a detailed analysis of the current fueleconomy.gov site, as well as a competitive analysis to understand that landscape. These findings informed our approach to how we prioritize our users and their goals in the next phase.
[](http://www.youtube.com/watch?v=jTeDlUynA4I "User Interviews")
User Interviews
### Describe Phase
During the Describe phase, we created personas to represent these stakeholders. By understanding the user and the available data, we developed user flows that supported researching fuel economy and vehicle comparison. The team sketched new design iterations supporting user flows including browsing and searching, detailed research and comparison. We mapped out specific touchpoints and finalized our service vision and positioning statements.

In the Design phase, we were then able to iterate on wireframes and develop mock ups. The resulting Minimum Viable Prototype (MVP) tests the hypothesis that an interactive experience combining Fuel Economy data and the Fuel Economy label can drive the user toward positive changes. The prototype features data visualizations, detailed views of specific car information and fuel savings comparison which are all visually reinforced with details of the Fuel Economy label.
Tech components were applied and a working prototype was developed during this phase. Testing, reusable components, and a distributed coding model were key factors that enabled the team to create a working prototype rapidly.
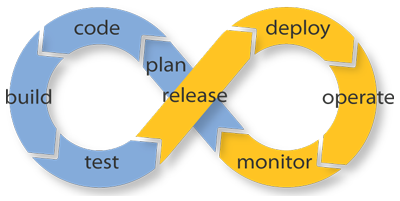
The last phase, Release, focuses on metrics and measurement, refinement to the initial release to ensure the experience is maximized, enhanced, and relevant for the target users. As part of the release strategy, a DevOps framework and tools were used to automated the integration, testing and deployment as possible.
To model standard DevOps behavior, the Travis-CI continous integration site was chosen due to the small amount of effort required to turn it on and its seamless integration with GitHub.
Travis-CI monitors as many branches as are available in GitHub for the user account in question (afseparfi), except for the gh-pages branch. Each time one of the development team members committed a change, Travis-CI kicks off a build.
The build was configured to perform unit tests and JSHint code-quality checks. If any unit tests fail or if the JSHint check identifies JavaScript code that does not conform to the established best-practices (as codified in the .jshintrc file), the build fails and is not pushed to production.
One of the useful features of GitHub is that any files checked into a branch named gh-pages is automatically hosted on the GitHub.io site. When a build passes unit and quality tests, the final step pushes the production code into the gh-pages branch, causing it to be deployed to GitHub.io.


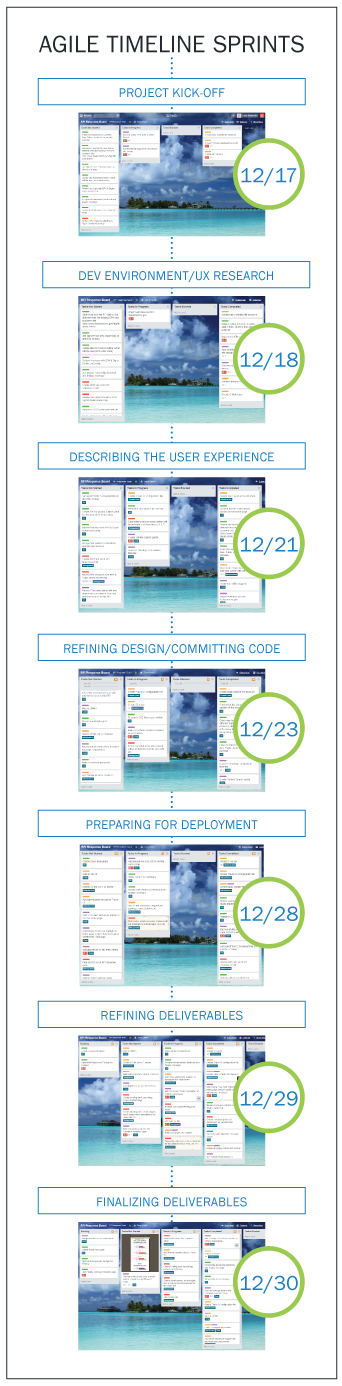
Our lean, cross-functional team worked collaboratively every day to iterate on concepts for the prototype. We used an agile process that incorporated daily stand-ups, sprint-style planning, a Kanban board (Trello), and collaborating in Github. We incorporated feedback from users, teammates, and feedback loops as we developed the prototype. Through this agile approach, we worked efficiently to create a resource that helps users research the environmental impact and value of purchasing a new car.