Test collision resistency non-cryptographic hash functions. This is the experience part of project for 2017 NTU CSIE Probability lecture.
- slide: XOR8 hash function
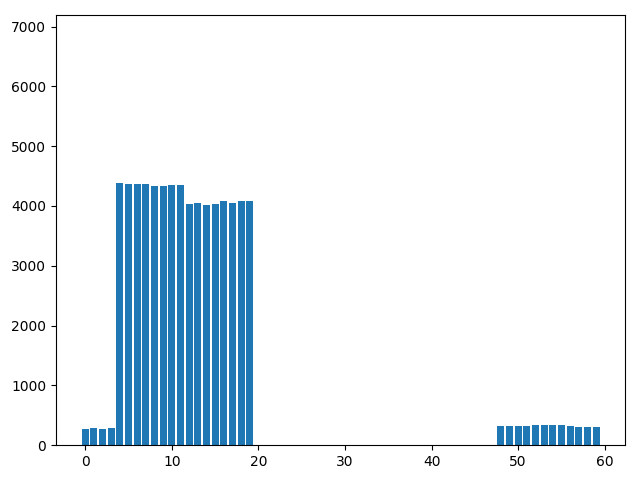
We uses some optimizations to have xor8 hash behaves as good as djb2, even in less time.
$ ./hashfunc.py --hash xor8 data/studentID | ./barchart.py -g
$ ./hashfunc.py --hash djb2 data/studentID | ./barchart.py -g

# Optimization 1
$ ./hashfunc.py --hash xor8 --size 64 data/studentID | ./barchart.py -g

# Optimization 2
$ ./hashfunc.py --hash xor8 --size 64 --regroup data/studentID | ./tilechart.py -g

# Optimization 3
$ ./hashfunc.py --hash xor8 --size 64 --regroup --hist-eq=0,6 data/studentID | ./tilechart.py -g
Notice that the data is slightly transformed due to privacy, thus the result would be different from the slide above. But there’s same effect on each optimization.
This program can also be used to analyze other hash functions. hashfunc.py will read lines in file given as first argument, printing out a hashtable. barchart.py and tilechart.py will read the hashtable and show the responding chart.
- Options in
hashfunc.py-h,--hash: specify the hash function, sum8, xor8, djb2 is implemented-s,--size: specify the bucket number in the hashtable-r,--regroup: specify whether to use shift folding, suitable only fordata/studentIDnow-e,--hist-eq: specify the subscription for each line to perform histogram equilization
- Options in
barchart.py,tilechart.py-g: specify using pyplot to show the chart, instead of terminal
- Python3 with numpy, matplotpy installed
- HASHING
- Which hashing algorithm is best for uniqueness and speed? | StackExchange
- Gaussian Distribution + Hash Tables | StackOverflow
- Why are 5381 and 33 so important in the djb2 algorithm? | StackOverflow