Lightweight C plotting library without special dependencies for Linux and Win. Developed with C89 standart. Successfull build on gcc-4.8 and Visual C compiller 2010
#include <stdio.h>
#include <stdlib.h>
#include <math.h>
#include "svg.h"
int main(int argc, char** argv)
{
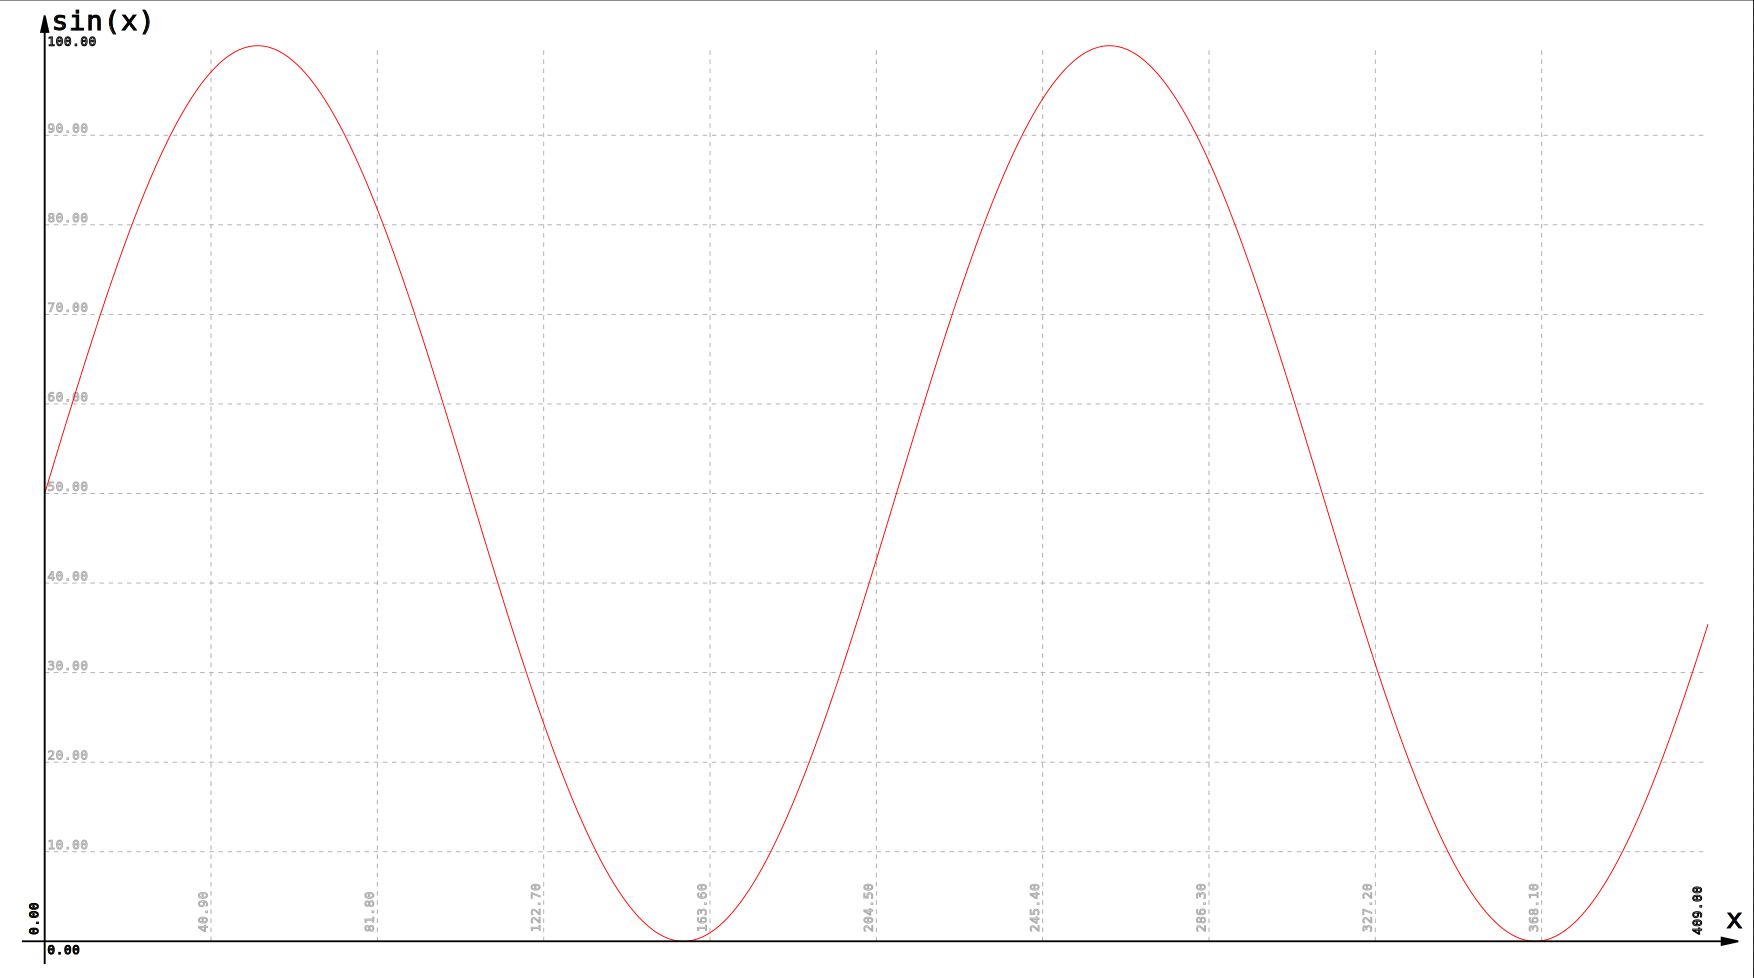
int size = 410, i;
double *data = (double*) malloc(sizeof (double)*size);/*Allocate test y array*/
double *x = (double*) malloc(sizeof (double)*size); /*Allocate test x array*/
FILE *f;
for (i = 0; i < size; ++i) /*Fill x and y values*/
{
data[i] = 50 + 50 * sin(i * 0.03);
x[i] = i;
}
f = fopen("sin.svg", "w"); /*Open result file*/
/* Plot graphic with red (#ff0000) lines as svg image only */
svg_draw_to_file_xy(f, "#ff0000", data, x, size, "x", "sin(x)", 2, false);
fclose(f); /*Close result file*/
free(data); /* Free y array */
free(x); /* Free x array */
return (EXIT_SUCCESS);
}Compile the example:
$ gcc main.c svg.c -lm
$ ./a.out
Output of sin.svg:
Full version
void svg_draw_to_file_xy(
            FILE *f,
            const char *color,
            double *y,
            double *x,
            size_t count,
            const char *xlabel,
            const char *ylabel,
            int decimal,
            bool html)
Short version with auto generated X (from 0 to count-1)
void svg_draw_to_file_y(
            FILE *f,
            const char *color,
            double *y,
            size_t count,
            const char *xlabel,
            const char *ylabel,
            int decimal,
bool html)- f - reference to opened file for writing result
- color - line color
- y - array with values
- x - sorted array with x values from minimum to maximum
- count - elements count (not bytes)
- decimal - number after dot in float
- html - generate or not html page with inline svg. Usefull for Windows users, which do not have other good SVG viewer then browsers