Playbook and dashboards to help with ODF performance analysis.
This project uses Ansible to deploy a Grafana environment to support performance analysis of ODF. There are two deployment modes supported;
- OpenShift: This mode will use the community grafana operator to deploy Grafana directly into a specific namespace in OpenShift.
- Local: In local mode, the deployment expects a prometheus archive file (tar.gz) and will deploy a local Prometheus and Grafana instance to allow offline analysis of the Prometheus data.
Before you start you'll need to ensure you have the following packages installed.
| Package | Notes |
|---|---|
| ansible | |
| pwgen | |
| oc* | required for OpenShift deployment mode ONLY |
| docker or podman | required for local deployment ONLY |
| docker-compose | required for local deployment ONLY when container_engine=docker is set |
* the oc binary can be downloaded from here
| Filename | Purpose |
|---|---|
| deploy-grafana.yml | creates a new namespace and deploys Grafana with default dashboards |
| add-dashboard.yml | Load a dashboard to an existing Grafana deployment |
| purge-grafana.yml | deletes your grafana namespace (sledgehammer!) |
By default, the playbook uses podman (podman) to create a local Prometheus and Grafana environment. If you intend to deploy using docker, you'll need to ensure you have docker and docker-compose installed and change the container_engine setting in your group_vars/all.yml file.
| Filename | Purpose |
|---|---|
| deploy-local.yml | Creates a local Grafana and Prometheus deployment using a provided tarball of prometheus metrics (use -e prom_tarball=<PATH TO TARBALL>) |
| purge-local.yml | Destroys a local deployment and deletes extracted prometheus files |
As mentioned above, local mode requires a Prometheus archive file as input. If you're unfamiliar with creating an extract of a Prometheus TSDB, take a look at the following Red Hat article. Here's a quick overview of the commands you would typically use;
mkdir prometheus-data
oc cp openshift-monitoring/prometheus-k8s-0:/prometheus prometheus-data/
tar -C prometheus-data -cvzf prometheus.tar.gz --exclude ./wal --exclude ./chunks_head --exclude lock --exclude queries* ./
The key thing to confirm prior to creating your archive is that each of the prometheus block directories, contains a meta.json file. If for some
reason this is missing, that particular block will not be opened by Prometheus.
The group_vars/all.yml file defines a number of parameters that can be used to adapt a deployment, so it's worthwhile taking a look to see if there is anything that you need to change prior to attempting to deploy.
Normally, the defaults are fine for most purposes. However, if you need to deploy to a resource constrained OpenShift cluster, you'll find a section in all.yml called "Resource Limits" which contains some defaults for cpu and memory that have
been confirmed to work in smaller OCP environments.
Run the deploy-grafana.yml playbook
# ansible-playbook deploy-grafana.yml
OR
# ansible-playbook deploy-local.yml -e prom_tarball=/home/user/prometheus.tar.gz
In less than a minute you'll have a functional Grafana instance 😄
At the end of the run, the playbook presents a summary of the settings and access
information, which varies depending on the deployment mode.
Deployment Summary
------------------

Grafana Details
  Namespace : mygrafana
  User      : grafana
  Password  : mysupersecretpassword
  Login URL : https://grafana-route-mygrafana.apps.cuznerp-odf-test.aws.mycompany.org

Prometheus Datasource Connectivity
  Monitoring namespace : openshift-monitoring
  Prometheus URL       : https://thanos-querier.openshift-monitoring.svc.cluster.local:9091
  Service Account Used : grafana-serviceaccount
  Token used           : <service account token>
Deployment Summary
------------------

Grafana Details
  User      : grafana
  Password  : mysupersecretpassword
  Login URL : http://localhost:3001
         or : http://mylaptop:3001


Prometheus TSDB Information
    BLOCK ULID                  MIN TIME                       MAX TIME                       DURATION      NUM SAMPLES  NUM CHUNKS   NUM SERIES   SIZE
    01GW5KBEFDGQZ7W5X57ST1VCA7  2023-03-20 03:50:58 +0000 UTC  2023-03-20 06:00:00 +0000 UTC  2h9m1.493s    18625809     232612       165809       42MiB483KiB611B
    01GW5T75PWSAJ46SHDVH6J7HNZ  2023-03-20 20:13:39 +0000 UTC  2023-03-21 00:00:00 +0000 UTC  3h46m20.92s   45577336     343073       137330       64MiB544KiB189B
    01GW5KB8QJ8S5732YCWTRFTS3N  2023-03-21 00:00:00 +0000 UTC  2023-03-21 02:00:00 +0000 UTC  1h59m59.906s  9824136      133050       130911       27MiB211KiB239B
    01GW88TW0SF6H2M0GNHX9ER0X2  2023-03-22 20:24:40 +0000 UTC  2023-03-23 06:00:00 +0000 UTC  9h35m19.156s  111356252    1028818      143770       153MiB7KiB125B
    01GWFV3JJCG51XTFZ8AQFF5S7V  2023-03-23 06:00:00 +0000 UTC  2023-03-24 00:00:00 +0000 UTC  18h0m0s       56380216     491113       177766       90MiB626KiB418B
    01GWG98JDWM75E3KFCAAK513Y0  2023-03-24 00:00:00 +0000 UTC  2023-03-24 04:00:00 +0000 UTC  4h0m0s        31497938     347445       131271       53MiB985KiB420B
    01GWG5CXS2E075TSY9KDCT8R1A  2023-03-26 20:52:30 +0000 UTC  2023-03-26 22:00:00 +0000 UTC  1h7m29.97s    13264016     123332       120558       29MiB14KiB616B
    01GWG98H7QQZ8SPJ1PKB2ZZKXY  2023-03-26 22:00:00 +0000 UTC  2023-03-27 00:00:00 +0000 UTC  1h59m59.678s  24200580     209406       122096       41MiB515KiB791B
NB. For later reference, the deploy-grafana.yml playbook creates an odf-grafana-credentials file in your home directory,
which contains a record of the password used/generated for the grafana login.
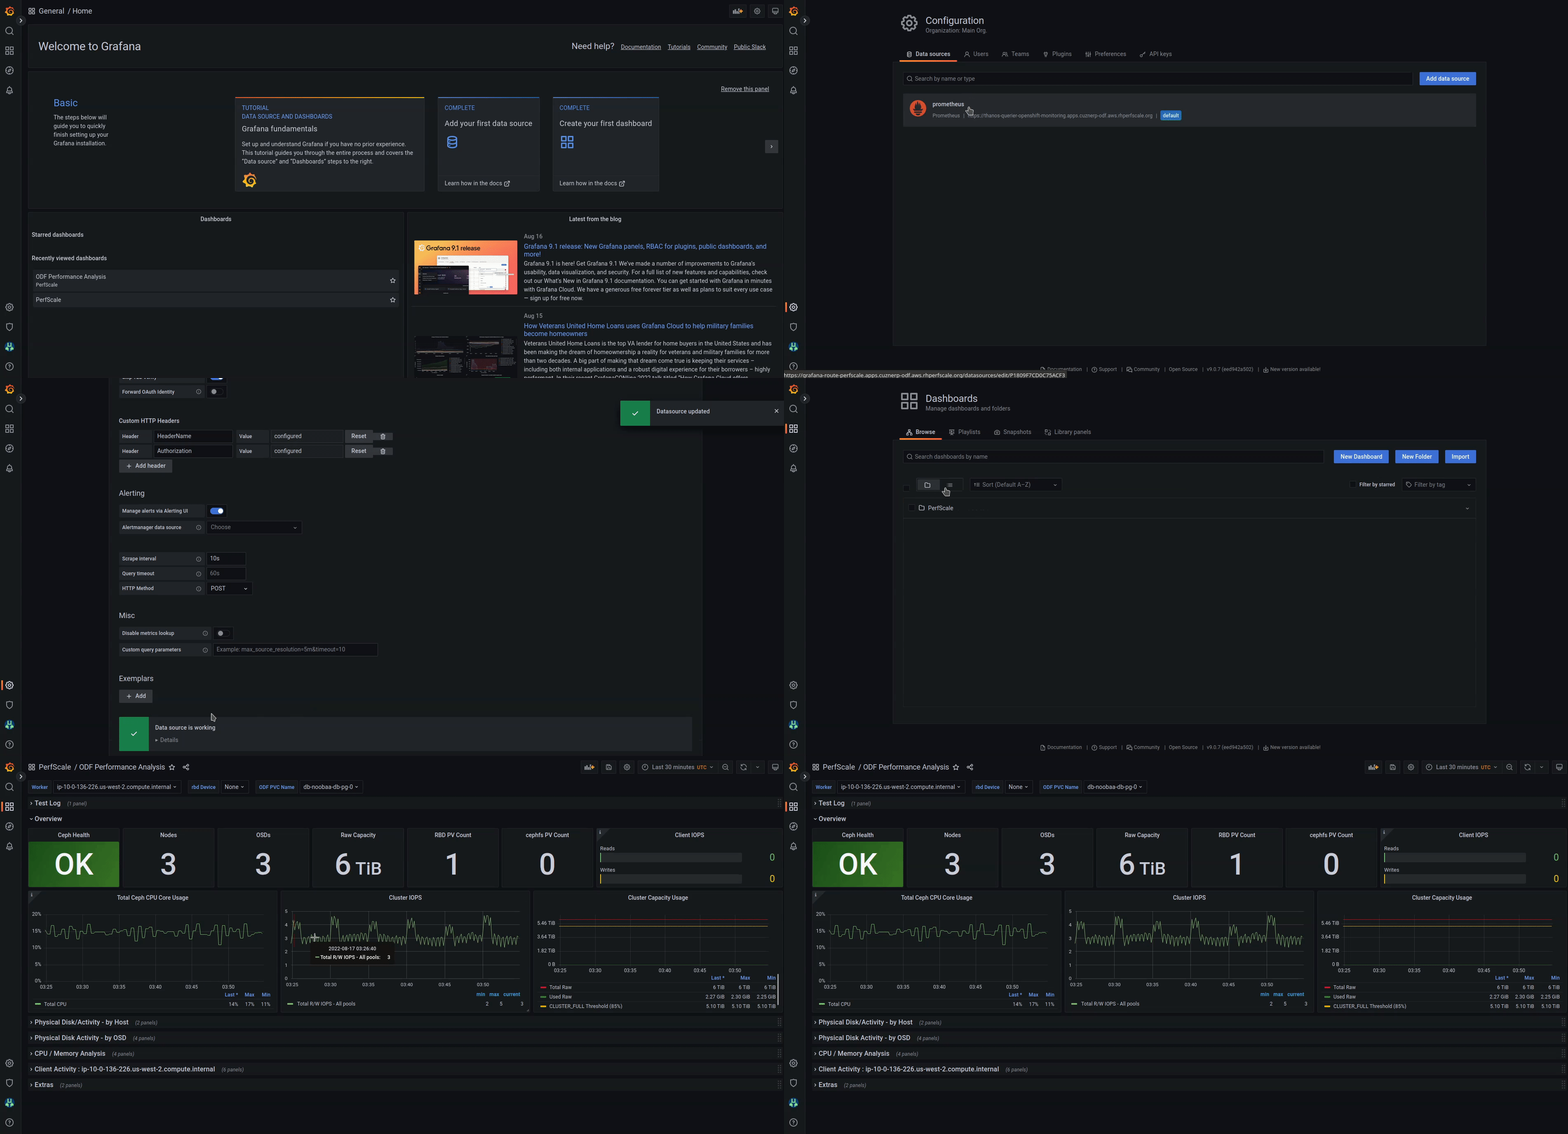
Use the grafana information to login to your instance and get started! The screen capture below shows you the Prometheus data source definition and the default ODF dashboard.
Once your done with your grafana instance, run the appropriate purge playbook to tify things up.
# ansible-playbook purge-grafana.yml -e grafana-namespace=mygrafana
OR
# ansible-playbook purge-local.yml
NB. When you're removing you OpenShift based deployment, remember to use oc project default first to ensure that you're not in the odf-grafana namespace before you attempt to run the playbook.
If you need to add dashboards to your instance after a deployment, you can use the add-dashboard.yml playbook and specify the path to the dashboard file either from the all.yml file or as an extra-vars on the playbook command line.
# ansible-playbook add-dashboard.yml -e dashboard_path=<insert your path here>
Notes.
- For the dashboard to work correctly, each panel must use a datasource of
$datasource. This is a simple way to make your dashboards portable. - To add a dashboard to a local deployment add
-e deploy_local=Trueto the playbook command.
If you need to attach your grafana instance to a secondary cluster's prometheus instance, you can use the add-datasource.yml playbook. To
set this up correctly you will need to set the following variables in `group_vars/all.yml'
prometheus_route: the external route to main thanos-querier instance within the openshift-monitoring namespaceprometheus_datasource_name: the name to use inside your grafana instance for this datasourcetoken: the token from a suitable serviceaccount in the other cluster that permits access to prometheus data
# ansible-playbook add-datasource.yml
The deployment installs several dashboards to help provide OCP and ODF performance insights out-of-the-box.
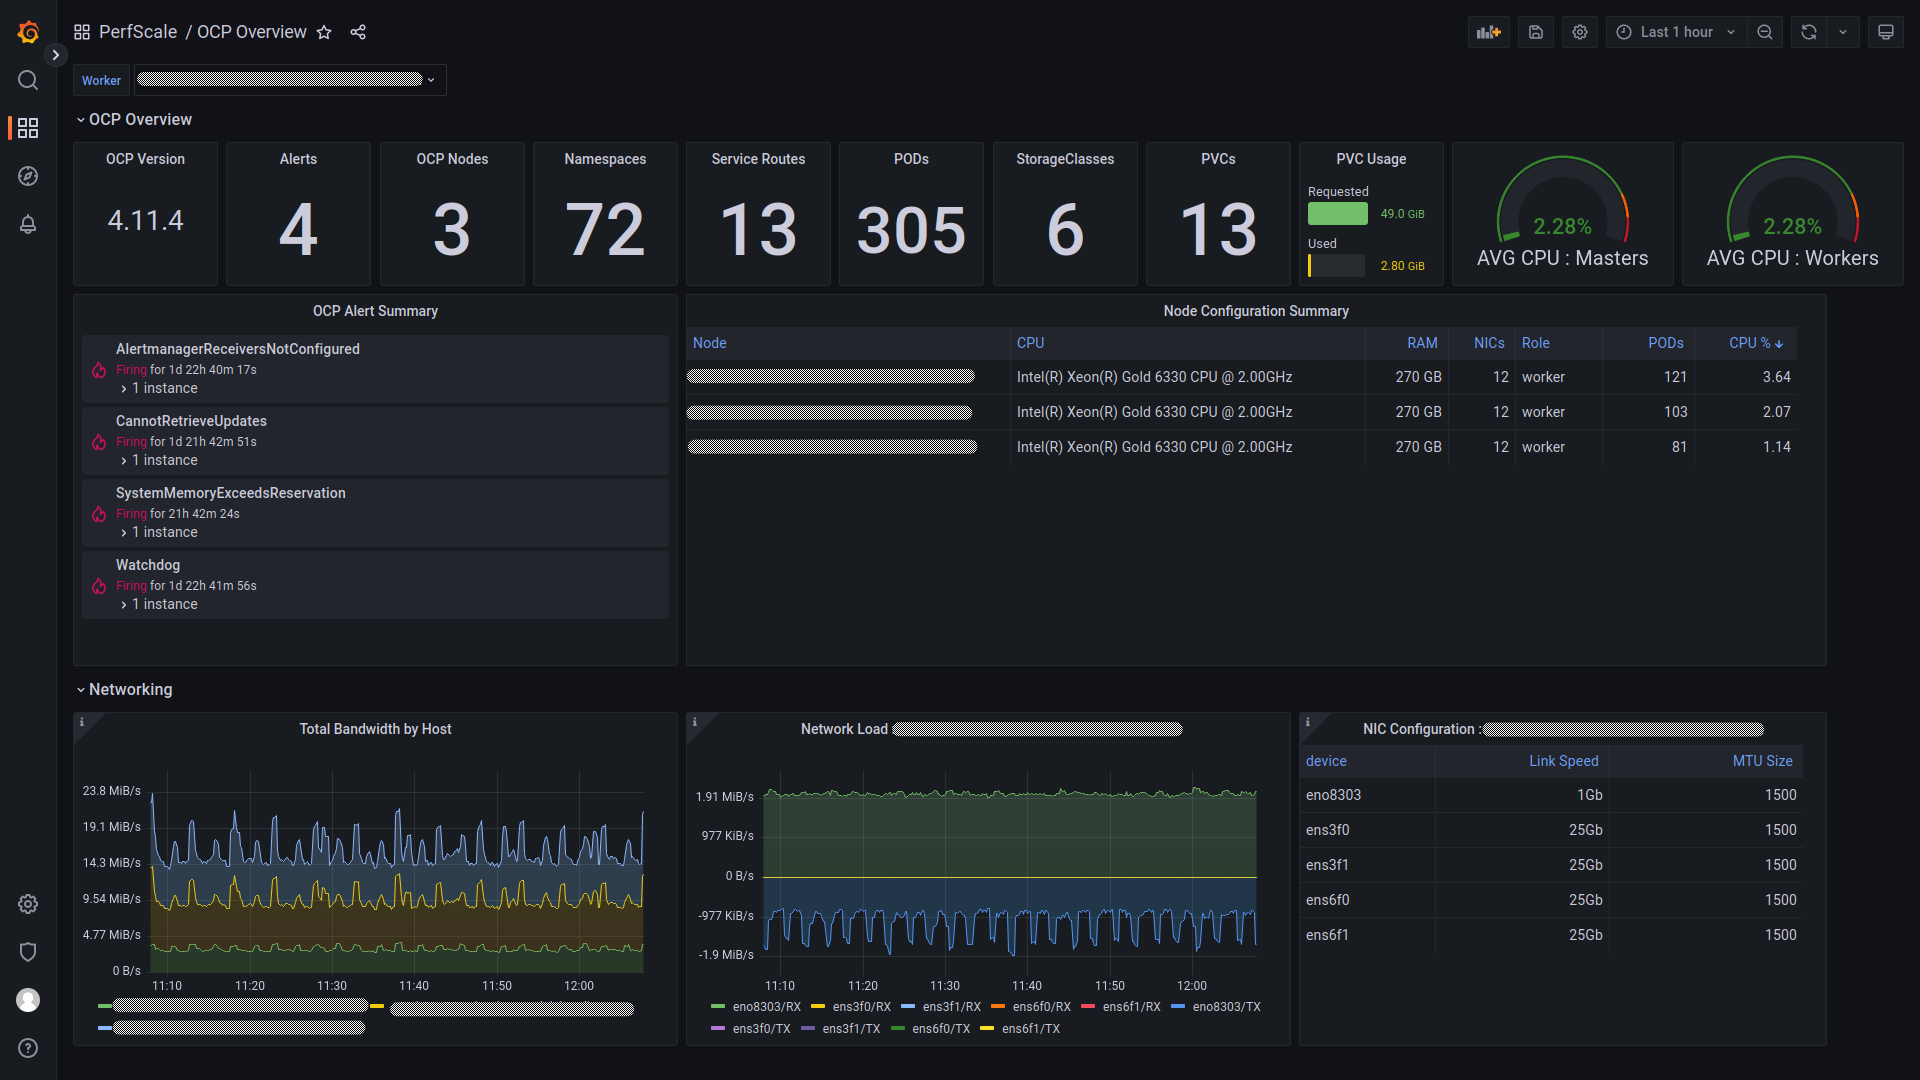
The OCP overview provides a high level overview of the OCP platform.
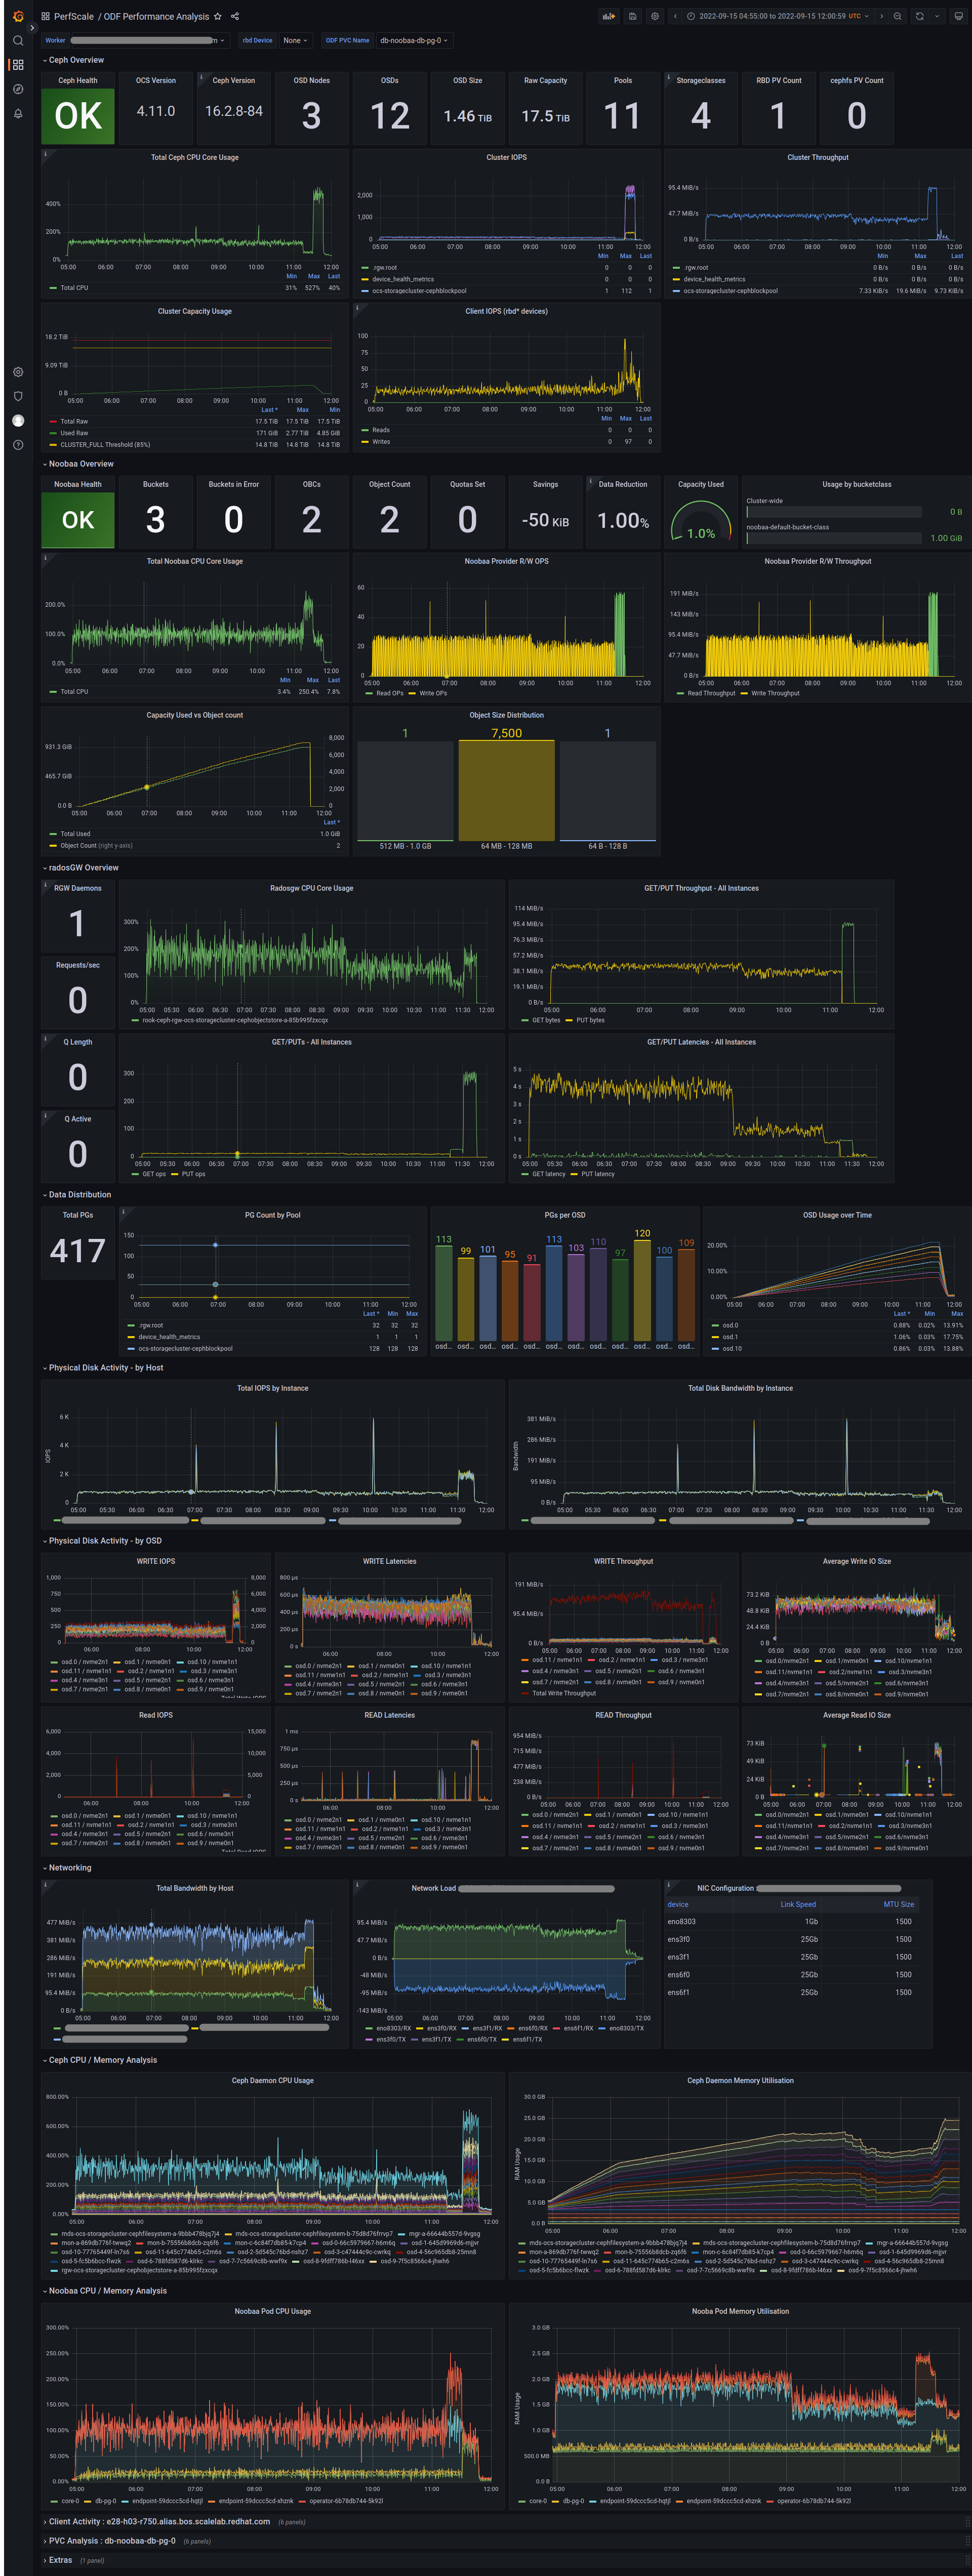
There are many different facets to ODF, so the ODF dashboard is split into multiple rows covering the following types of information;
- Ceph Overview
- Noobaa Overview
- radosgw Overview
- Data distribution
- Physical Disk Activity - by host and by OSD
- Network load (with NIC speed and MTU size)
- CPU and Memory analysis for Ceph and Noobaa daemons
For 'bonus points', if you have the mgr/prometheus rbd_stats_pools defined, you can also see per PVC performance.
It's a lot!
Here's a screenshot with all rows expanded (they're collapsed by default), to give you a sense of the type of data that is visualised.
The playbooks have been tested against the following config
| Host OS | Mode | User | ansible | pwgen | oc | OCP | Cloud | Grafana operator | Grafana |
|---|---|---|---|---|---|---|---|---|---|
| Fedora 36 | OpenShift | root | 5.9 | 2.08 | 4.11 | 4.10, 4.11 | AWS | 4.5.1 | 9.0.7 |
| Fedora 37 | OpenShift | root | 7.0 | 2.08 | 4.11 | 4.11 | AWS | 4.8.0 | 9.3.1 |
| RHEL 8.6 | OpenShift | root | 2.9 | 2.08 (EPEL) | 4.11 | 4.10, 4.11 | AWS, Bare-metal | 4.5.1 | 9.0.7 |
| Fedora 37 | Local | user | 7.3 | 2.08 | - | - | - | - | 9.1.7 |
- The playbook uses the
occommand instead of the ansiblek8smodule, primarily to reduce dependencies.


