This project is part of the Udacity Nanodegree on Machine Learning Engineering with Microsoft Azure. It consists on deploying a model in production, using monitoring tools to evaluate the deploy and building a deployment pipeline based on continuous integration (CI) and continuous delivery (CD) principles.
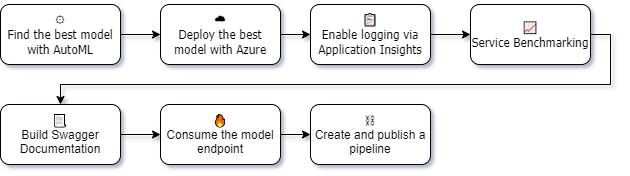
For the experiments, an AutoML model was trained based on the Bank Marketing dataset provided by Udacity. After the deployment of the trained AutoML model, we enable logging via Application Insights. After deployment, we benchmark the model endpoint and build the Swagger documentation for the HTTP API created. Then we consume the endpoint and build a pipeline endpoint for AutoML.
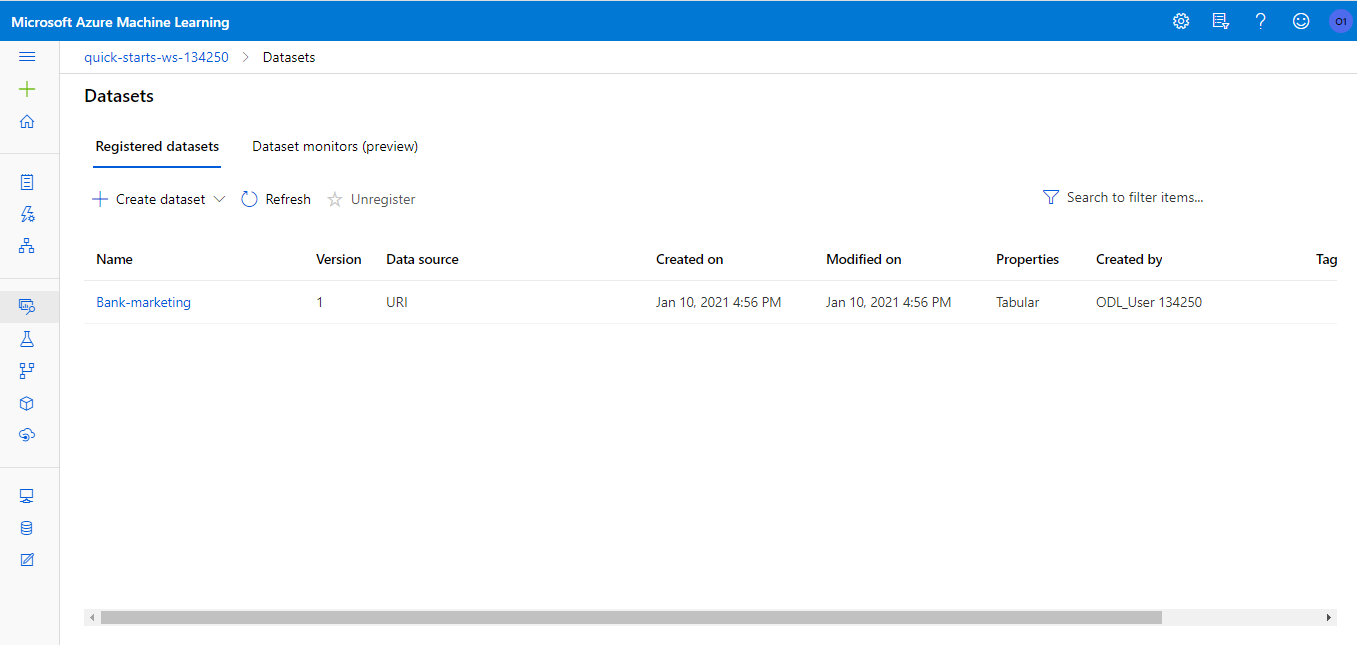
First, we need to register the dataset with Azure, this is a simple step that can be easily done using the Azure Machine Learning Studio.
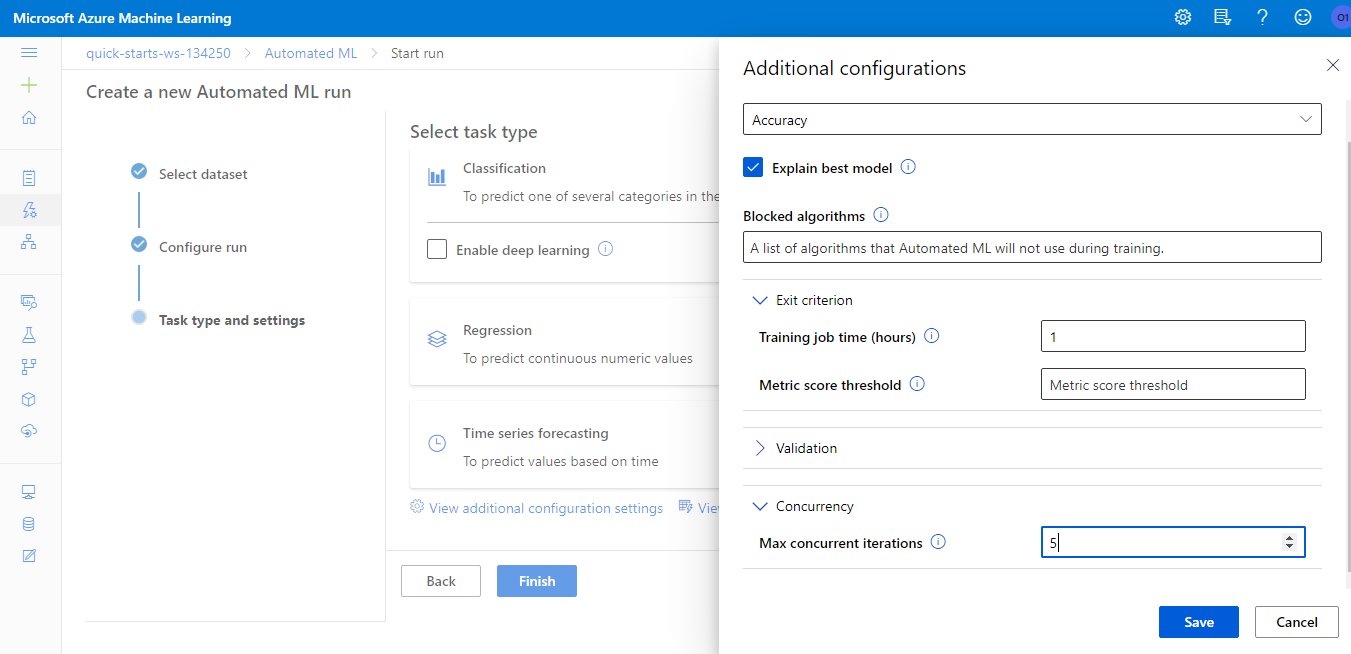
First, we create an AutoML experiment for a classification task on the y attribute with exit criterion of 1 hour and concurrency of 5.
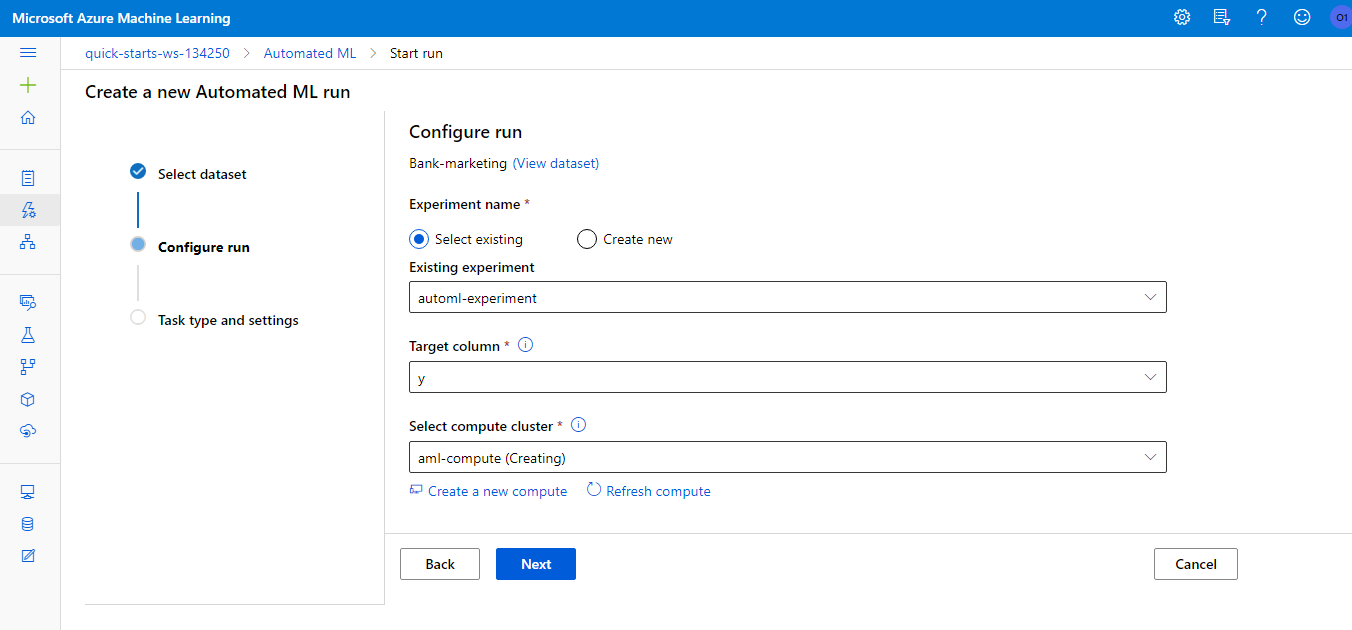
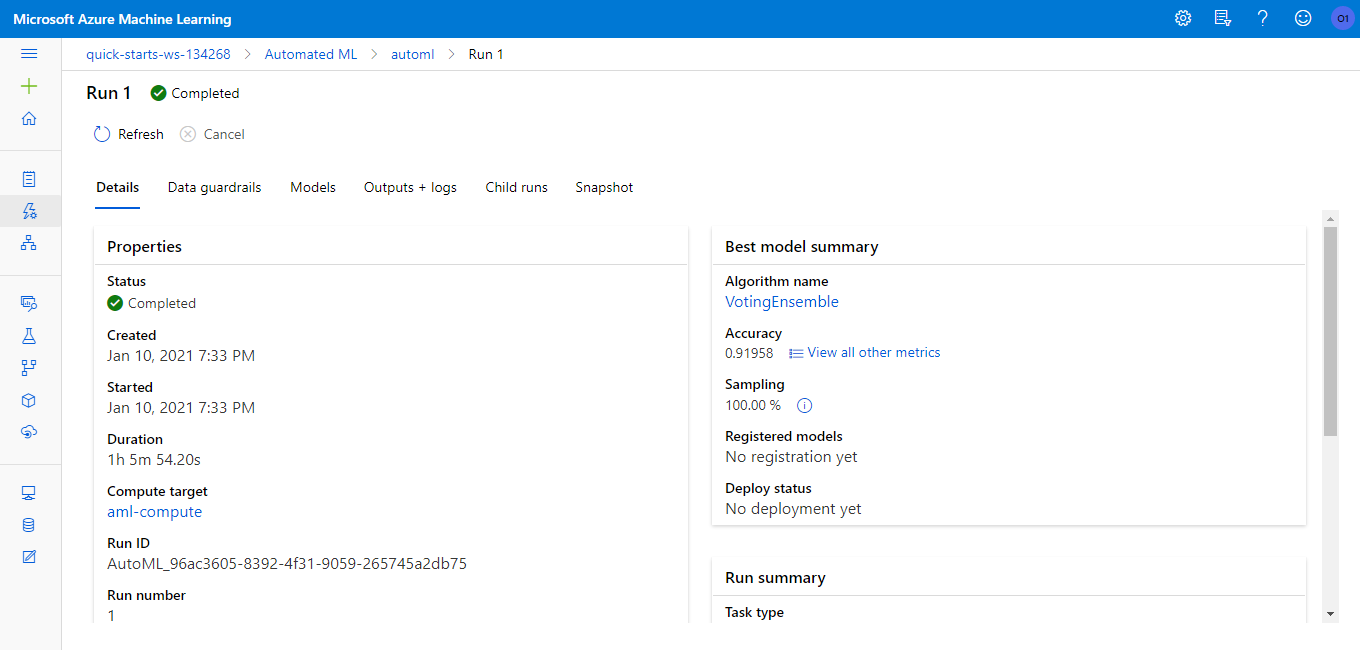
We used a Standard_DS12_V2 Azure compute cluster for the training. The training took about half an hour and the result was a VotingEnsemble model with 91.96% accuracy.
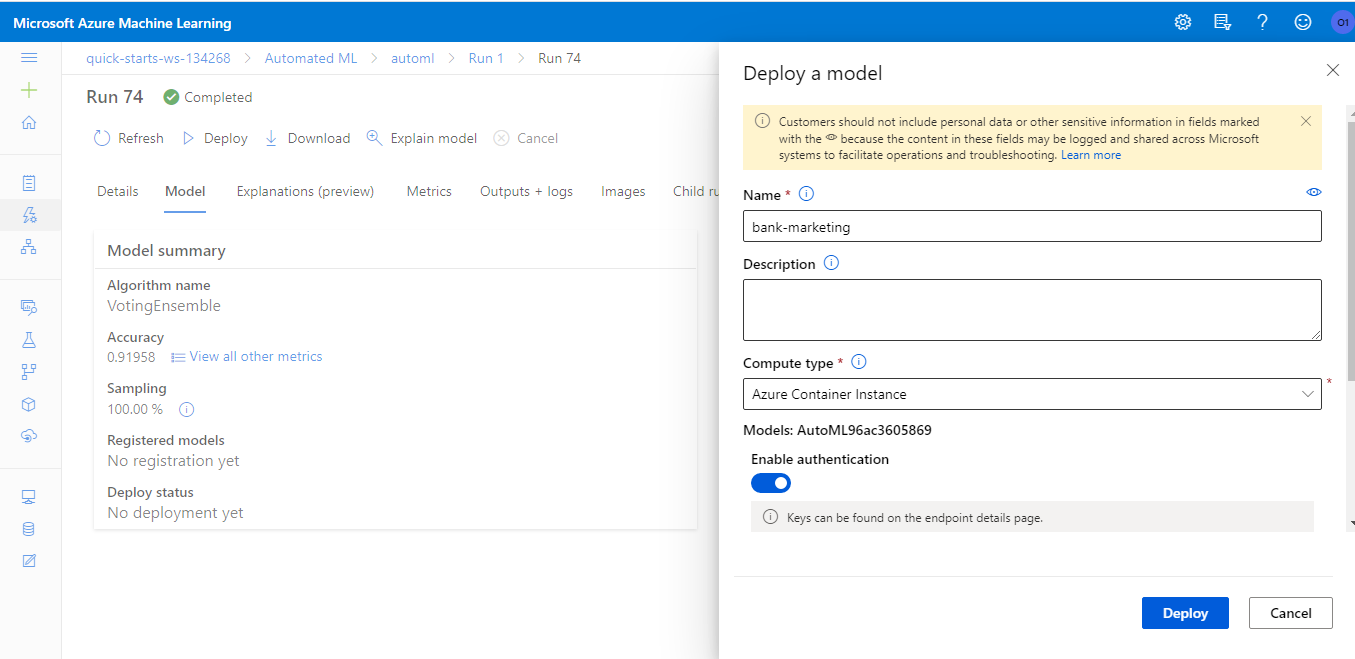
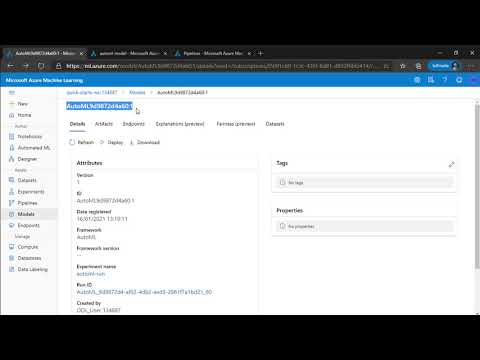
We deployed the best model produced in the last section to an Azure Container Instance (ACI). Authentication was enabled for better security and access control.
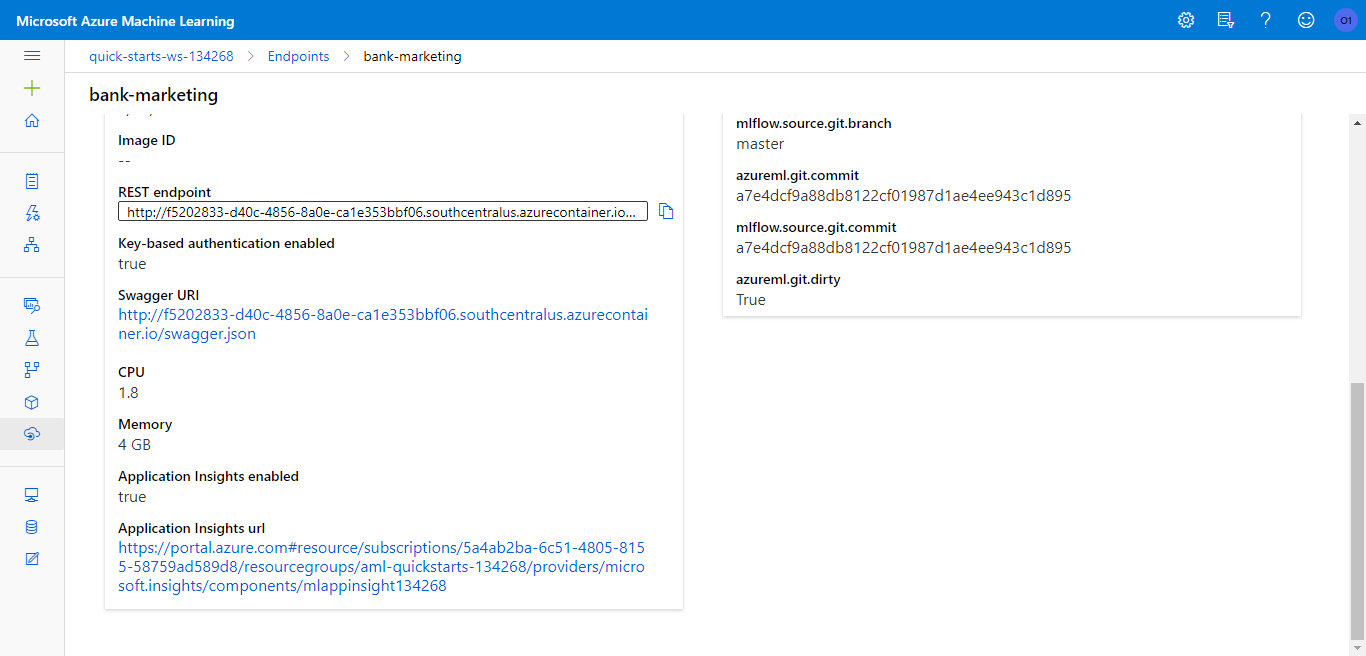
It's important to keep logging of our applications, to fix eventual problems that might occur. For that, we enable Application Insights to our deployiment using the SDK. The full code snippet can be found here.

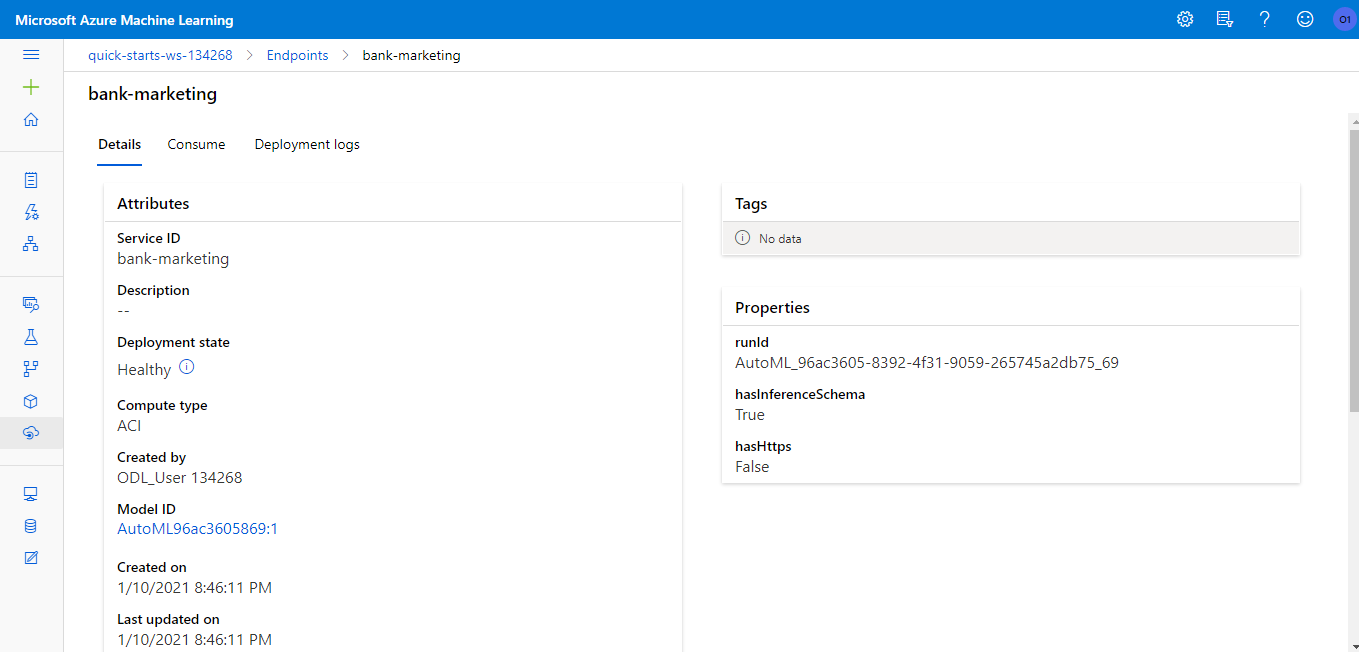
If we access the endpoint via Azure Machine Learning studio, we can see that Application Insights was indeed enabled:
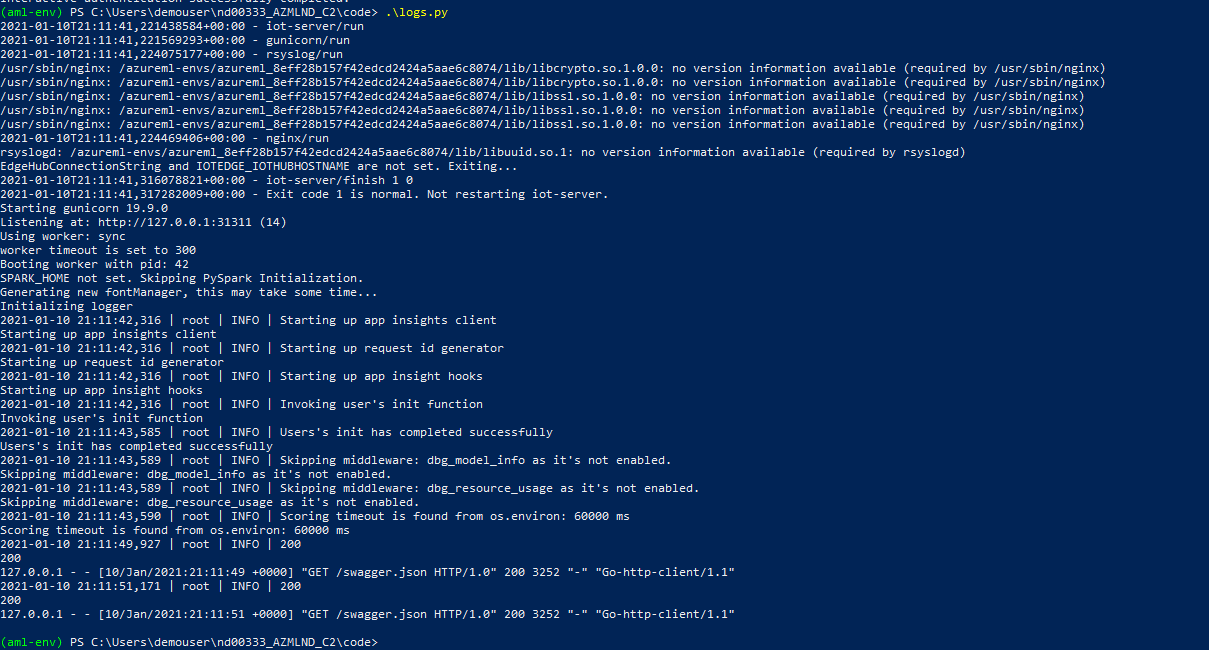
After enabling the logging of activities, we can access them via SDK using the get_logs method form the Azure Webservice Class. The full code can be found at the logs.py file in this Repository.
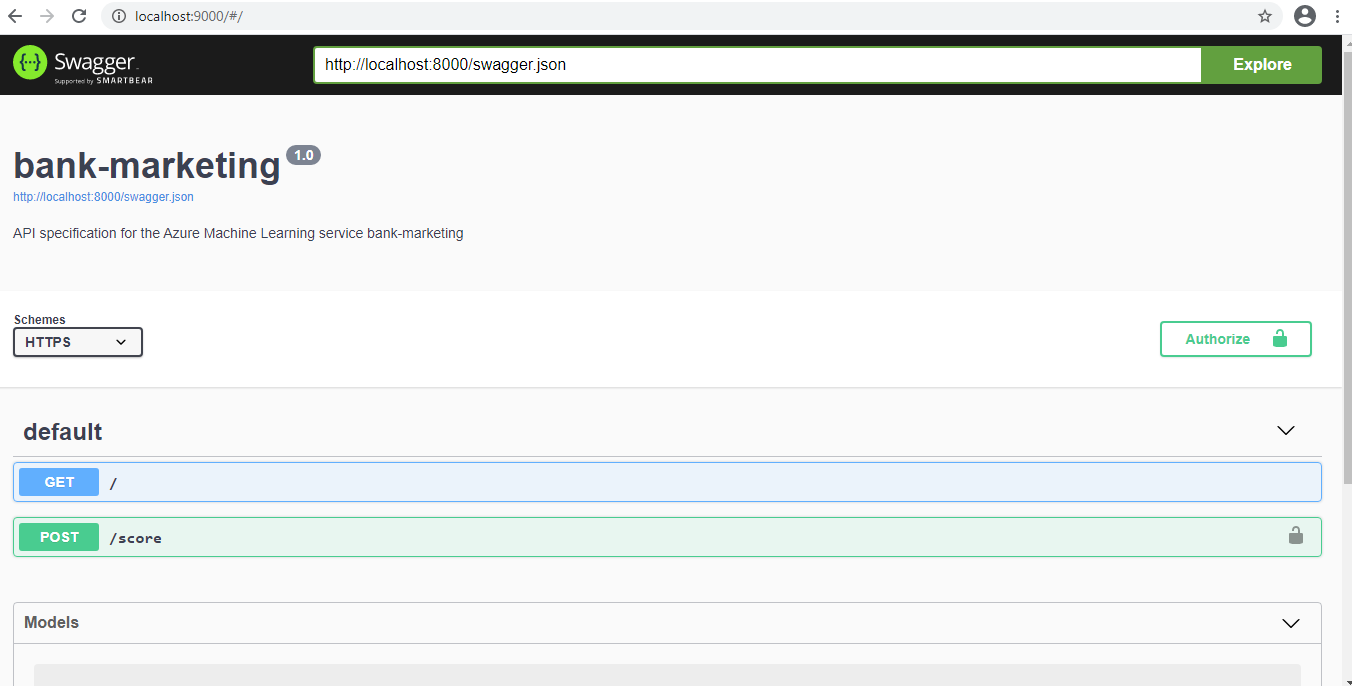
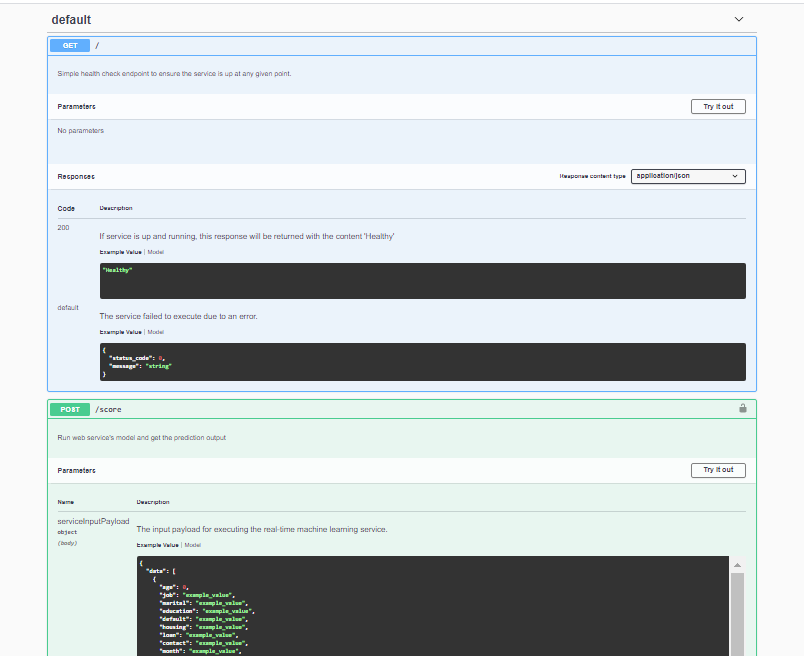
The Azure service provides a swagger.json file with the API documentation for the service deployed. For this step, we created a Docker container for the Swagger service. After the configuration, Swagger shows a list of available API calls, what data they take and what they return. It's also possible to make calls using the Swagger interface. This is very useful for documenting the project as other services that will consume the model can know exactly how the data must be exchanged.
The code for the Swagger deployment can be found here. It consists of a shell script file to start the Docker container and a Python script that will expose our swagger.json to the Docker container.
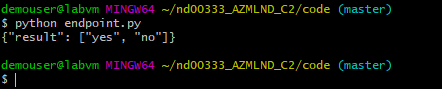
Now that the application is deployed, it's time to consume it. For this, a script called endpoint.py was used. It calls the deployed model with the Python requests library, using the authentication key and the data to be classified. As a result, we get back the predictions, as expected.
It's important to load-test the model so that performance problems can be detected. For that, we used the script benchmark.sh. It will use Apache Benchmark to make calls to the deployed service and measure the performance.
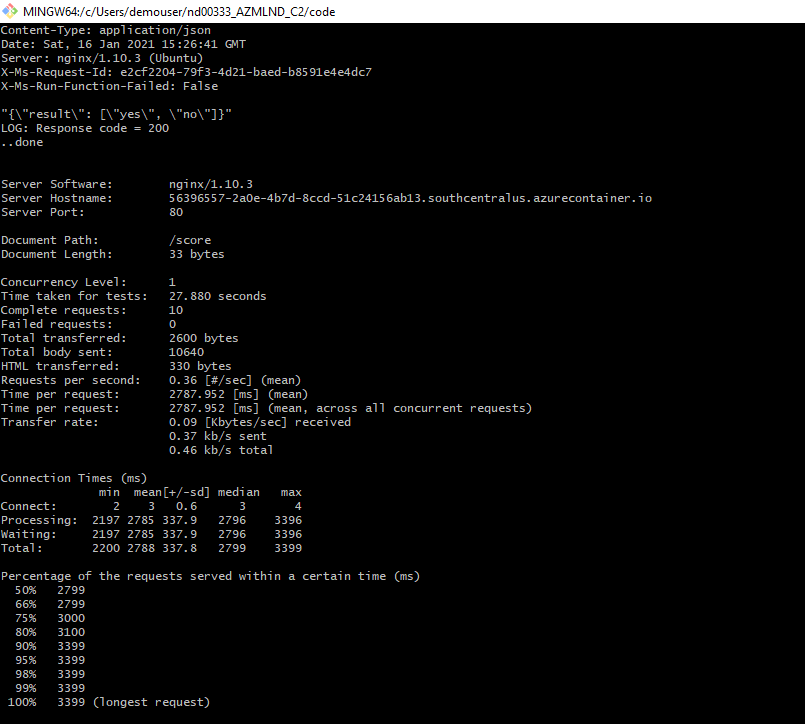
We se that the longest requests took about 3399 ms, which is fast enough and far from the default timeout of 60 seconds for scoring on Azure.
In this step, we create a full pipeline for an AutoML project, to display working with Azure ML with continuous integration and continuous delivery. The whole process is done via SDK using a Jupyter Notebook in a reproducible way.
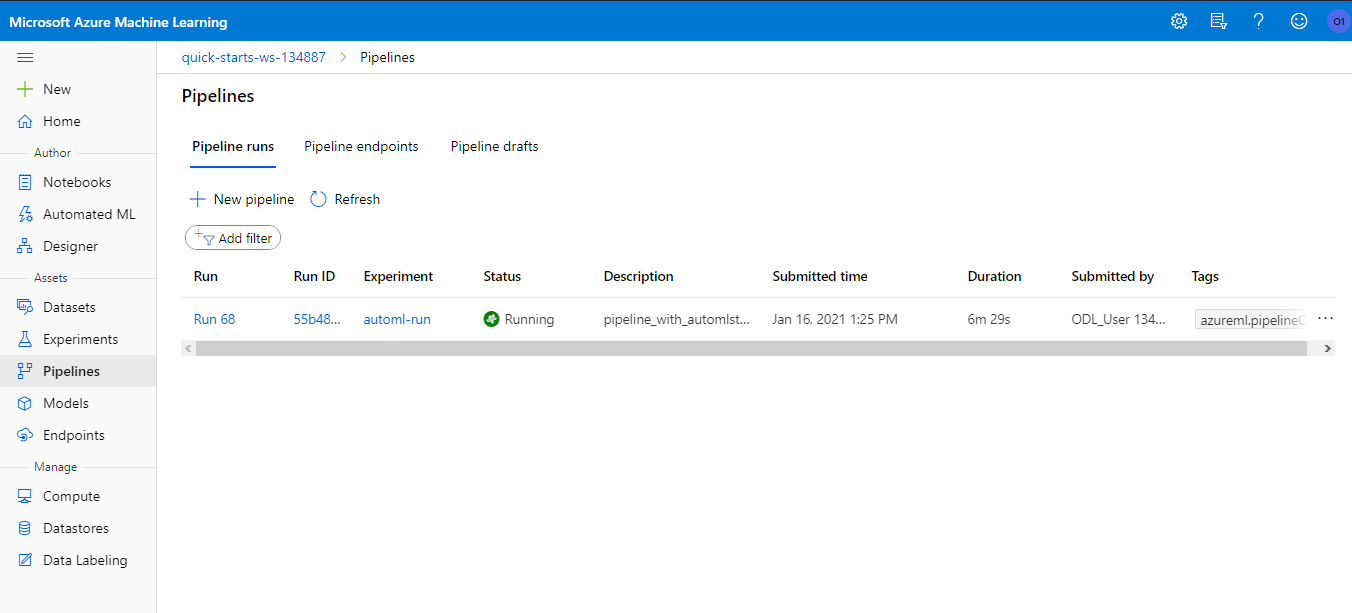
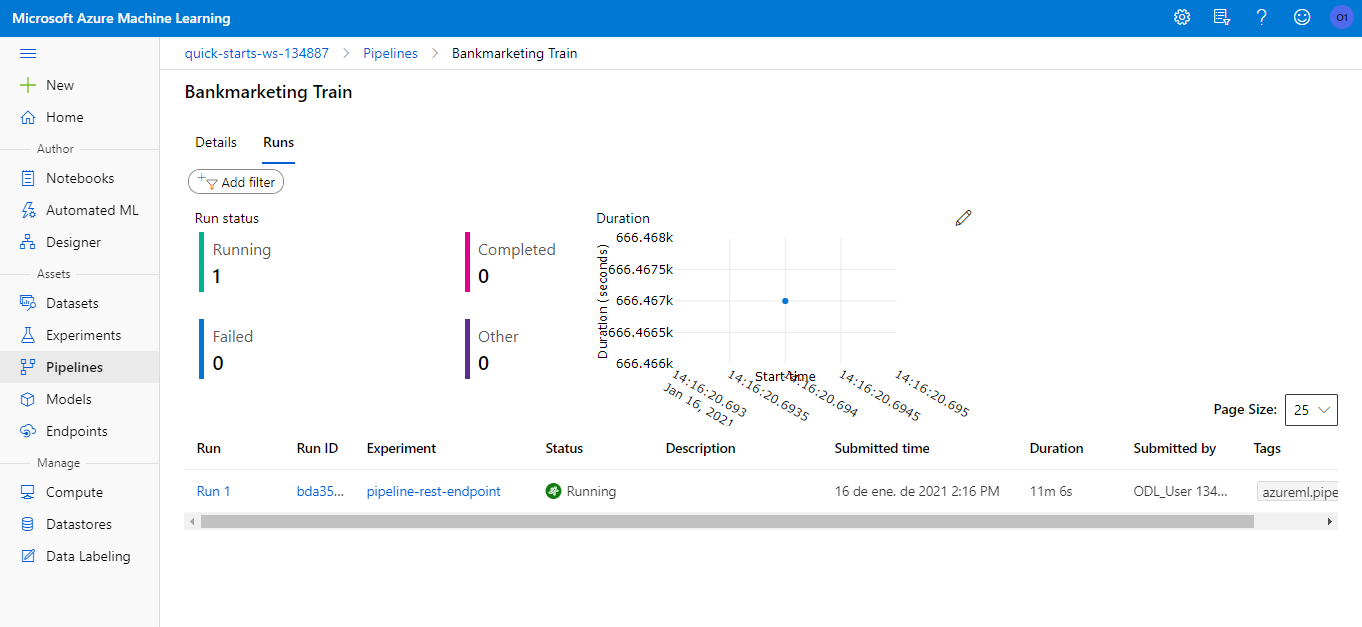
After creating the pipeline, we can see it running on the Azure Machine Learning Studio:
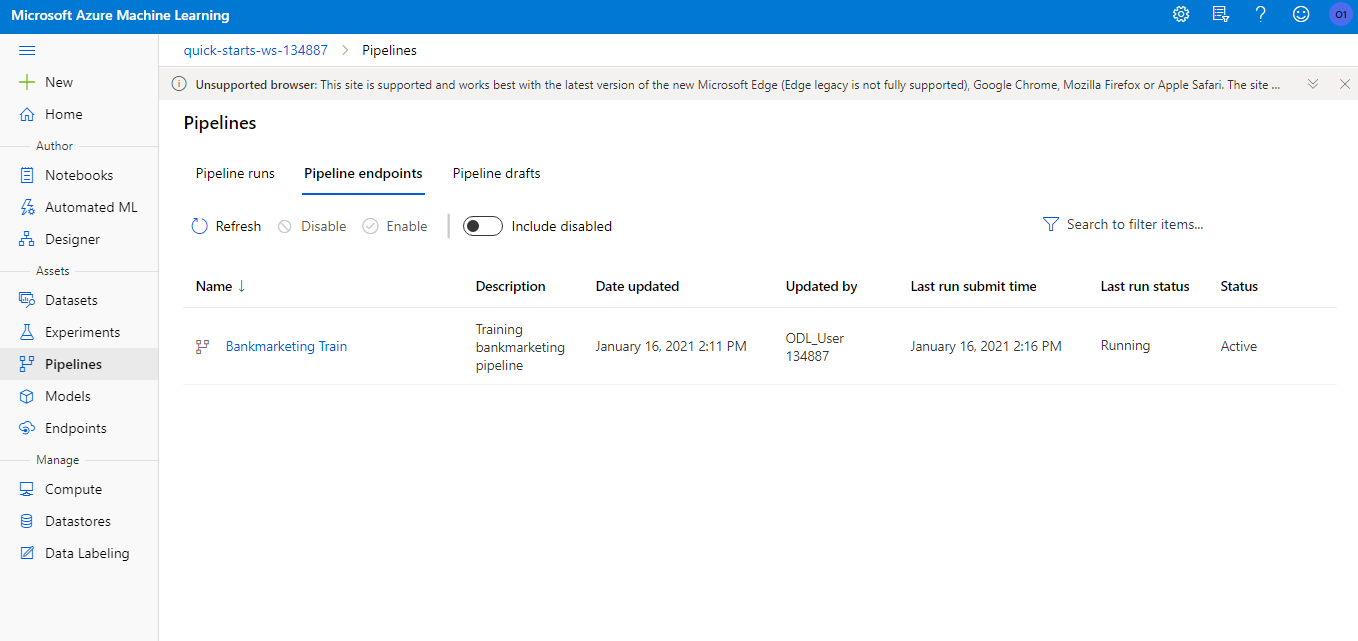
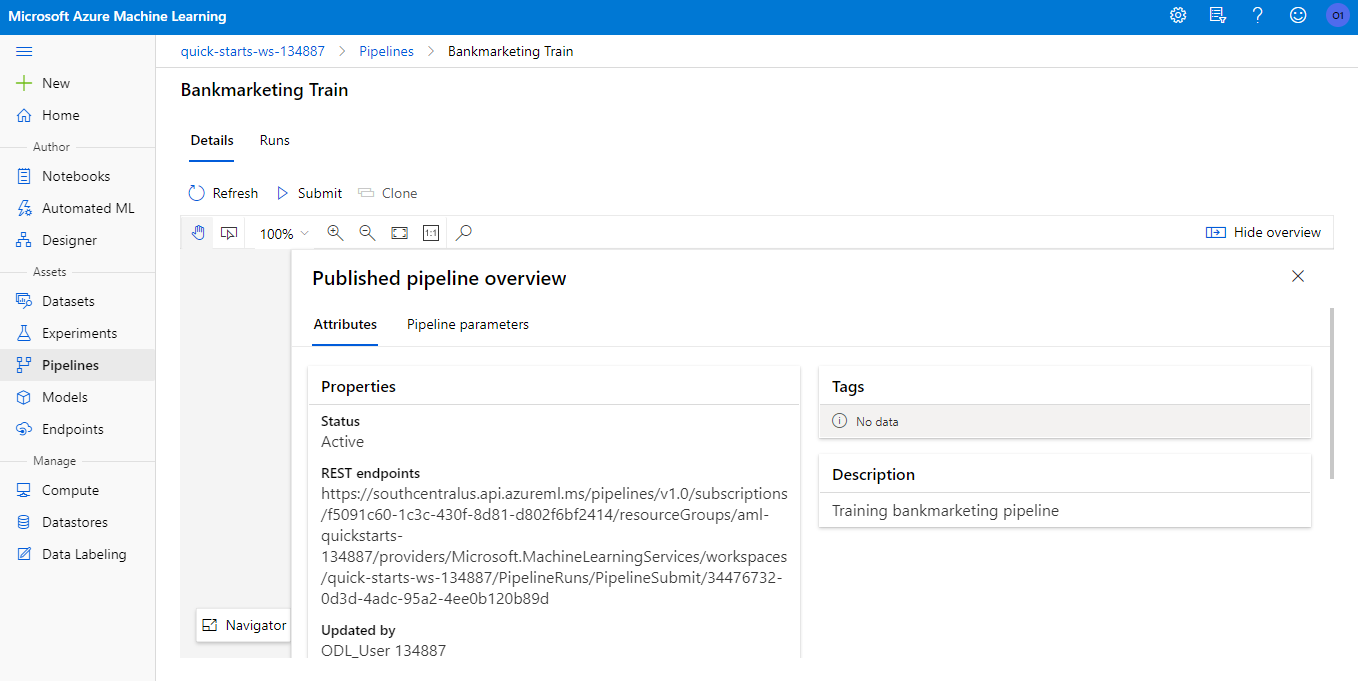
A pipeline endpoint is created, so that it can be consumed from other systems via HTTP request (like an AWS storage system, a CI/CD platform like GitHub Actions).
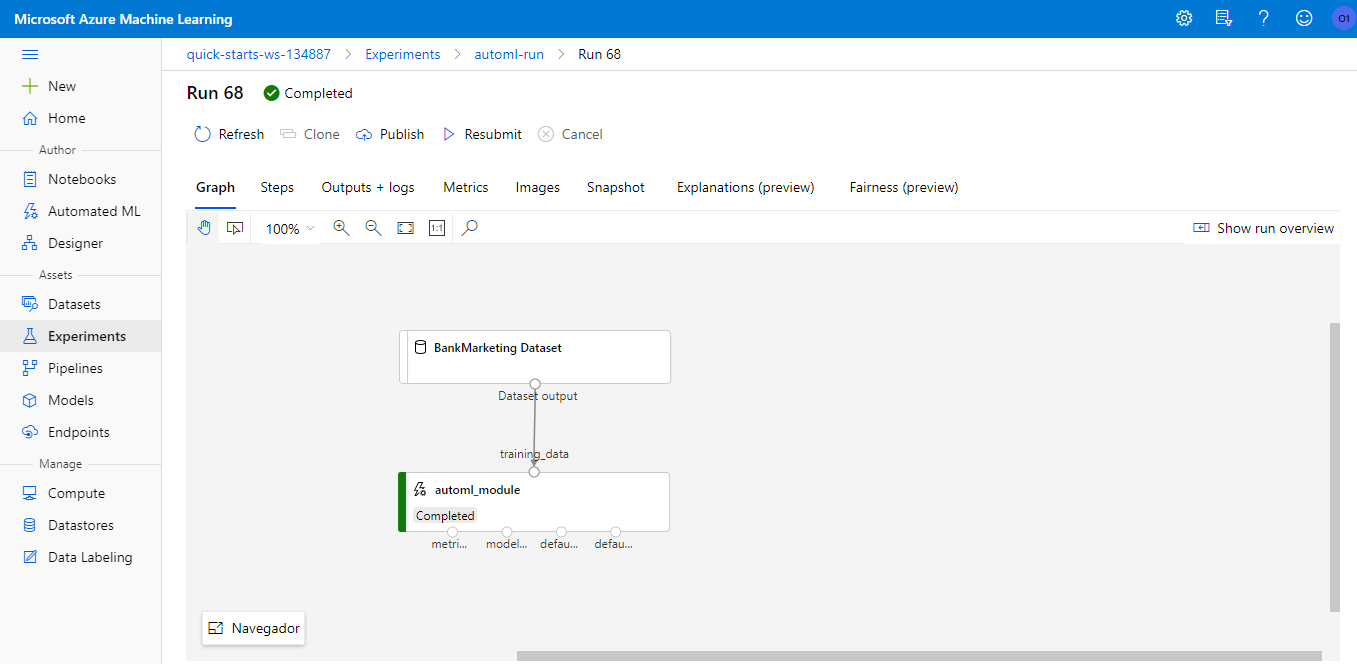
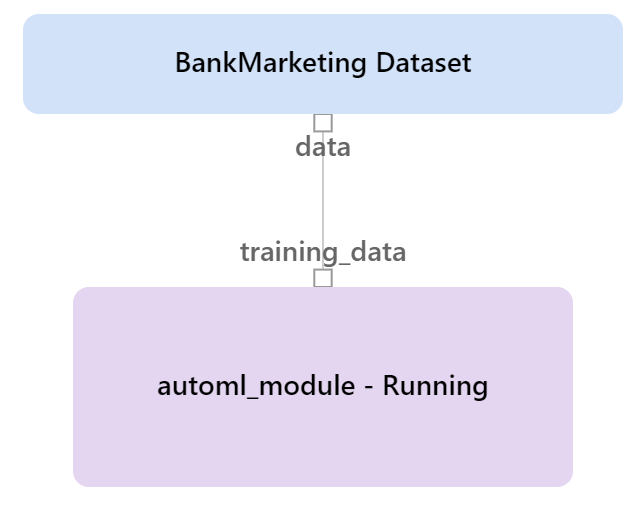
The Azure ML Studio system creates a graphical visualization of the pipeline, to help understanding what is happening.
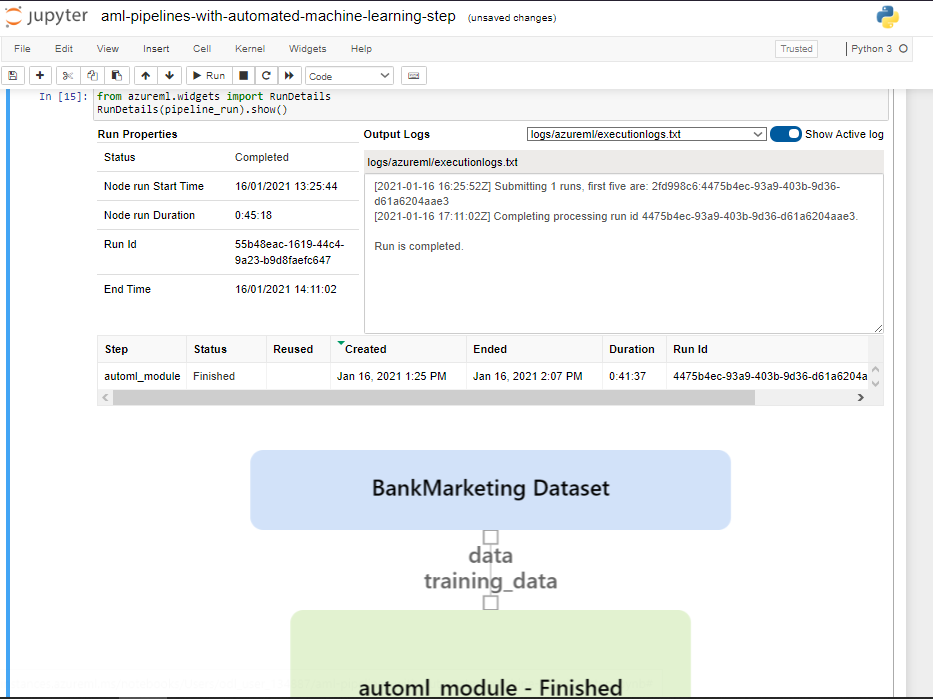
It is possible to follow a pipeline run directly from the Jupyter Notebook using the RunDetails widget:
As you can trigger the pipeline using an HTTP endpoint, you can also schedule the pipeline run via SDK or Azure ML Studio.
This is a quick screencast showing the trained model, the pipeline endpoint and testing the machine learning HTTP API created by Azure:
(click on the image to open the video)
This was a long project, with many steps. The Azure ML Studio is a very good tool to quickly experiment with a dataset. But if you find yourself working on Azure in a big project, I suggest to focus on the pipeline design via the SDK. This will make your work reusable, reproducible and less error-prone. As a means to make the project better, more work should be done in the model itself, maybe trying to archieve better scoring than AutoML, or appliying better data treatment.