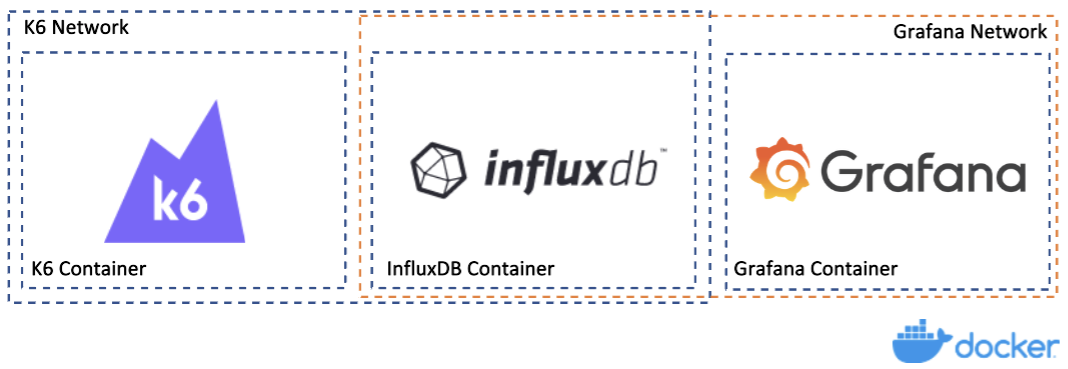
The goal is to create a performance test template with the K6 tool, and as new updates come out, I have the opportunity to put them into practice with this project, new performance testing strategies, and also how to show metrics with greater effectiveness...
- K6 - is an open-source load testing tool
- InfluxDB - is a high-speed read and write database
- Grafana - is the open source analytics & monitoring
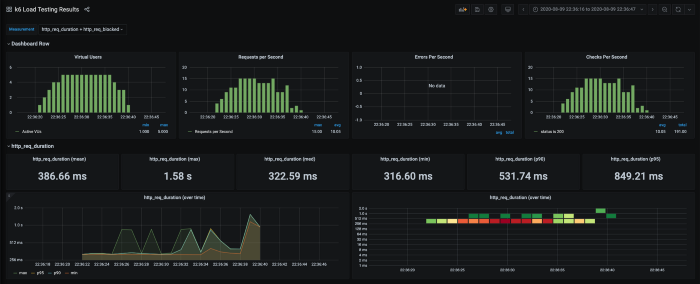
Open a browser to http://localhost:3000/d/k6/k6-load-testing-results and I’ll have an view of my load test streaming across the page in real-time:
-
docker compose -f ./docker-compose.yml up -d influxdb grafana
-
docker compose -f ./docker-compose.yml run k6 run /scripts/tests/product_page/client_side_requestes.test.js
.
├── environment_configs
│   ├── ****.json
│   └── ****.json
├── datapool
│   └── ****.csv
├── tests
│   ├── cache
│   │   └── ****.test.js
│   ├── database
│   │   └── ****.test.js
│   └── product_page
│       ├── ****.test.js
│       └── ****.test.js
├── utils
│   ├── ****.js
│   └── ****.js
├── docker-compose.yml
├── grafana-dashboard.yaml
├── grafana-datasource.yaml
├── index.js
├── package-lock.json
├── package.json
└── README.md
