Machine Learning methods have proven to be effective in accomplishing certain tasks dealing with large databases. However, the way these methods make predictions is often not fully understood and might be biased by the data present in specific datasets.
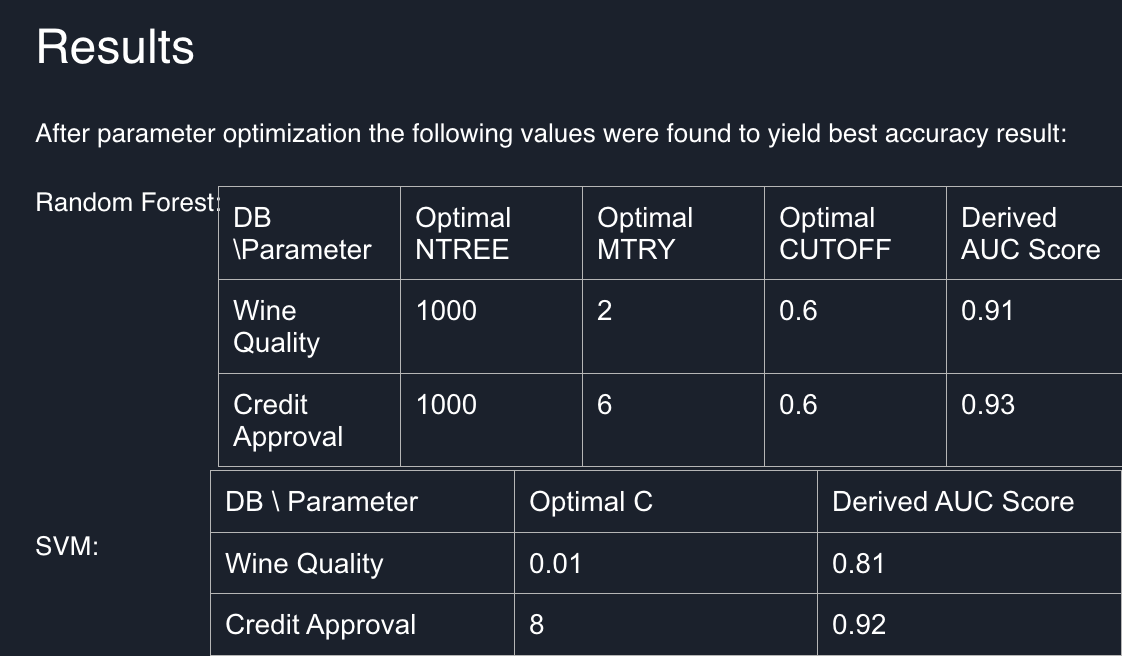
In this project Random Forest Classification and Support Vector Classification models are trained on two different datasets. Their relevant parameters are optimized through a parameter Grid Search to maximize the evaluation metric for both classifiers. The accuracy evaluation metric used is Area Under Curve score for Receiver Operator Characteristic curve. It provides a metric to determine how well can the classifier predict True Positive samples as the threshold to determine True prediction increases from 0 to 1. Given relatively balanced data which is used in this project ROC AUC provides a reliable way to measure overall True Positive and False Positive accuracy in one score. The project goals are to better understand the process of training a Machine Learning Classifier as well as the parameters used in the process for Random Forests and Support Vector Machines.
The benefits of using Machine Learning Models over traditional algorithmic approaches are in the way it can extract complex relationships in multidimensional datasets and transfer it to an easily computable math problem. However, in order to rely on Machine Learning techniques its decision making process needs to be addressed and given a form that is understandable by a human. In many cases (i.e. medical diagnosis) the ML techniques are ought to be used more as a tool for experts to utilize in order to make classifications that take into account their knowledge and expertise. This calls for ML systems that output not just the label values of class predictions, but the reasoning to why these labels were chosen. Even in the cases when ML pipeline output is immediately processed by a machine (Self-Driving Car) explainability reports would only become more and more relevant and important for detecting crucial flaws that might affect people’s safety ahead of time and addressing unwanted performance of an autonomous system. Moreover, explainable ML logging in Autonomous systems will be absolutely necessary given the requirements of airline type “black boxes” to interpret reasons of certain failures in performance.
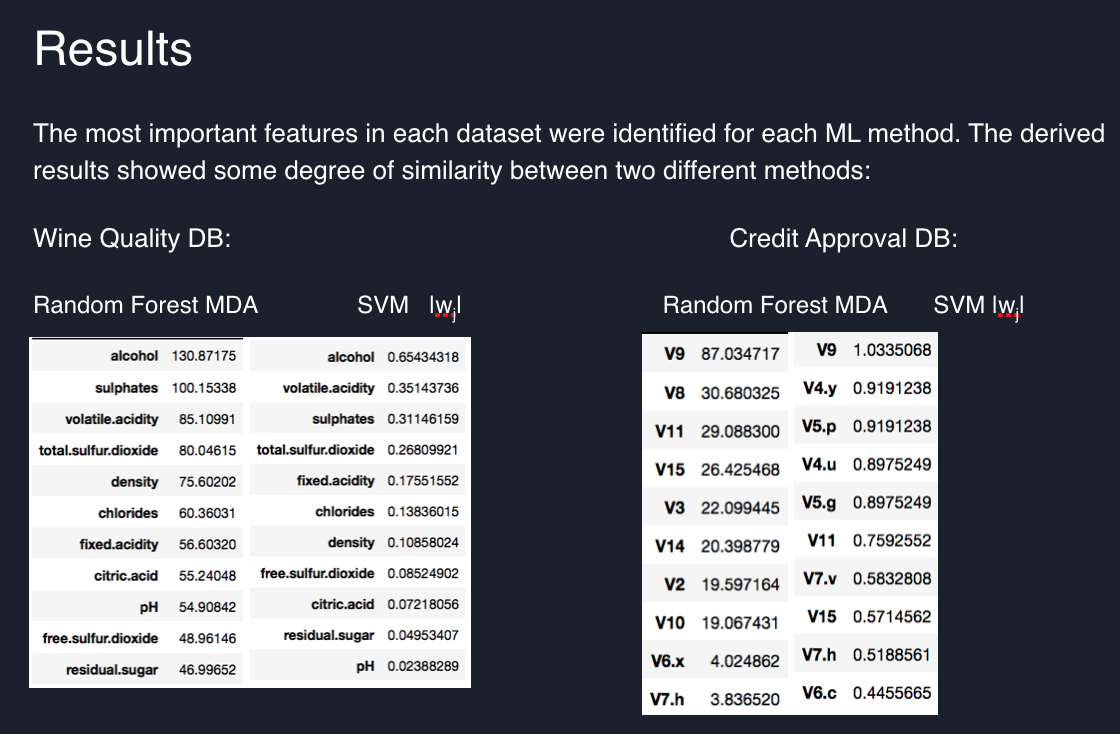
In this study two distinct databases were used to train Random Forest and Support Vector Classifiers. The performance of these methods was recorded using AUC Score - method widely used in industry, and compared. Then most important features for each ML model were identified and compared.
The project uses R v3.5.1 language for statistical computing and graphs. Inside R caret package was used. In particular randomForest from randomForest package and svm from e1071 package R implementations are used AUC scores are then obtained using pROC package:
Random Forest Classifier is a Supervised Machine Learning method that utilizes Decision Tree statistical learning. A Decision Tree Classifier constructs a tree that splits on the features of provided dataset to minimize the difference between the actual target class and the output of the tree on every leaf node known as Gini impurity. An advantage of using Random Forest over a Decision Tree method is in the ensemble learning. By returning the mode output of multiple pseudo-randomly created Decision Trees Random Forest Classifier decreases prediction variance compared to a single Decision tree and ensures that there is less overfitting to the training data. Since RFC creates multiple trees it can select features by random having different Decision trees divide the data across various features. This approach makes it possible to better understand importance of features in making a classification decision. The most common parameters to tune a RFC are: the amount decision trees produced, maximum amount of features used in a single Decision Tree and the maxim depth of Decision Trees.
In the process of training the model first the data is bootstrapped with replacement to form distinct datasets that are used to train individual Decision Trees. The total amount of trees is determined by ntree parameter. Each choice is used to train a tree that will participate in overall decision process. The amount of features in the dataset to look for the best split in individual Decision Trees is specified by mtry parameter. Once the individual decision trees are trained - the overall prediction is based on cutoff parameter that states the percentage of Decision Trees in the forest that need to vote for the class to be positively predicted.
A trained randomForest returns a confusion matrix which is an Out-of-Bag prediction confusion matrix. With an Out-of-Bag approach individual Decision Trees are only validated on the data they did not use for training. This enables the user to obtain a reasonable F1_Score without the need to split dataset for training and testing. The Decision Tree vote for the data that it was trained on will then simply be ignored.
Support Vector Machine is a Supervised Machine Learning method which aims to find a hyperplane on the provided dataset that would split the data in classes. Such a hyperplane is chosen to maximize margin - the distance between the closest data points of each class to the hyperplane. The result divides the feature space of dataset into discrete sections that are labeled with the target classes.
The cost parameter C is used to specify the cost of misclassification. High values of C will make the model more likely to overfit the data splitting it in a very specific way. This will most likely decrease the F1_Score of test dataset prediction. On the other hand - lower values of C will make the SVM use the hyperplane on provided data with minimal margins ignoring the misclassifications. Therefore, an optimal C value needs to be found that will create the best model for the provided data.
The metrics first chosen for the project - F1 Score will be very low if either Precision or Recall is low but will approach average value as Precision and Recall are close to each other. This provides the check to detect an “ignorant” classifier - the one that only predicts True where Precision is much lower than Recall which is 100%.
- F1 score accuracy metrics: weighted average of precision and recall
F1 score = 2*(Recall*Precision)/(Recall + Precision) , where
- Recall: The ratio of True Positive predictions in all the data marked as Positive
Recall = True Positive#/(True Positive# + False Negative#)
- Precision: The ratio of True Positive predictions in all Positive predictions
Precision = True Positive#/(True Positive# + False Positive#)
After some consideration the metrics used in this project was changed to AUC score that provides a reliable way to combine Recall and True Negative (aka Specificity) accuracy rates. The ROC curve plots both of these rates on a graph as the probability threshold to determine True prediction grows gradually from 0 to 1. The 0 point here obviously will miss both all the True and False Positives as it classifies each sample as false, this will make Specificity high. As this threshold increases, both Recall will increase, but Specificity is expected to decrease(unless the classifier is perfect and has no False Negative predictions). A totally random classifier will have equal dynamics for Recall and Specificity, therefore, making the area under such straight line from 0 to 1 equal to ½. A good classifier will then have a high Recall making the area under such curve greater up until it forms a square that has area of 1.
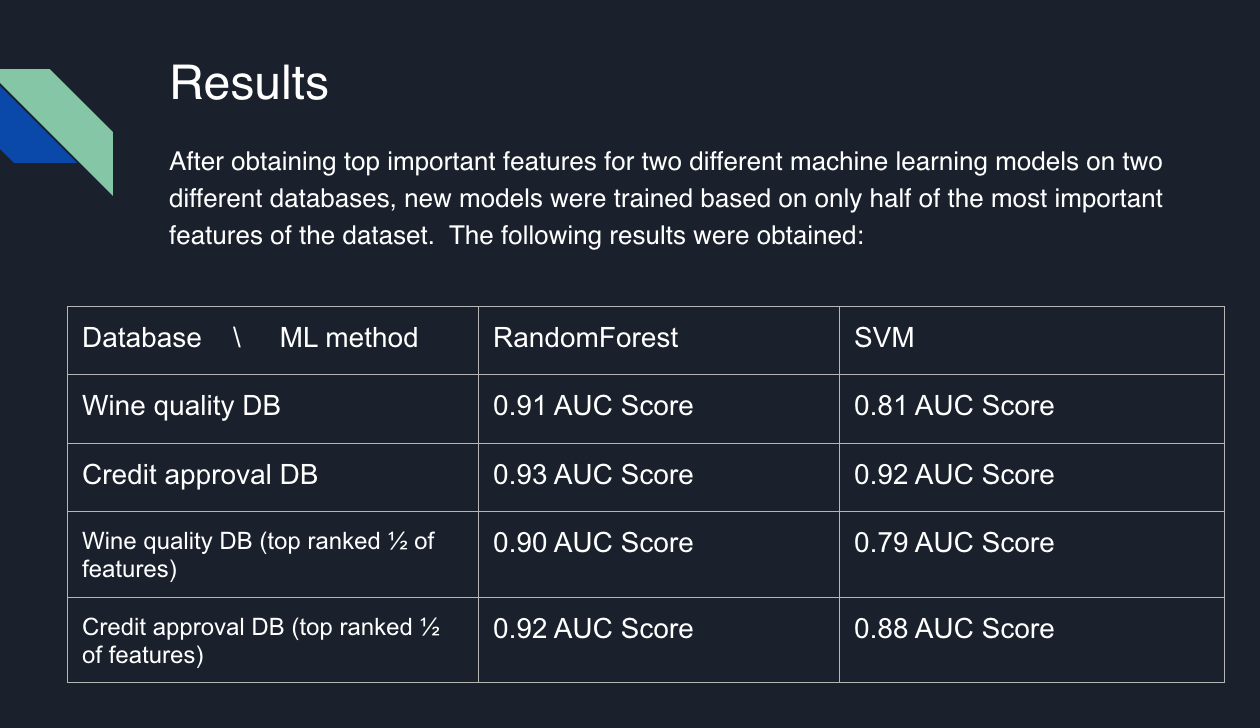
The study showed that in a Machine Learning model not all the data features are relevant for determining correct predictions. For this project 1/2 of most important features were selected and new models were trained using only these features. The study showed that the new models had an accuracy close to the accuracy of models with full-feature datasets.


