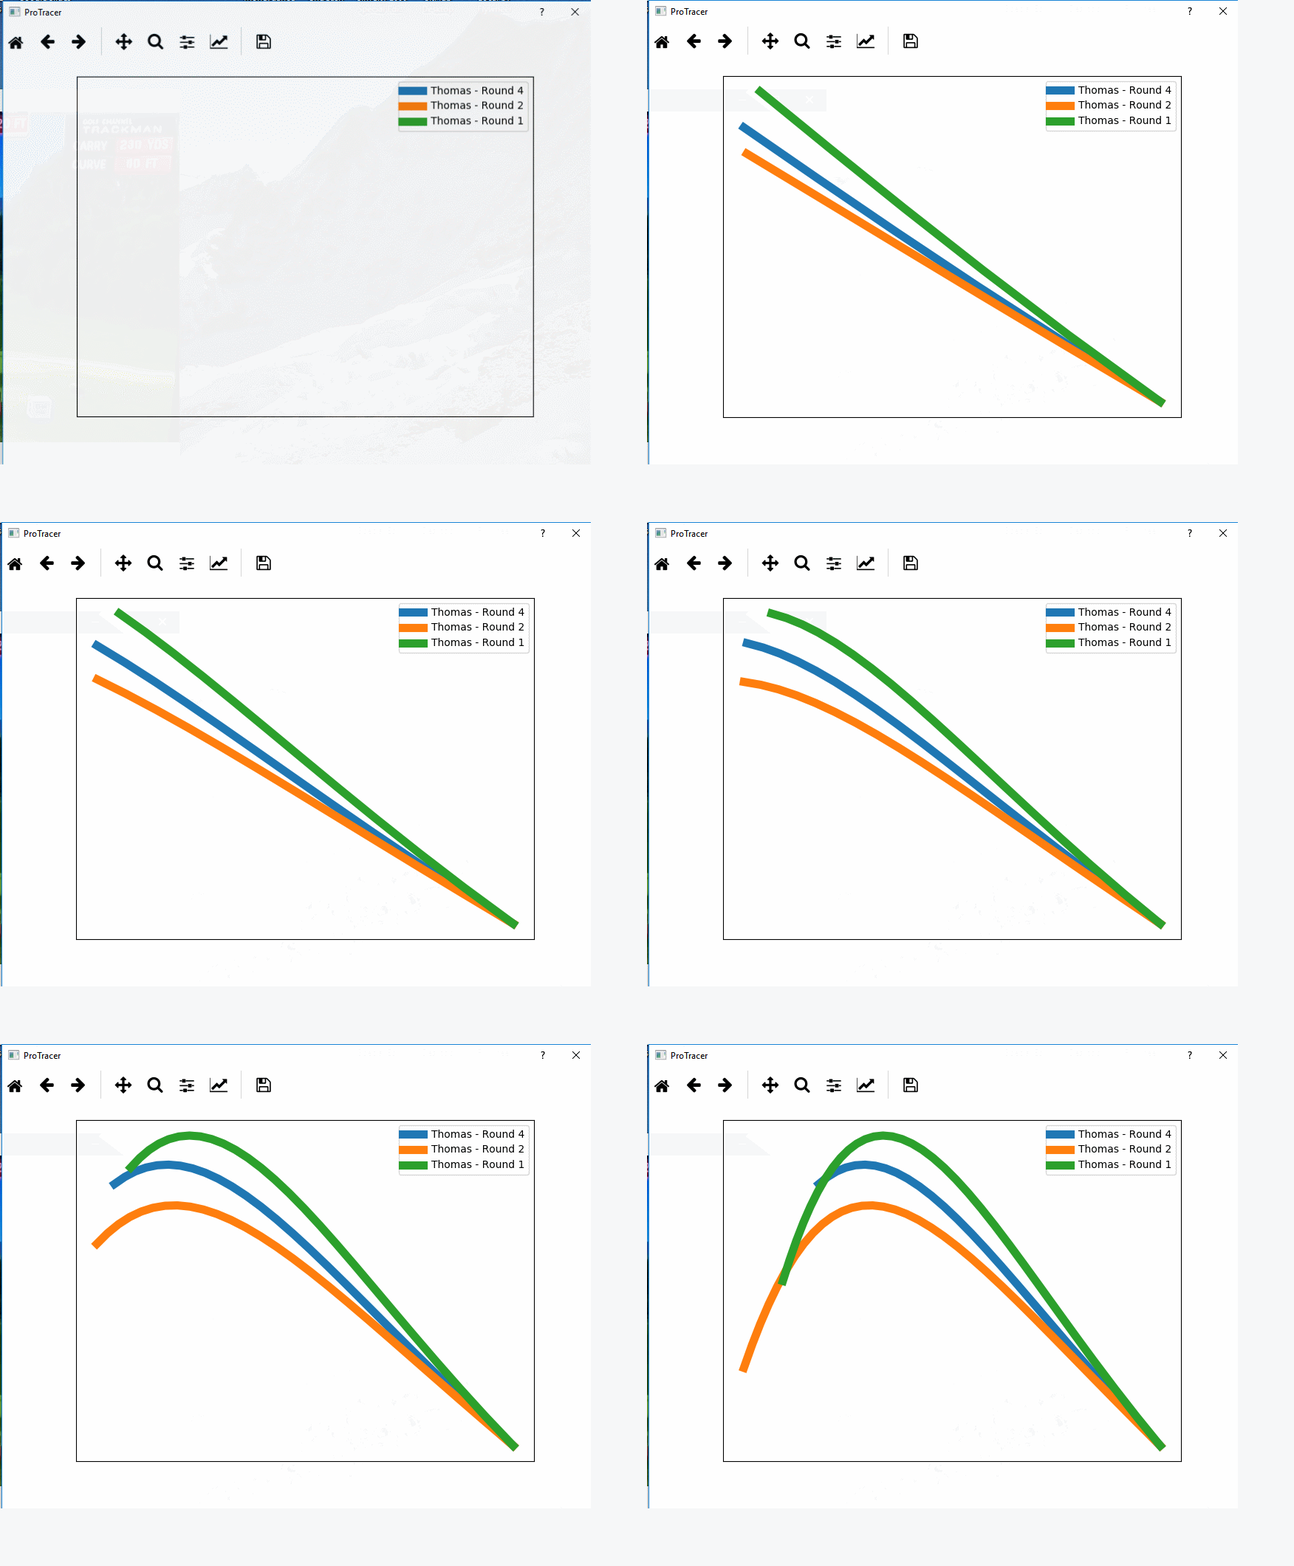
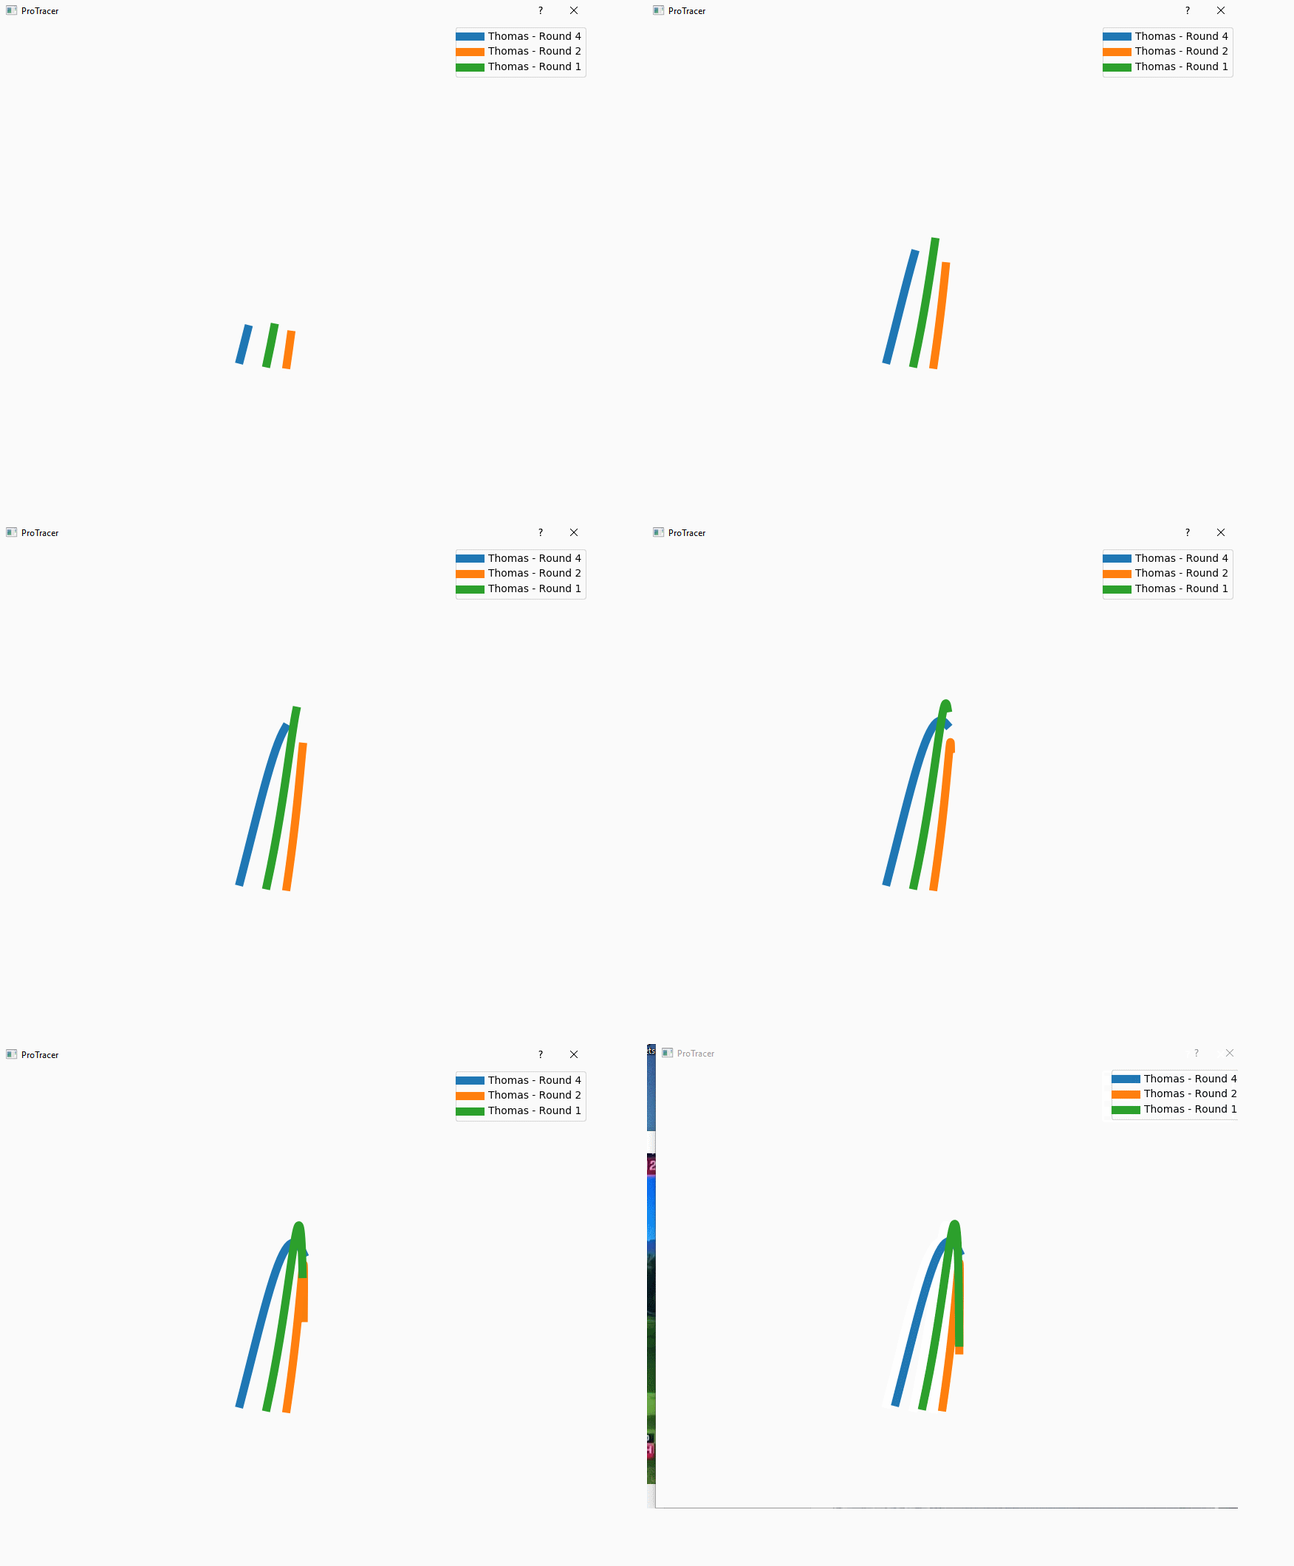
ProTracer is an application built in Python 3.6.1 to visualize golf shot trajectories. This application was built for submission as Project #1 for DATA 520 at Mercyhurst University in the Fall 2017 term.
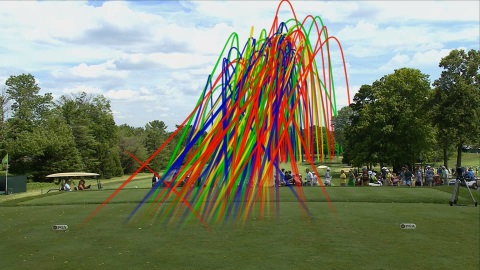
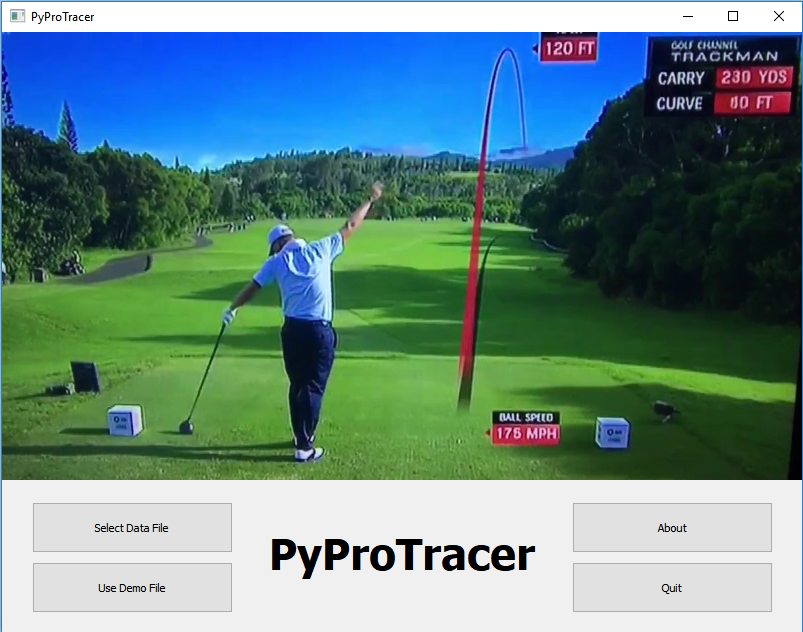
Each television network that broadcasts a PGA Tour event (or other golf tours like the European Tour) has their own version of ProTracer. The idea is still the same with each, show the path of a golfer's shot as it's travelling through the air.
Single Shot Example
Multiple Shot Example
The data being used for this application comes from directly from the PGA Tour through their ShotLink Intelligence program. In August 2017, I applied for access to their data and was ultimately approved.
The data exported from ShotLink we are looking at is the Radar Trajectory Data. Within this data, there are a few fields available that will assist in the visualization and plotting of each shot:
| Name | Description |
|---|---|
| Trajectory Sequence # | The sequence the trajectory data was captured in |
| Trajectory X Coordinate | The X coordinate of the ball when captured (e.g. the distance away from the golfer) |
| Trajectory Y Coordinate | The Y coordinate of the ball when captured (e.g. the left to right curve of the ball) |
| Trajectory Z Coordinate | The Z coordinate of the ball when captured (e.g. the height of the ball) |
| Extrapolated | Y/N flag indicating if the data point is calculated or actual |
There are several other fields available, such as Club Head Speed, Launch Angle, and Total Distance, but for the purposes of plotting the data, the X, Y, and Z coordinates are plenty.
There are several Python modules required in order to run the application.
- PyQt5
- Matplotlib
- Pandas
- Numpy
A requirements file is provided, so using pip should get the application ready to run.
pip install -r requirements.txt
Once all the modules are installed, execute the app.py file using python from within the directory the files are located:
python app.py
The UI was built using the PyGt5 module. Each UI component was laid out using Qt Designer 5.6.2 and then compiled into Python files. Hand coding the UI would be very tedious, so this application has proved very useful.
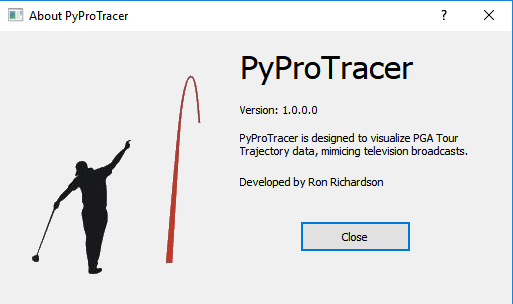
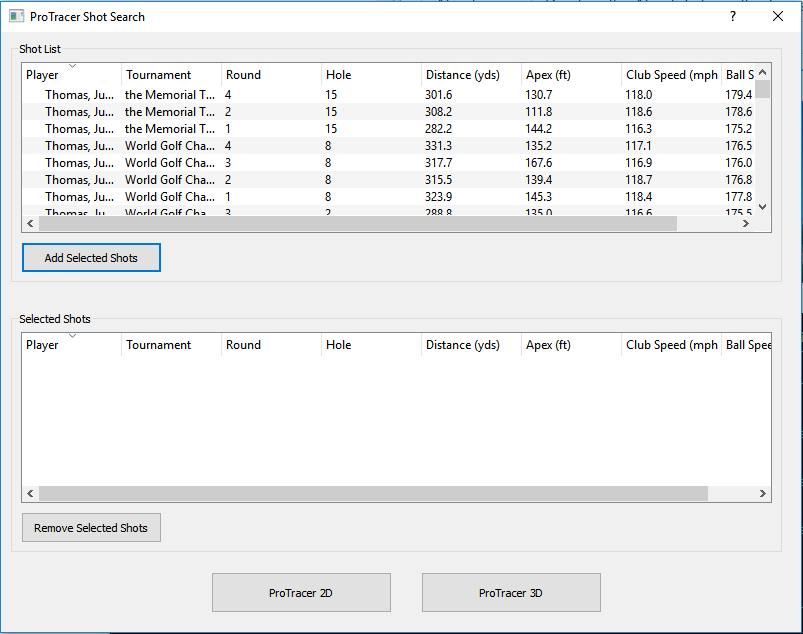
There is a simple About dialog box showing application information and has no other functionality. Finally, the protracer dialog is where all the magic happens. This dialog is where the user selects a golfer, tournament, and the shots to plot. Along with the plot, statistics for each shot is displayed as well.
The main window is the first the user sees. This window contains the main functions available to the user.
| Button | Description |
|---|---|
| Select Data File | Allows the user to select their own data file for use in the application. The file must be formatted the same way as the PGA Tour ShotLink data. |
| Load Demo File | Automatically loads a small demo file with 4 golfers and their shots for 2017. |
| About | Displays the About dialog with information about the application |
| Quit | Exits the application |
The about dialog shows the user the current build information, developer, and a quick description of the application.
The protracer dialog is where the user will select the shots to visualize and see statistical data for the shot(s).
The 2D plot is a simple animated line chart of the shots selected.
The 3D plot is a simple animated 3D line chart of the shots selected. Normally, when viewing a 3D plot, using the mouse can change the rotation of the elevation and azimuth of the plot. However, when embedded in a GUI like this, that ability seemingly is not possible.
- About Dialog image credit: No Laying Up
- Trajectory Data: PGA Tour
Ron Richardson Mercyhurst University Graduate Student Email / LinkedIn

