
A library of Vue map components for model exploration, using Leaflet for visualising data in a geographical context.
-
Install from npm:
npm install @reside-ic/vue-maps -
Import into your project and register components globally or locally:
import {BubblePlot} from "@reside-ic/vue-maps"

// global
Vue.component("bubble-plot", BubblePlot)

// or local
new Vue({
  el: '#app',
  components: {
    BubblePlot
  }
})
Include the distributed css file in your app:
dist/css/style.min.cssAlso include Bootstrap and Leaflet styles:
<link rel="stylesheet" href="https://stackpath.bootstrapcdn.com/bootstrap/4.4.1/css/bootstrap.min.css"> <link rel="stylesheet" href="https://unpkg.com/leaflet@1.6.0/dist/leaflet.css" />To use the maps library directly in the browser, just include
dist/js/vue-maps.min.json the page, after Vue:<script src="https://cdn.jsdelivr.net/npm/vue/dist/vue.js"></script> <script type="text/javascript" src="node_modules/@reside-ic/vue-maps/dist/vue-maps.min.js"></script>In this case the component will be automatically registered.
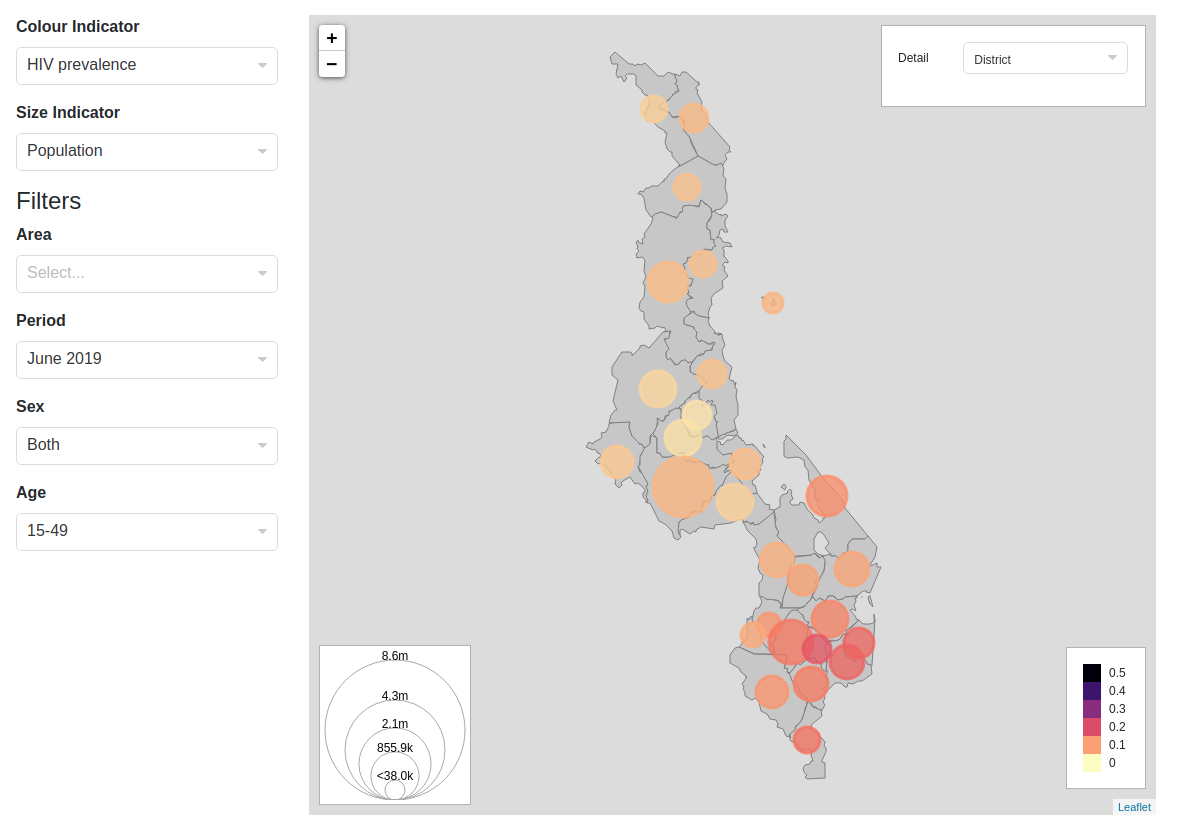
BubblePlot displays data values ('indicators') where each value is linked to a geographical area shown on a map. The geography is provided to the component as geojson data.
A coloured circle is drawn over each area, where the colour of the circle indicates the value of one type of indicator for that area, and the size of the circle indicates the value of another type of indicator. Tooltips can be viewed for each area showing the exact value of both indicators.
Any number of indicator values can be provided for each area. The user may select from drop-downs in the component which type of indicator values to display by colour and by size.
The dataset provided to the component may also contain any number of other data values to be used as filters. The user can select these values from further drop-downs to choose how to filter the visible data.
The geojson provided can be hierarchical e.g. districts within regions within a country. The user can select which level in this hierarchy to view data for by selecting from the 'Detail' drop-down. It is expected that values for all levels in the hierarchy will be provided in the dataset - the component does no aggregation itself.
Area is treated as a filter too - if no areas are selected in the Area drop-down, bubbles for all areas will be displayed. The user may also select one or more areas (at any level), to automatically zoom to display bubbles only for the selected areas.
Metadata provided to the component defines the colour scale to display and expected ranges of the indicator values. as well as the expected data format, and display labels.
Metadata must also be provided for the filter options to display in the Filters drop-downs, including display labels.
BubblePlot displays two legends, one for size and one for colour.
For a full example see examples/bubbleplot.html.
The dataset is provided to the component in the
chartdataproperty. The value provided should be an array of objects, where each object represents a row in a tabular dataset, with properties whose names match column name and whose values are the cell values.The component can handle data in both long format and wide format. In long format, each row holds only a single indicator value, with a separate column indicating which indicator the value is for. In wide format, each row holds many indicator values.
In both formats, each row also contains a value identifying the area, and further values corresponding to filter values, e.g. if 'Age' is a filter there will be rows for each age group, for each area.
The component uses the metadata provided in the
indicatorsproperty to know which format applies, and how to apply it.For example, a row in long format might look like:
  {
      area_id: "MWI",
      sex: "female",
      age_group: "15-49",
      calendar_quarter:"CY2016Q1",
      indicator_id: 1,
      value: 7631061
  }
Its corresponding indicator metadata might be:
  {
      indicator: "population",
      value_column: "value",
      indicator_column: "indicator_id",
      indicator_value: "1",
      name: "Population",
      min: 0,
      max: 20000000,
      colour: "interpolateViridis",
      invert_scale: false
  }
The component needs to know which indicator this row provides a value for. It uses the
indicator_columnandindicator_valueproperties of the metadata for this. If it finds the value ofindicator_valuein the row's property named with the value inindicator_columnthen this is the indicator for the row, and its value will be found invalue_column.A row in wide format might look like this:
    {
        area_id: "MWI",
        sex: "female",
        age_group: "15-49",
        calendar_quarter:"CY2016Q1",
        population: 7631061,
        prevalence: 0.012324,
        plhiv: 89131
  }
Its corresponding indicator metadata might be:
  {
      indicator: "population",
      value_column: "population",
      indicator_column: null,
      indicator_value: null,
      name: "Population",
      min: 0,
      max: 20000000,
      colour: "interpolateViridis",
      invert_scale: false
      }
There is no need for the
indicator_columnandindicator_valueproperties to be populated in the indicator metadata, since there will be no corresponding column in wide data. Instead, each indicator will be identifiable on each row by itsvalue_columnalone.This component requires the following props:
Type:
BubblePlotLabels, which has these properties:Name Type Description filtersLabel string Label to display for the header above the filters drop-downs colorIndicatorLabel string Label for the Colour Indicator drop-down sizeIndicatorLabel string Label for the Size Indicator drop-down detailLabel string Label for the Detail drop-down. This enables you to choose your own text for the UI, or support multiple languages.
Type:
Feature[]The features props provides geojson data on the geography to be displayed in the plot. Please see the geojson site for a full geojson spec. BubblePlot requires
area_idto be present in each feature'sproperties. This identifier is used for selection and filtering of areas.Type:
LevelLabel[]whereLevelLabelhas these properties:Name Type Description id number Numeric id for a level in the area hierarchy. Lower numbers indicate larger areas, and level 0 is expected to be the lowest level, indicating a country. area_level_label string Display label for this level e.g. 'District' display boolean Whether to show this level in the Detail drop-down Type:
IndicatorMetadata[]whereIndicatorMetadatahas these properties:Name Type Description indicator string Identifier for this indicator. Does not have to match indicator_value. value_column string Name of the property in each data row which holds the value of this indicator indicator_column string In long-format data, the name of the property in each data row which holds the indicator. Should be null for wide data formats. indicator_value string In long-format data, the value in the indicator-column which identifies a row as belonging to this indicator. name string Display label for this indicator. This will be shown in the indicator drop-downs. min number Minimum expected value for this indicator, used to calculate colour scale. The size scale is calculated from the actual values in the data. max number Maximum expected value for this indicator. colour string Name of the colour function for calculating colour values. This should match one of the d3-scale-chromatic colour schemes, e.g. "interpolateMagma". invert_scale boolean If true, the usual scale for the colour function will be inverted i.e. lower values will be assigned colours which would usually be given to higher values, and vice versa. See above for a full description of long and wide format data. The BubblePlot will make all indicators provided in this property available as both colour indicators and size indicators.
Type:
any[]See the above section on data format for details on the expected format of this property.
Type:
Filter[]whereFilterhas these properties:Name Type Description id string Identifier for this filter. label string Display label for this filter. Will be shown as the label for this filter's drop-down. column_id string Name of the property in each data row which holds the value relevant to this filter. options FilterOption[] The available values for this filter. These will be displayed in the filter drop-down, and should match the actual values in the data. FilterOptionhas these properties:Name Type Description id string The expected value in the data. label string Display label for this filter options. This text will be shown in the filter drop-down. When the user selects a set of values in the filter drop-downs the data shown on the map will be filtered to only include rows match those values.
Type:
BubblePlotSelections:Name Type Description colorIndicatorId string Id of the selected indicator for colour sizeIndicatorId string Id of the selected indicator for size selectedFilterOptioins string The selected filter options as a dictionary, where each key is the id of a Filter, whose value is an array containing its selectedFilterOptions.This property represents the current set of selected filter options, and other options. If these are updated by changing the property value, the UI in the component will update.
Type:
stringThe id of the
Filterwhich contains area values. The BubblePlot treats this filter differently to the others, so needs this property to identify it.update: The component emits this event when theselectionsare changed by the user, or when the component selects initial values. This event's payload is aPartial<BubblePlotSelections>object, containing only the updated values.- To run unit tests with jest:
npm test - To build distribution files:
npm build - To publish to npm:
- first iterate the version in
package.json - then
npm publish --access public
- first iterate the version in
- To run unit tests with jest:
