Most useRs know about the parallel::mclapply function which can potentially speed up R code (with respect to the standard lapply function) by executing in parallel across several cores. However I did not know that this speedup comes at the price of increased memory usage. In this report I will explore the memory usage of mclapply.
In figure-kilobytes-used.R I benchmarked the memory usage of
LAPPLY(1:N, returnXXX) for several different choices of LAPPLY
(lapply, mclapply, my mclapply maxjobs hack), N (10, …, 100000),
returnXXX. The figure below shows the memory usage as a function of
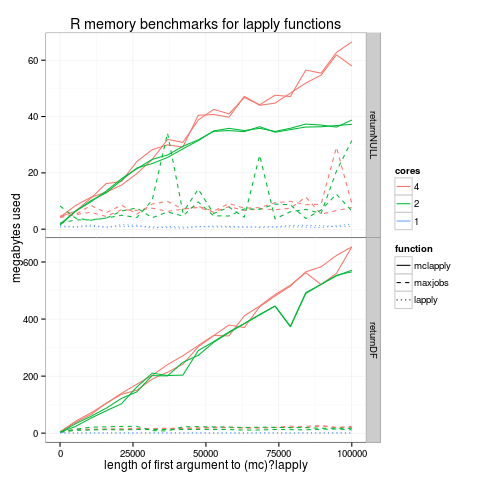
number of iterations (N) for two such returnXXX functions:
returnNULL is a function that just returns NULL. In this case mclapply has a surprisingly significant linear memory overhead. For example, with 4 CPU cores, about 60 megabytes of memory are required on my system for mclapply to process a vector of N=100000 indices, returning a list of 100000 NULL (orange solid lines). In comparison, the standard lapply function has no such overhead (constant memory usage, blue dotted lines). Using 2 cores rather than 4 seems to decrease memory usage for large data sets. The dashed lines show my maxjobs.mclapply hack which just repeatedly runs mclapply with a vector of at most 1000 elements as its first argument.
returnDF is a function that just returns a pre-computed data.frame with 100 rows. In this case the memory overhead is also linear, but the linear factor is much bigger (about 600 megabytes of memory required to process N=100000 indices). Again the standard lapply function has no such overhead. Interestingly, my “maxjobs” hack results in a significant decrease in memory consumption! So in practice I use this in PeakSegJoint to avoid having my jobs killed on the guillimin supercomputer.
References: help(mclapply)
mc.preschedule: if set to ‘TRUE’ then the computation is first divided
          to (at most) as many jobs are there are cores and then the
          jobs are started, each job possibly covering more than one
          value.  If set to ‘FALSE’ then one job is forked for each
          value of ‘X’.  The former is better for short computations or
          large number of values in ‘X’, the latter is better for jobs
          that have high variance of completion time and not too many
          values of ‘X’ compared to ‘mc.cores’.
This benchmark is in the situation with few cores and large number of values in X, so I kept mc.preschedule=TRUE.
> On Sep 2, 2015, at 1:12 PM, Toby Hocking <tdhock5@gmail.com> wrote:
>
> Dear R-devel,
>
> I am running mclapply with many iterations over a function that modifies
> nothing and makes no copies of anything. It is taking up a lot of memory,
> so it seems to me like this is a bug. Should I post this to
> bugs.r-project.org?
>
> A minimal reproducible example can be obtained by first starting a memory
> monitoring program such as htop, and then executing the following code
> while looking at how much memory is being used by the system
>
> library(parallel)
> seconds <- 5
> N <- 100000
> result.list <- mclapply(1:N, function(i)Sys.sleep(1/N*seconds))
>
> On my system, memory usage goes up about 60MB on this example. But it does
> not go up at all if I change mclapply to lapply. Is this a bug?
>
> For a more detailed discussion with a figure that shows that the memory
> overhead is linear in N, please see
> https://github.com/tdhock/mclapply-memory
>

I'm not quite sure what is supposed to be the issue here. One would
expect the memory used will be linear in the number elements you
process - by definition of the task, since you'll be creating linearly
many more objects.

Also using top doesn't actually measure the memory used by R itself
(see FAQ 7.42).

That said, I re-run your script and it didn't look anything like what
you have on your webpage.  For the NULL result you end up dealing will
all the objects you create in your test that overshadow any memory
usage and stabilizes after garbage-collection. As you would expect,
any output of top is essentially bogus up to a gc. How much memory R
will use is essentially governed by the level at which you set the gc
trigger. In real world you actually want that to be fairly high if you
can afford it (in gigabytes, not megabytes), because you get often
much higher performance by delaying gcs if you don't have low total
memory (essentially using the memory as a buffer). Given that the
usage is so negligible, it won't trigger any gc on its own, so you're
just measuring accumulated objects - which will be always higher for
mclapply because of the bookkeeping and serialization involved in the
communication.

The real difference is only in the df case. The reason for it is that
your lapply() there is simply a no-op, because R is smart enough to
realize that you are always returning the same object so it won't
actually create anything and just return a reference back to df - thus
using no memory at all. However, once you split the inputs, your main
session can no longer perform this optimization because the processing
is now in a separate process, so it has no way of knowing that you are
returning the object unmodified. So what you are measuring is a
special case that is arguably not really relevant in real
applications.

Cheers,
Simon
Using top/free to measure memory usage indeed measures things other
than R, but in these experiments I was careful to not run anything
other than the benchmark on the test computer. Another way to measure
memory usage of only R is with ps -p PID_OF_R -o rss, but that
under-estimates R’s true memory usage in this benchmark, since each
parallel process started by mclapply gets its own PID (different
from the PID of the main R process).
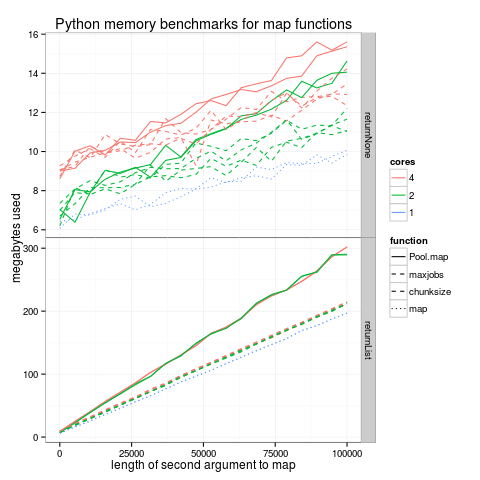
I adapted David Taylor’s multiprocess.py code and ran it with several parameters using multiprocess.sh. The figure below shows an analogous benchmark for the multiprocessing module in Python:
It seems that Python also suffers from the linear memory overhead
(solid lines), but it can be avoided by using the chunksize argument
to Pool.map (dashed lines). It works the same way as my “maxjobs”
hack (dashed lines). The regular map function has the least memory
usage (dotted lines). The memory overhead increases with the number of
cores (top panel, returnNone), but it is not significant for
non-trivial data (bottom panel).
| R function | Python function |
|---|---|
| lapply | map |
| parallel::mclapply | multiprocessing.Pool.map |
| do.call | apply |
Note: In R we have several functions which do basically the same thing
as Python’s map but with slightly different inputs/outputs:
| R serial | R parallel | vector args | scalar args |
|---|---|---|---|
| lapply | mclapply | 1 | 0+ |
| sapply | NA | 1 | 0+ |
| mapply | mcmapply | 1+ | 0+ |
| Map | mcMap | 1+ | 0+ |
From help(Map) in R:
‘Map’ is a simple wrapper to ‘mapply’ which does not attempt to
simplify the result, similar to Common Lisp's ‘mapcar’ (with
arguments being recycled, however).  Future versions may allow
some control of the result type.
sapply and lapply take the same outputs but sapply defaults to
simplify=TRUE:
> Map(rep, 1:4, 4:1)
[[1]]
[1] 1 1 1 1

[[2]]
[1] 2 2 2

[[3]]
[1] 3 3

[[4]]
[1] 4

> mapply(rep, 1:4, 4:1)
[[1]]
[1] 1 1 1 1

[[2]]
[1] 2 2 2

[[3]]
[1] 3 3

[[4]]
[1] 4

> lapply(1:4, rep, 4:1)
Error in FUN(X[[i]], ...) : invalid 'times' argument
> lapply(1:4, rep, 5)
[[1]]
[1] 1 1 1 1 1

[[2]]
[1] 2 2 2 2 2

[[3]]
[1] 3 3 3 3 3

[[4]]
[1] 4 4 4 4 4

> sapply(1:4, rep, 5)
     [,1] [,2] [,3] [,4]
[1,]    1    2    3    4
[2,]    1    2    3    4
[3,]    1    2    3    4
[4,]    1    2    3    4
[5,]    1    2    3    4
> mapply(rep, 1:4, 5)
     [,1] [,2] [,3] [,4]
[1,]    1    2    3    4
[2,]    1    2    3    4
[3,]    1    2    3    4
[4,]    1    2    3    4
[5,]    1    2    3    4
>
Copy works_with_R from https://github.com/tdhock/dotfiles/blob/master/.Rprofile to your ~/.Rprofile, then on the command line cd to this directory.
Type bash multiprocess.sh to run a series of Python benchmarks and
save them in the multiprocess-data/ directory. I did it twice so we
can see the variation between runs. Plot using make
figure-multiprocess.png.
To re-do the R benchmark type make figure-kilobytes-used.png.

