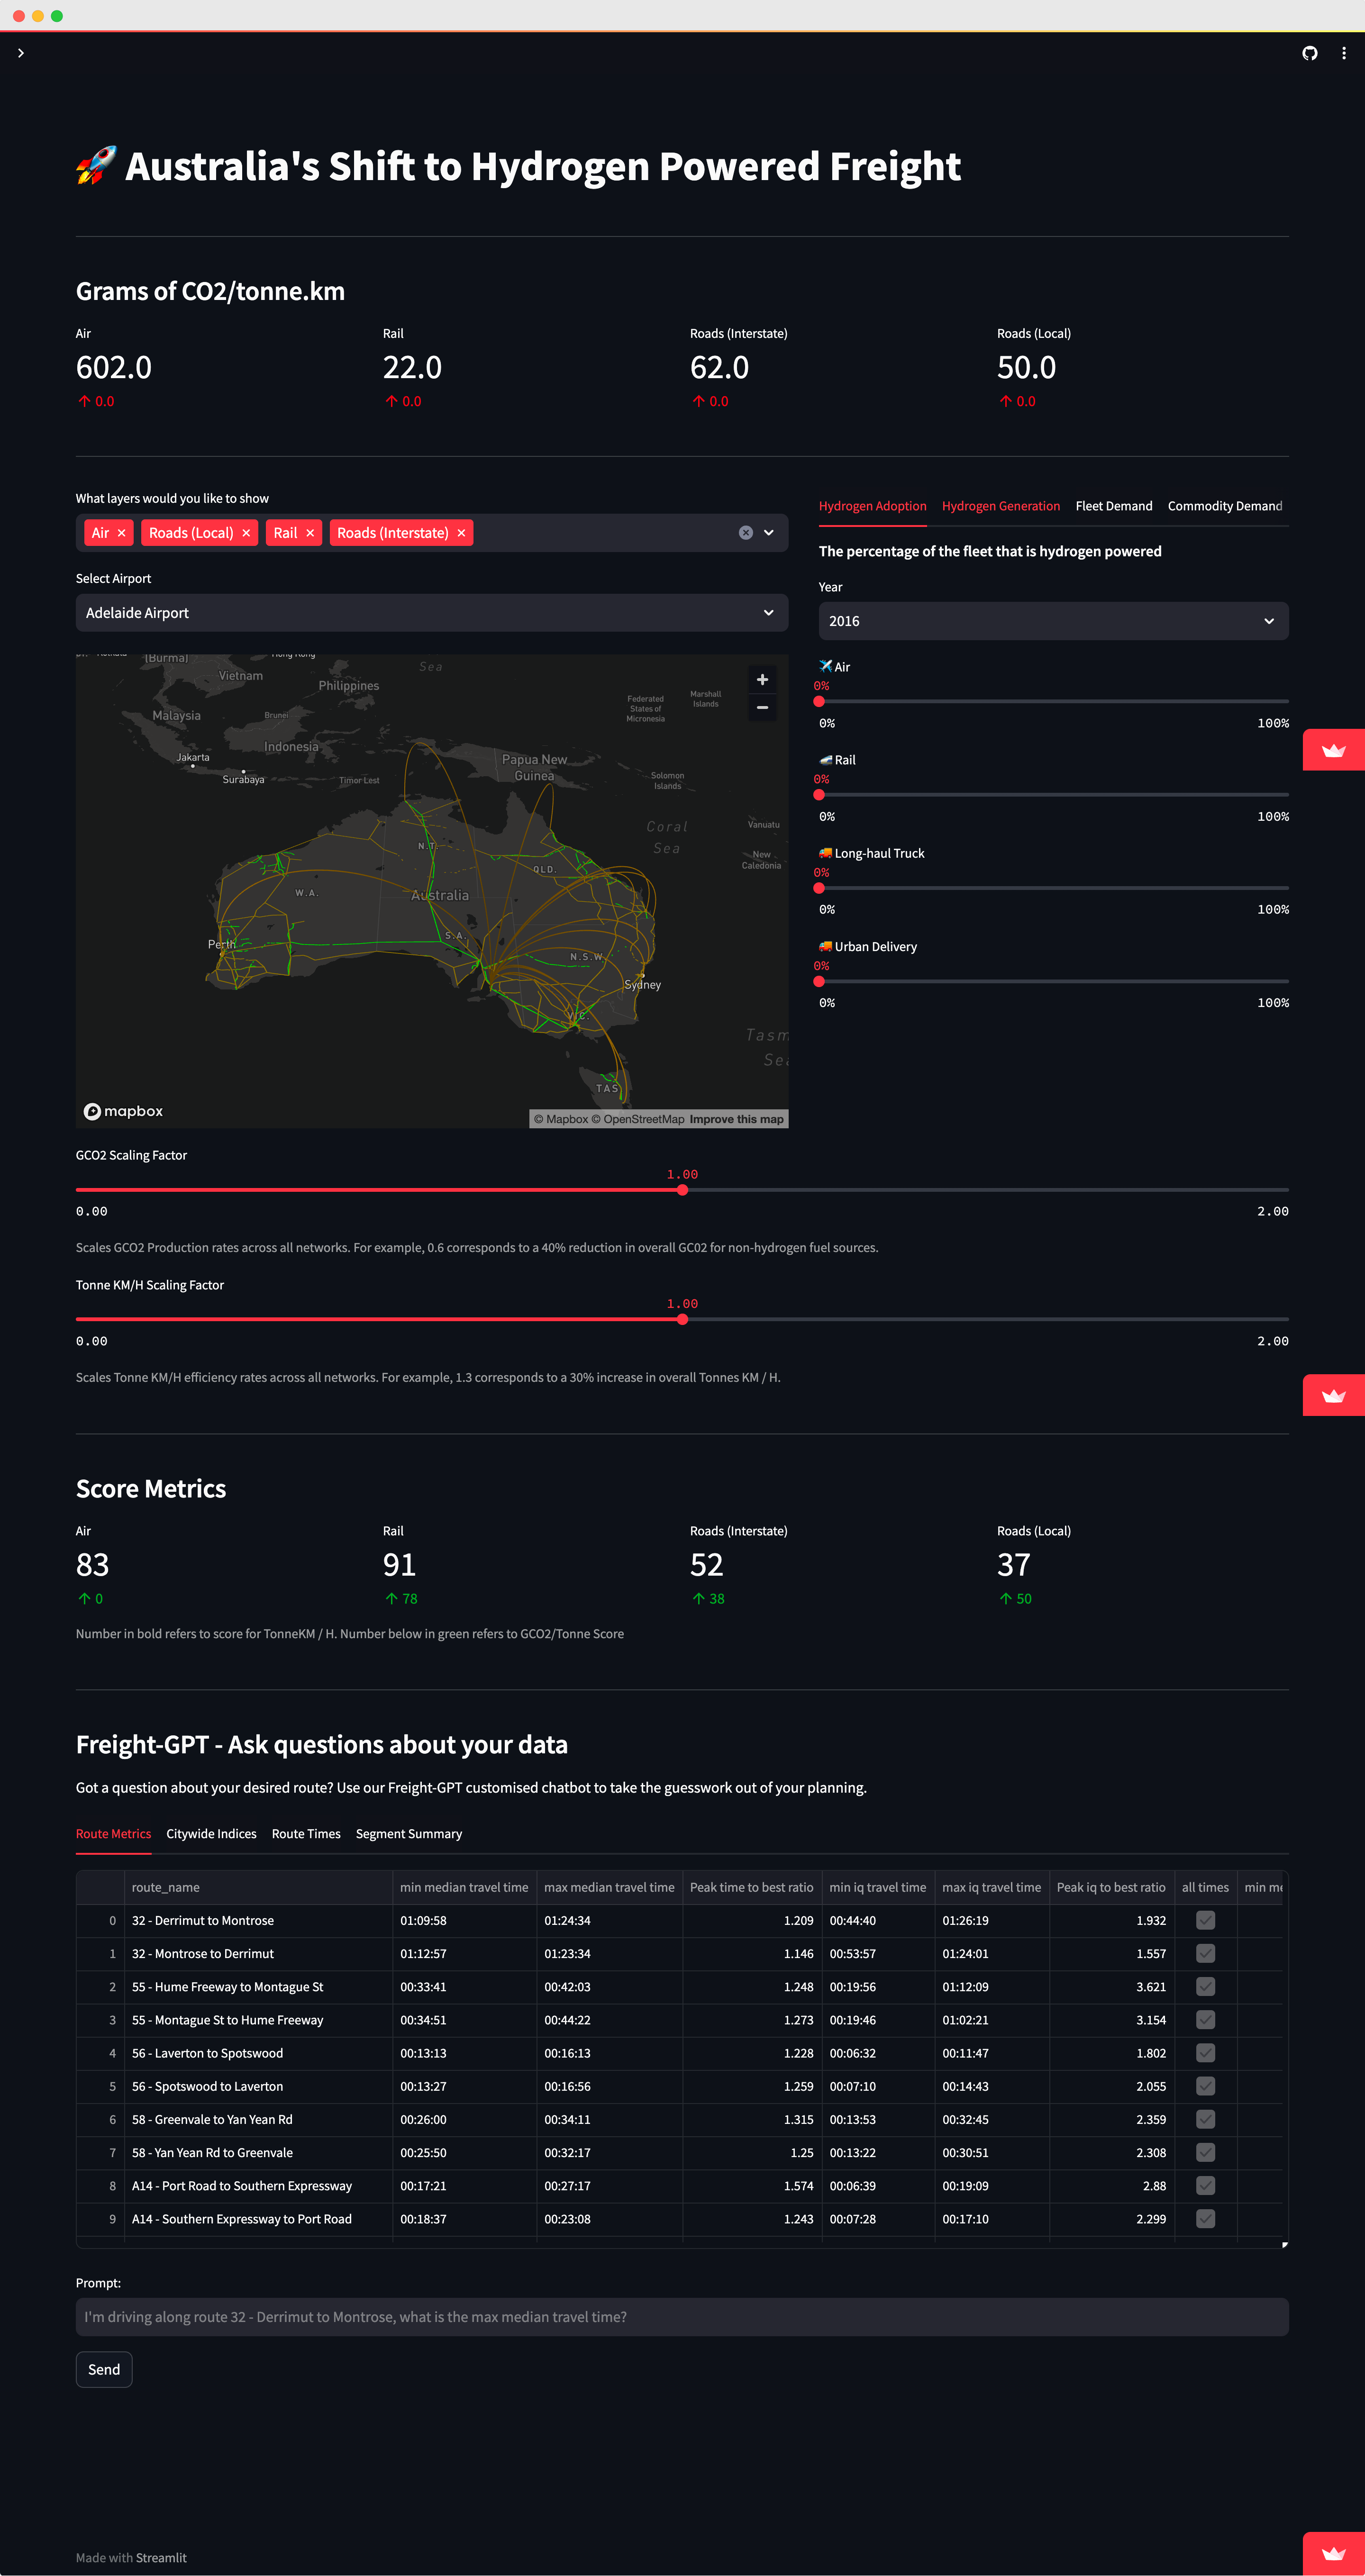
Check it out here: https://freight-analysis-dashboard.streamlit.app/
Clone the repository, and run the command:
streamlit run Dashboard.py
Numerous data sources are used to power this app. They are listed below.
- Freight Vehicle Congestion
- https://data.gov.au/data/dataset/freight-vehicle-congestion-in-australia-s-5-major-cities
- Used to show local roads data on maps.
- National Key Freight Routes Map
- https://catalogue.data.infrastructure.gov.au/dataset/national-key-freight-routes-map
- Used to show national rail and road freight routes on maps.
- Forecasted commodity demand
- https://www.transport.nsw.gov.au/system/files/media/documents/2018/NSW%20Freight%20Commodity%20Demand%20Forecasts%202016-56%5Baccessible%5D_0.pdf
- Used to generate forecast slider values
- CO2 produced from hydrogen generation techniques
- https://www.iea.org/reports/towards-hydrogen-definitions-based-on-their-emissions-intensity
- Used to predict CO2 emissions from hydrogen generation sources
- CO2 emissions from freight transport
- https://www.ecta.com/wp-content/uploads/2021/03/ECTA-CEFIC-GUIDELINE-FOR-MEASURING-AND-MANAGING-CO2-ISSUE-1.pdf
- Used for baseline emissions
- Current production of hydrogen from different sources
- https://iea.blob.core.windows.net/assets/9e3a3493-b9a6-4b7d-b499-7ca48e357561/The_Future_of_Hydrogen.pdf
- Used for baseline hydrogen production
