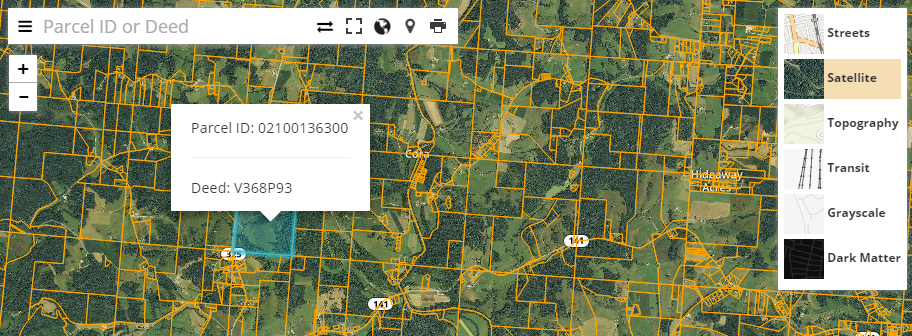
This app uses geojson-vt to cut vector tiles on the fly. Users might also want to use Mapbox GL JS which uses geojson-vt natively. however Mapbox GL JS API does not have search capabilities built in for anything not rendered in the browser window, so those would have to be added separately Mapbox GL JS now has support for supplementing or using exclusively results from local sources - see https://docs.mapbox.com/mapbox-gl-js/example/forward-geocode-custom-data/.
This open data parcel viewer is a client-side app that uses Leaflet to render a whole county parcel map without the need for a GIS server. Try out the demo. This app also includes my modern-ui custom style for the search bar and layer control.
- Search by any field or multiple fields, such as Name and/or Parcel ID
- Sidebar, fullscreen, location, printing (using browser print dialog)
- Render up to (approx) 50k parcels
- Customized layer control with thumbnails
- Similar performance on mobile and desktop
- Data in topojson format, stored in the data folder - see mapshaper
- A string field in the data titled 'index' to house the searchable attributes (with a separator - see the example)
- Jekyll (or download the zip file and build the app manually)
- A free Mapbox API key for using the Mapbox imagery (not necessary, the esri imagery could be used instead)
- A (free) web server such as GitHub, surge.sh, others...
- Create an npm package for the js dependencies
- Convert from L.TileLayer.Canvas to L.GridLayer to be compatible with Leaflet 1.0
- Make a Jekyll option for using vector tiles styled in Mapbox
- Create a function to automatically split the index field and push all the index 'fields' to the popup or the sidebar
- Add an option to add/remove more/other tools to/from the toolbar
- Convert the toolbar from using leaflet-top leaflet-left to a new customized leaflet control
- Documentation on the various options in geojson-vt and the drawing on canvas function
- Add real support for multiple field search - possibly using fuse or typehead (like Leaflet Bootstrap)
Past zoom level 18 the parcels disappear - this is an upstream issue with geojson-vtFixed 04/2016 - The default maxZoom for L.tileLayer.canvas (and L.tileLayer) is 18. In the L.CanvasTiles.js this has been changed to 22.- Pinch and zoom on touch devices causes strange behavior so it is disabled, use the zoom buttons (behind the sidebar) instead
- Zoom animations have been limited to 2 zoom levels for better performance
This app relies on a variety of plugins, but most importantly on the work of mourner, Sumbera, Stephano Cudini and Matthew Bloch.
This app is powered by Jekyll.
