Authors:
Luis Fernando Ramirez | Monserrat López Perez | Rodrigo Dornelles
Last updated: 2025-05-12
This analysis was made as part of the course GRAD-E1457 - Geospatial Analysis for Data Science, taught by Prof. Alexandra Kapp in the Hertie School Master of Data Science for Public Policy Program
Brazil’s state of São Paulo reports hundreds of police-related deaths each year, but the where and why behind those deaths remain poorly understood. Using 2022 census micro-data, detailed shapefiles, and incident-level police-mortality records (2013-2025), we:
- Geocode individual deaths and assign them to districts.
- Distribute census population and household income down to census-sector slices that align with district borders.
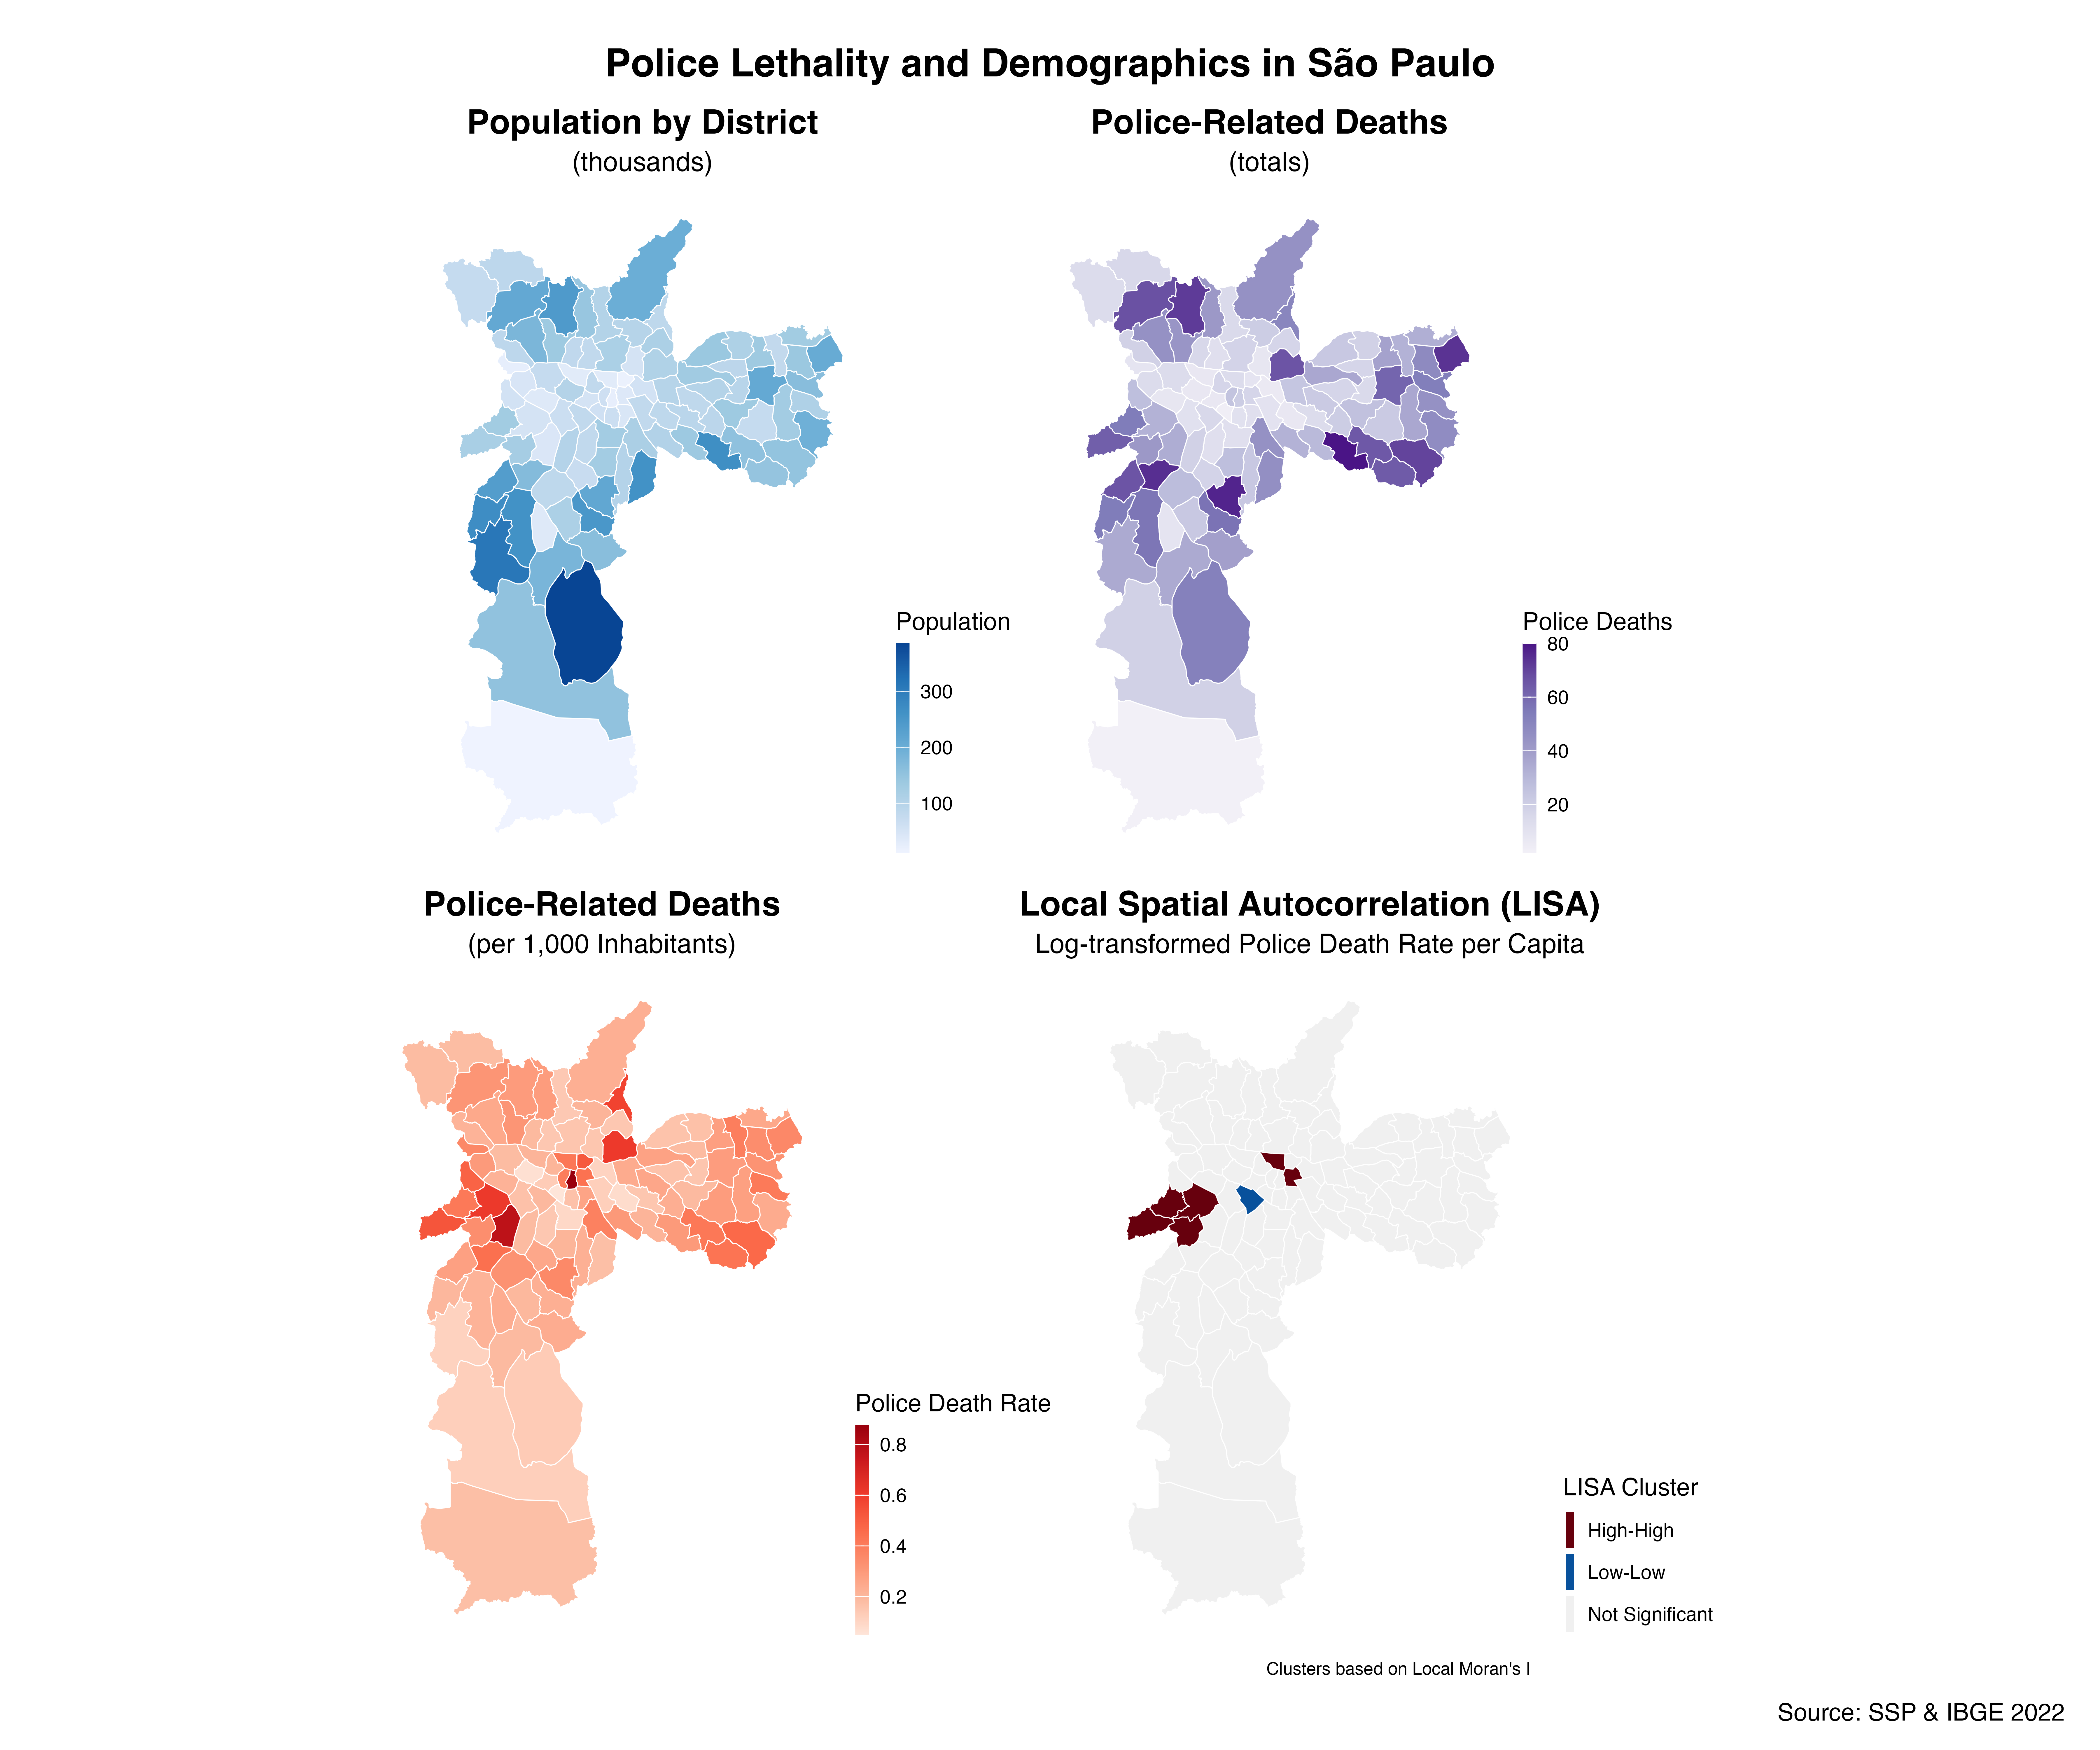
- Map raw counts, per-capita death rates, and Local Indicators of Spatial Association (LISA) clusters.
- Model lethal-force risk with spatial-lag and spatial-error SAR models, testing demographic, income, and urban-form predictors.
The full workflow is scripted in reproducible R Markdown (R/PoliceKillingsFinal.Rmd) and documented below.
├── R/                         # Helper R scripts & functions
├── R/PoliceKillingsFinal.Rmd  # Main analysis / report (this file is the source of the results)
├── data-raw/                  # Original raw data (not tracked by Git LFS)
│   ├── MortesDecorrentesIntervencaoPolicial_2025.xlsx
│   ├── SIRGAS_SHP_*           # IBGE & PMSP shapefiles (districts, census blocks, favelas …)
│   └── bq_data_income_setor_censitario.csv
├── data/                      # Clean, processed data (generated by the R markdown)
│   ├── mortes_policia_clean.rds
│   └── distritos_pop_2022.rds
├── images/                    # Analysis figures exported by R (populated by the Rmd)
│   └── overview_maps.png
├── poster/                    # Conference poster
│   ├── final_poster.pdf
│   └── final_poster.jpg
└── README.md                  # ← you are here
-
Clone the repo:
git clone https://github.com/rfdornelles/geospatial_assignments.git cd geospatial_assignments -
Open R (≥ 4.2) and knit
R/PoliceKillingsFinal.Rmd:rmarkdown::render("R/PoliceKillingsFinal.Rmd")
The first chunk automatically installs and loads all required packages:
c("here", "dplyr", "tidyr", "readr", "ggplot2", "sf", "lubridate",
  "viridis", "ggthemes", "spdep", "spatialreg", "patchwork",
  "janitor", "readxl", "stringr", "broom", "grid")
-
Outputs:
- Cleaned RDS files →
data/ - Figures →
images/ - An HTML report mirroring the Rmd →
R/PoliceKillingsFinal.html
- Cleaned RDS files →
Download full poster → poster/final_poster.pdf
The SAR models use queen-contiguity neighbours via spdep:
nb <- spdep::poly2nb(deaths_map)
lw <- spdep::nb2listw(nb, style = "W")
lag_model <- spatialreg::lagsarlm(
  deaths_log ~ pct_parda + pct_preta + pct_masc + avg_age +
               pct_pm + pct_favela + income_per_capita + pop_density,
  data = model_data,
  listw = lw
)
summary(lag_model)
See Section 6 & 7 of R/PoliceKillingsFinal.Rmd for full diagnostics, Moran’s I on residuals, and coefficient tables.
All authors contributed equally. - Modeling: Luis Ramirez - Visualization: Monserrat López - Data wrangling: Rodrigo Dornelles
- Code: MIT License (see
LICENSE). - Cite this project as:
@misc{ramirez2025police_lethality_sp,
  author   = {Luis Fernando Ramirez Ruiz and Monserrat López Perez and Rodrigo Dornelles},
  title    = {Geospatial Analysis of Police Lethality in São Paulo},
  year     = {2025},
  url      = {https://github.com/rfdornelles/geospatial_assignments}
}- SSP-SP for releasing incident-level lethality data.
- IBGE 2022 Census team for open micro-data & shapefiles.
- R-Spatial community for
sf,spdep, andspatialreg.
Questions or ideas? Open an issue!
