This repo contains the data, references, and code used to analyze the effect of temperature variations on deaths. The project is part of the assignments in the discipline "Machine Learning" at the Hertie School, and the teacher is Prof. Slava Jankin, Ph.D.
The group used data from the population (actual and projections) and temperature (real and the scenarios from RCP 4.5 and 8.5) to find a relationship between them and deaths due to excess heat or cold.
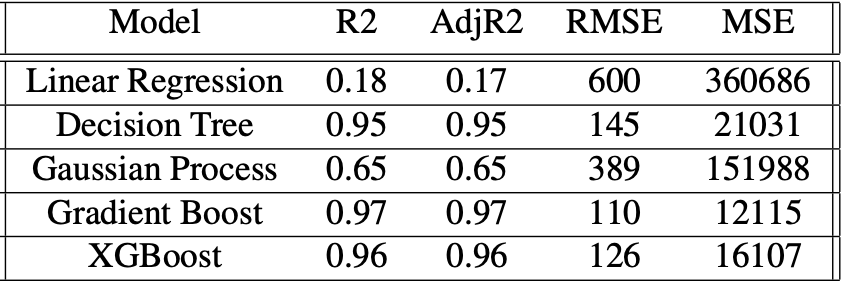
Several models were tested and compared according to their R2, AdjR2, RMSE, and MSE. Finally, we selected Gradient Boost and XGBoost to run four predictions (2 scenarios each).
The final predictions were only considering Germany, betweeen the years 2021-2050.
Please check the Colab Notebook for more details and the R folder to better understand the data-wrangling process.
2022-12-08
Charon, in Greek mythology, was responsible for conducting Hades’ boat between the world of the living and the dead. Aside from the slightly morbid associations, we hoped to connect the worlds of data science and public policy with our work. Using the Charon allegory, we want to explore the serious consequences of our changing climate and its impact on people’s lives.
In this post, we want to share one of the most exciting tasks we have had in our Master of Data Science for Public Policy at the Hertie School. Firstly, we will contextualize and explain why and how we decided to use a machine-learning model.
Studying data science at a public policy school means looking for ways to use data to address society’s challenges. Among the world’s myriad problems today, climate change is perhaps the most important and existential. It will impact all countries and affect the world’s economies, societies, and basic habitability. The challenges posed by climate change are not abstract but are something we all face in our day-to-day lives. The Hertie School, for instance, has sought to foreground questions of climate change through the Centre for Sustainability and the Sustainable Campus Initiative.
In 2002, the World Health Organization reported for the first time on the health impacts of climate change. This report, however, did not include predictions of excess deaths due to heat-related impacts and temperature variation because of the complexity of modeling a relationship between ambient temperature and mortality.
Machine learning approaches have matured significantly since the publication of that report, and data on the impact of man-made climate change has become more readily and freely available to the research community. As a result, machine learning is an essential tool for citizens and policymakers to better understand the impact of climate change. Using machine learning, we can simulate scenarios, estimate the influence of different factors, predict inevitable consequences, and recommend mitigation measures.
That’s what we’re going to do.
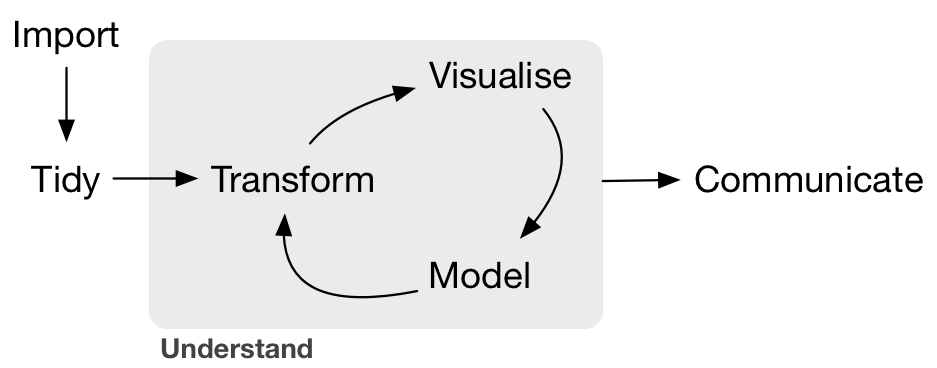
The main ingredient of a data science project is… data. So, we spent a considerable time thinking about which variables we would use and where to find them.
For this specific task of predicting how temperature impacts mortality,
we identified several reliable public data sources. We gathered a range
of relevant data sets. By sourcing our data from recognized national and
international institutions, such as the World Health Organization, World
Bank, and the Federal Statistical Office of Germany, we could be
confident in the quality of our data.
For the project as a whole, we collected data on the following:
- Historical and predicted population data for Germany
- Actual and predicted population in different age groups
- Mortality rate and leading causes of death
- Temperature forecasting in line with the IPCC high-emissions scenario Representative Concentration Pathway (RCP), also called RCP8.5.
- Temperature forecasting in line with the low-emissions scenario also called RCP4.5.
- Emissions, especially CO2 and CFCs
But collecting the data was only the first step. After collecting many different tables (in many complex and sometimes tricky formats), we created a dataset containing countries, years (from 1991 to 2050), and the temperature from each country and each year. As we had data from how many people died due to excess heat or cold until 2019, we decided that this would be our last year and, from 2020 onwards, we would make predictions.
## # A tibble: 6 × 6
##    year country  temp population qnt_death_heat_cold_exposure temp_diff
##   <dbl> <chr>   <dbl>      <dbl>                        <dbl>     <dbl>
## 1  1991 Germany  6.10   80013896                          204    0.0424
## 2  1992 Germany  6.16   80624598                          204    0.0607
## 3  1993 Germany  6.20   81156363                          211    0.0410
## 4  1994 Germany  6.23   81438348                          211    0.0310
## 5  1995 Germany  6.28   81678051                          225    0.0486
## 6  1996 Germany  6.30   81914831                          232    0.0194
And, regarding predictions, we decided to predict outcomes in two distinct, but possible climate scenarios: the most grave, using RCP 8.5 (estimating the highest level of emissions, and, thus, the higher temperatures), and the less grave, using RCP 4.5. And for the population, we used projections made by the World Bank.
So, with our data wrangled, we were ready to build the models.
Before explaining the method, it’s important to explain some aspects of machine learning, in case you don’t know. We’ll try to explain how we used Python and a framework known as Scikit-Learn to tackle this task.
Machine learning are techniques used for “teach” our computers about a specific phenomenon and then make it possible for the computer to predict other scenarios by giving different values.
So, in our case, we fed our model with the data, and the computer produced many different simulations to find the right formula. Knowing this “secret,” once changing a parameter (for instance, a new year, population, and temperature), the model would be able to give us a new (and, until then, unknown) value.
Using the train data, the machine tries to find the best parameters to fit an equation, simulating the best values until it best fits the test data. It tries thousands of different results until it finds the best combination. The machine can do, in a few seconds, what would take us many hours, days, or even weeks.
And, since it is possible (and very easy!) to try many different models, we chose several possibilities of regression models (since the objective was to predict a numeric value, not a classification). We chose linear regression (the simplest), decision tree, gradient boost, and XGBoost.
This process gave us different models; and we could then decide which one was the most suitable to our task.
So, we decided to try some metrics that could be common to all models used (that we could use to compare them):
-
Coefficient of determination or R2 (R-squared): explains how much of the dependent variable (deaths) were explained by the predictors
-
AdjR2: similar to R2, but adjusted to the number of variables (in our case, as we had only a few, it was not that relevant)
-
RMSE (root-mean-square error): reflects the errors (meaning the difference between the results estimated and the real ones) of the model, meaning that the lower, the better
-
MSE (mean squared error): also reflects the average of the errors obtained in the model
Looking at our results, we decided to pick only the Gradient Boost and XGBoost models. Those are three-based models, where the dataset is divided by variables, and many different paths are tested several times. (Yep, it could be complicated fast, but it’s also powerful!).
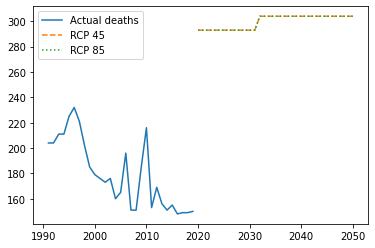
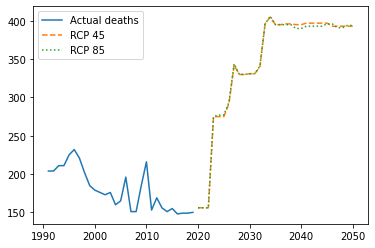
Choosing those two models, we gave them the prediction data: a dataset containing the projections of population and temperature from Germany from 2020 to 2050. One version uses the temperatures of the RCP 4.5 scenario, and the other uses RCP 8.5.
The XGBoost results looked like this:
And Gradient Boost is like this:
Although not perfect, our models showed us that, indeed, a relevant increase in the number of deaths due to climate change is expected. There is an essential positive relation between temperature rise and future deaths due to climate change.
On the other hand, our models needed to be more precise to estimate the differences in both scenarios. And, probably, the big jump in deaths in the next five years is not accurate.
It might suggest that those impacts would only be relevant in a future scenario, not in the very short term. But, also, it might indicate that even in the less grave scenario, the situation is already critical. In the end, one evitable death is already too much.
As an experimental model, it should not be considered automatically or acritically. However, we learned that teaching machines is a valuable tool. Moreover, state of the art in machine learning allows us to make good predictions quickly and easy. (Note: we played with the famous ChatGPT, and it could write a full script to fit an XGBoost model to us. Check it here.).
But, naturally, the predictions, in this case, were still very simplistic. Therefore, we probably would need to consider more variables and find in the literature other valuable predictors.
But, even though, our preliminary conclusions do not allow climate negationists to undermine the grave consequences of climate change only if the model is not wholly accurate in the next few years.
The most evident outcome is that Charon is thrilled with this climate chaos and will work a lot in the next few years. So let’s do our best to cheat him as much as possible!
We opened this blog post with a picture of Charon that was generated by the artificial intelligence of DALL-E 2, and intends to represent the idea of Charon, climate change and the role of machines and artificial intelligence on helping us to overcome this crisis. The original image is above, and Gustave Doré painted it for an 1861 edition of Dante’s Inferno (The Divine Comedy).
Also, we gave as an example a short Python script written by ChatGPT artificial intelligence. It was generated by providing a short prompt explaining our intention to predict deaths using county, year, and temperature.
Those two examples might spark some reflections about the following uses of machine learning, deep learning, and artificial intelligence to tackle urgent and complex problems.
Fernando Corral Lozada - f.corral@students.hertie-school.org
Paul Sharratt - p.sharratt@students.hertie-school.org
Rodrigo Filippi Dornelles - r.Dornelles@students.hertie-school.org
