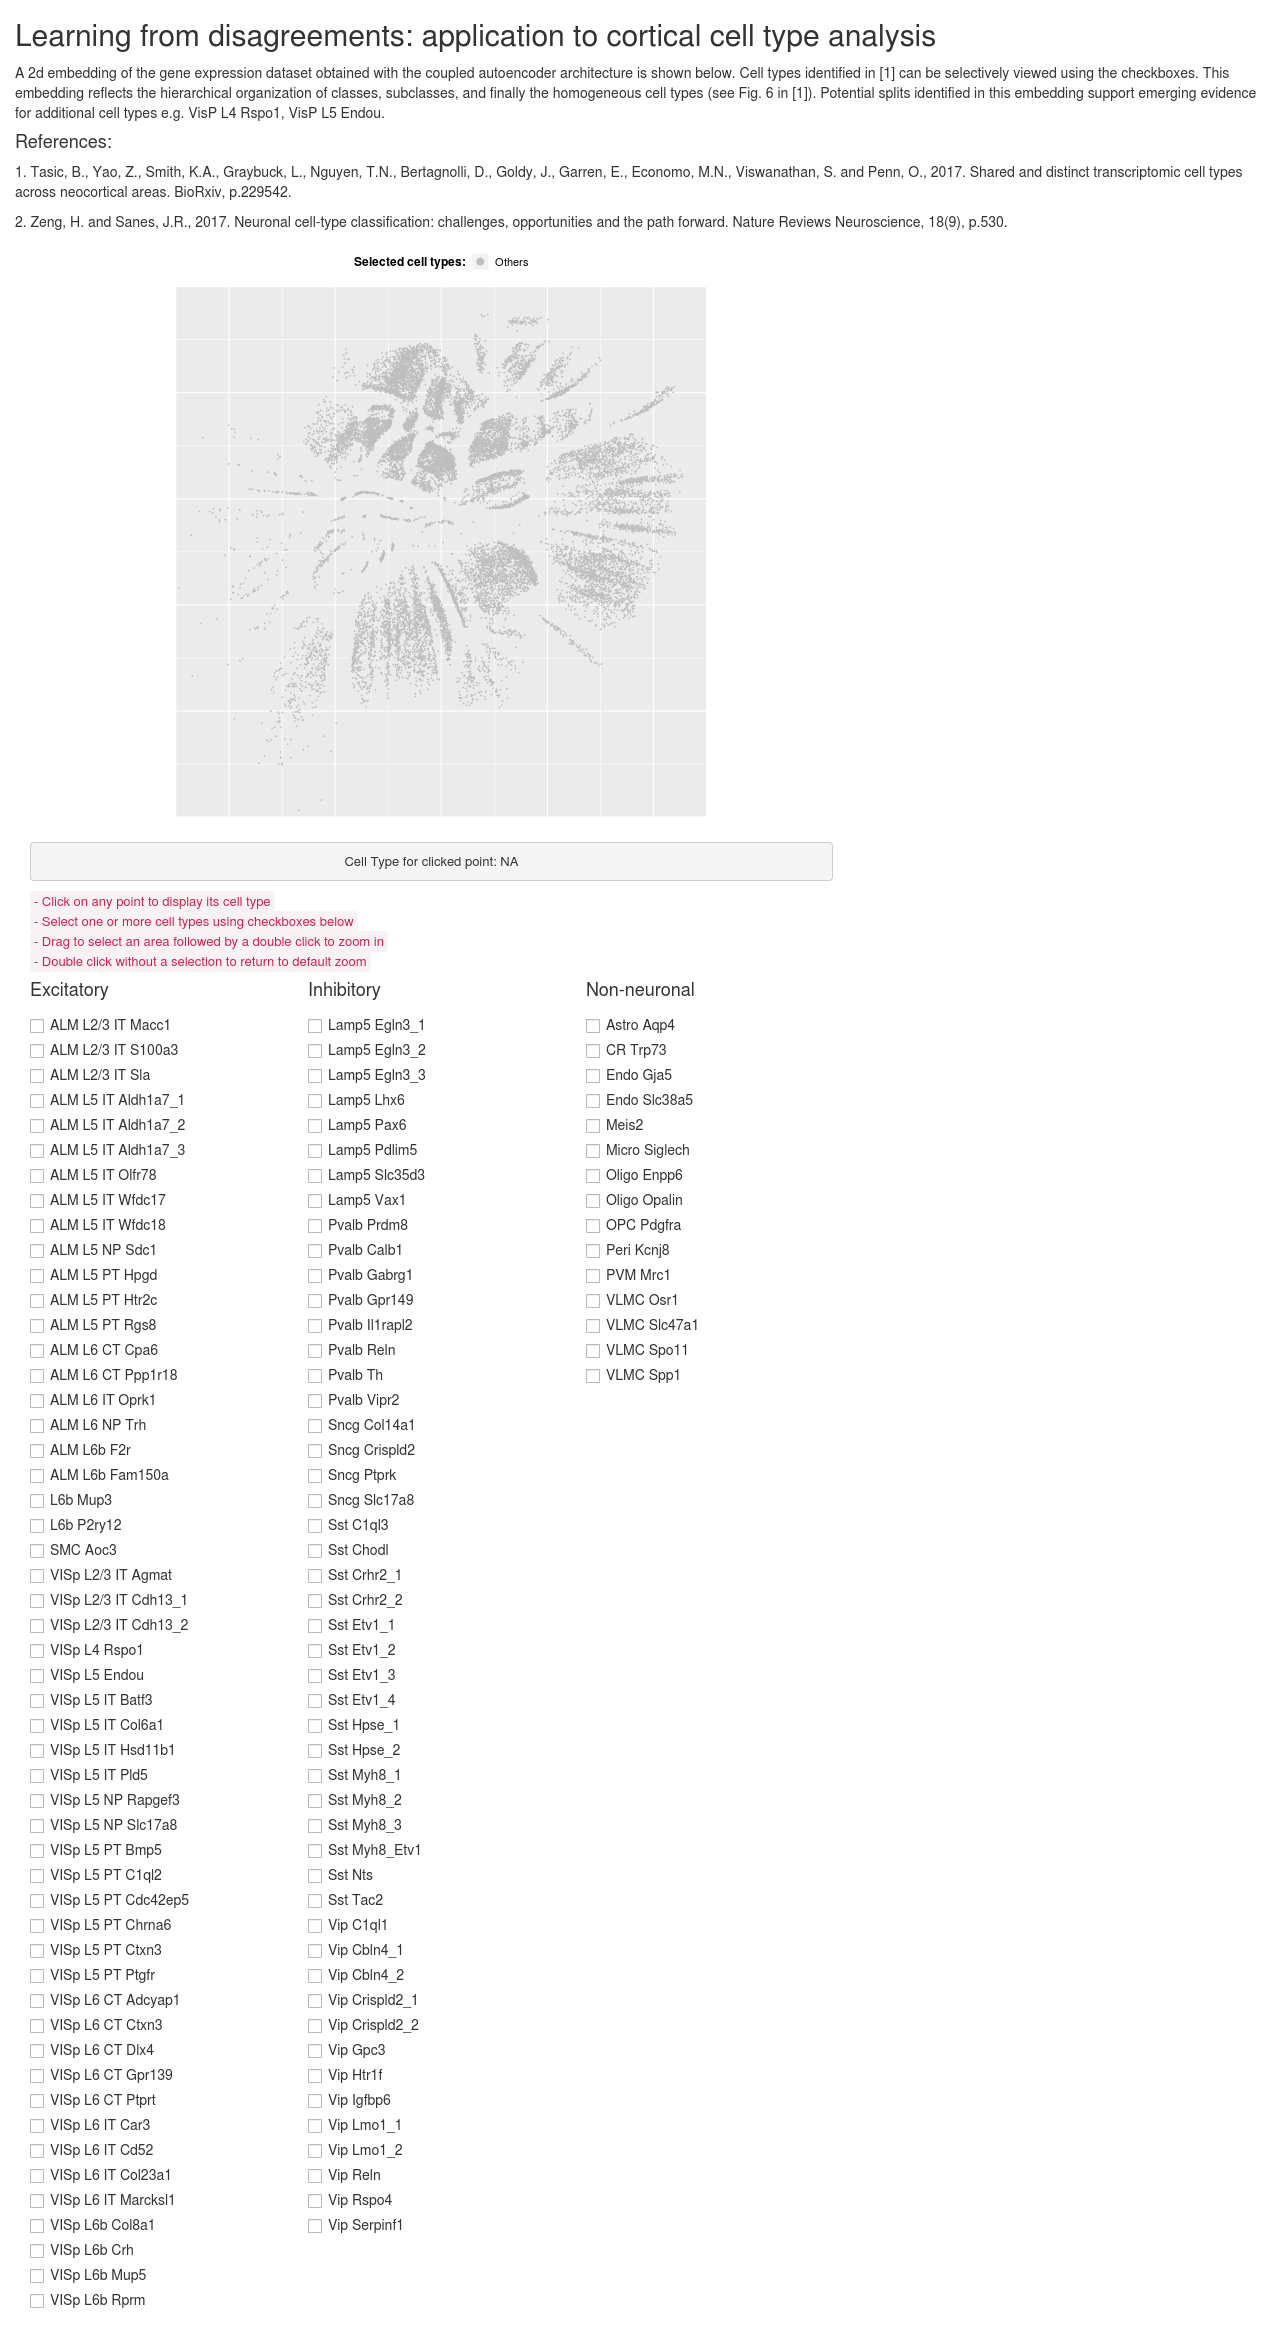
This was a simple visualization tool with shiny and R I made to inspect an unsupervised 2D representation of scRNA seq data for brain cells published in Tasic 2018. We were writing a paper related to the topic at the time, and I coded up this app as an excuse to learn some rudimentary R.
The app may be accessed at https://cortical-types.shinyapps.io/nips18/ - depending on the monthly quota restrictions for free hosting from https://www.shinyapps.io/.
Each dot on the scatterplot corresponds to one cell in the representation. The colors indicate cell type labels. The key observations were:
- Cells with the same type label group together
- Hierarchical relationships of the cell types are preserved (e.g. neurons appear separate compared to non-neuronal cells, within neurons the inhibitory cells appear searated from excitatory cells etc.)
- Click on any point to display its cell type annotation
- Select one or more cell types using checkboxes below
- Drag to select an area followed by a double click to zoom in
- Double click without a selection to return to default zoom
Here is a screenshot of the live app:
